Water resource allocation maps offer a crucial solution to the challenge of uneven water distribution. This article explores their pivotal role in promoting fairness, sustainability, and resilience in communities. With insights from MAPOG Map Analysis, we unveil how these maps are transforming the water management landscape.
KEY CONCEPTS
Our goal is to create a map of water resource distribution and allocation to the nearby demand points like villages around a water reservoir. We use the Polylines to map out the Pipelines from the reservoir to the demand points in the map.
The pipelines will ensure the effortless supply of water from the source to the demand.
This map serves as a base for further decision-making like Create Map for Analyzing Water Quality using Heat Map Style and Biodiversity Conservation: Step-by-Step Guide to Clip Polygon for Effective Maps
Steps for Creating Water Resource Allocation Map
Below are the steps to follow to create the map
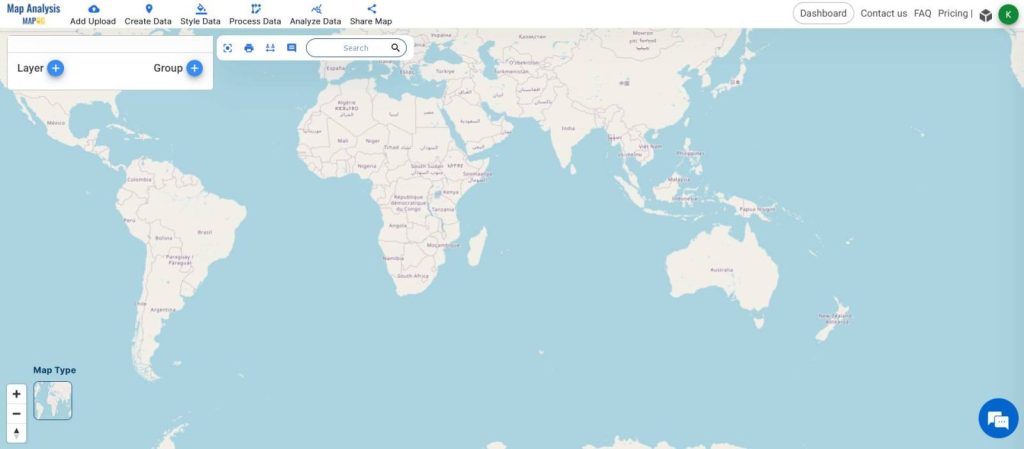
- Open Map Analysis
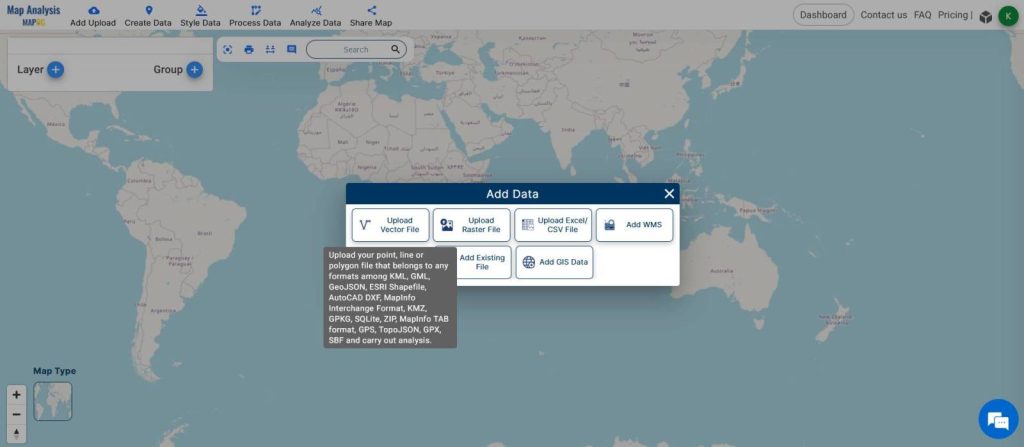
- From Add Upload, Add Vector Data
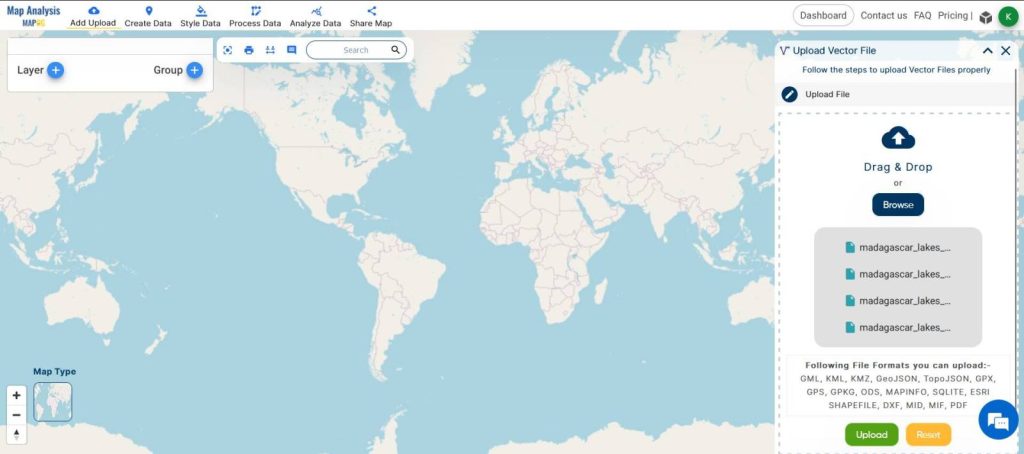
- Upload Shapefiles of the Study Area.
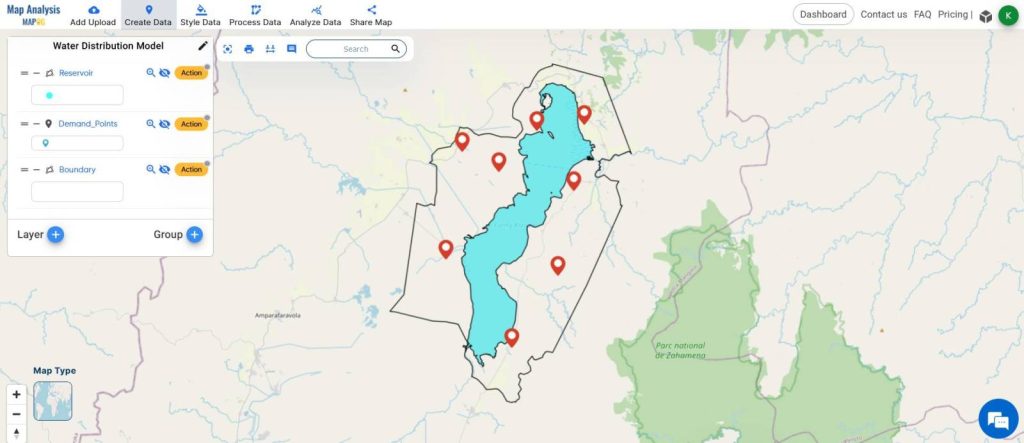
- Do the same for Resrevoirs and Demand Points.
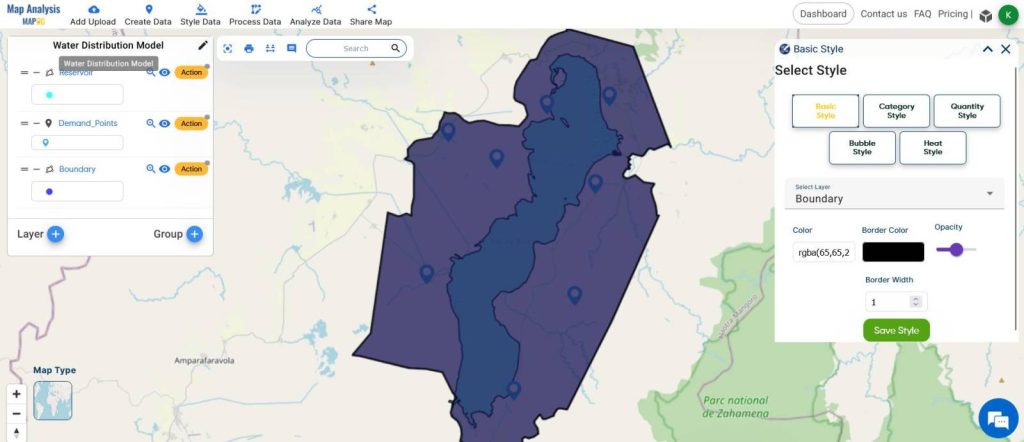
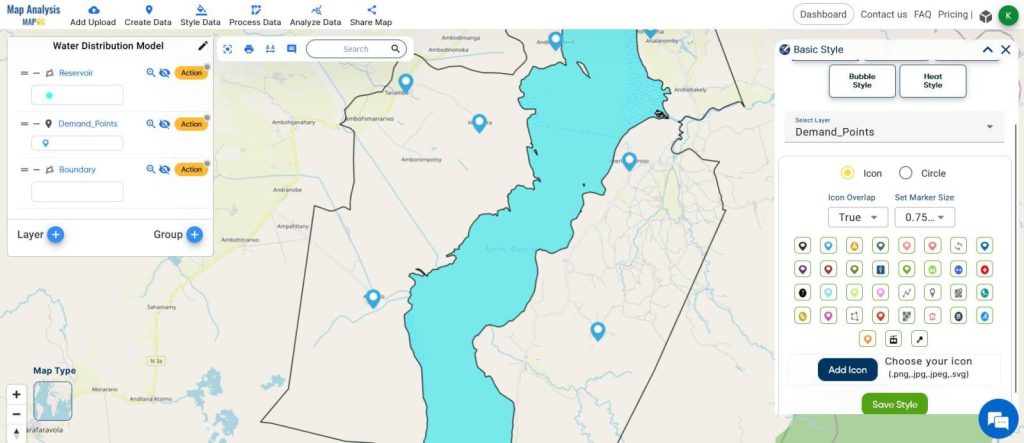
- Style the layers with the Basic Style Tools
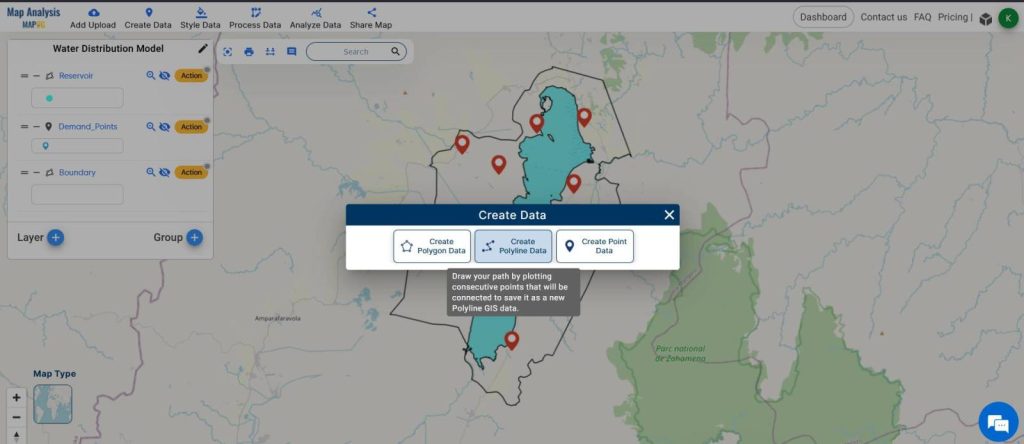
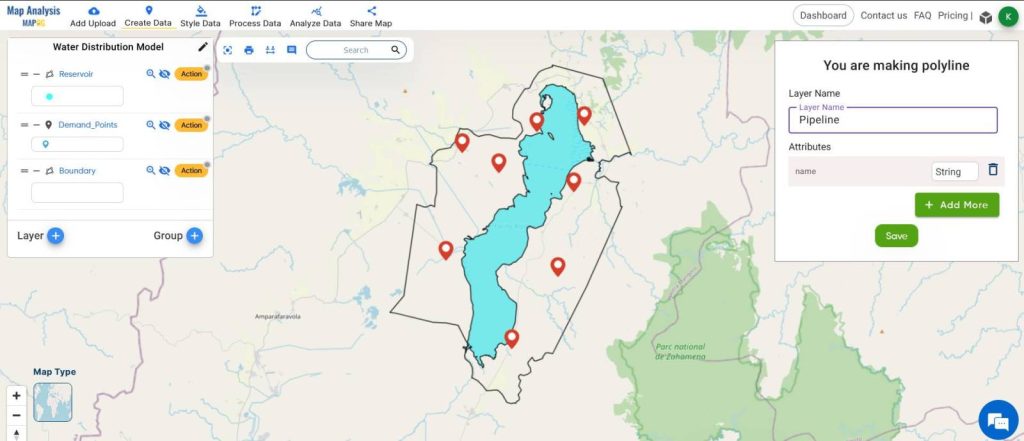
- From the Create Data toolbar, click on Create Polyline Data
- Name the layer and click save
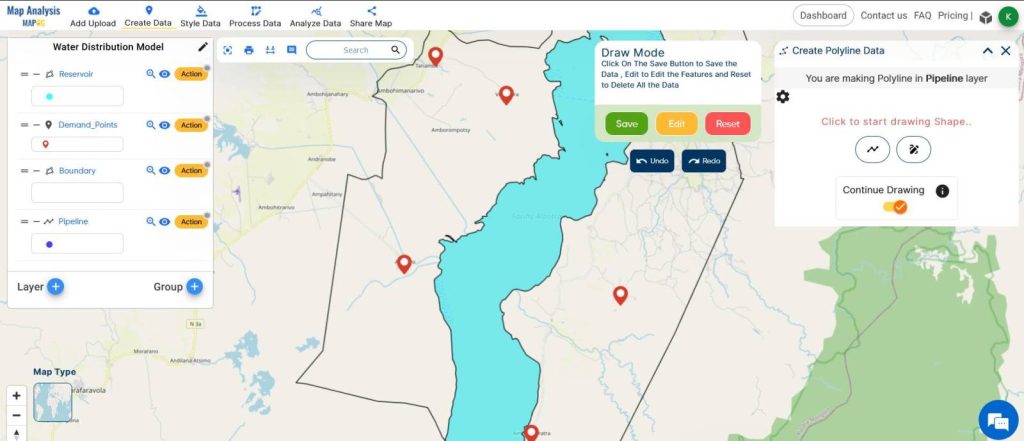
- Enable continue to Draw from the right side window
- Start drawing the lines from the edge of the reservoir to the demand points.
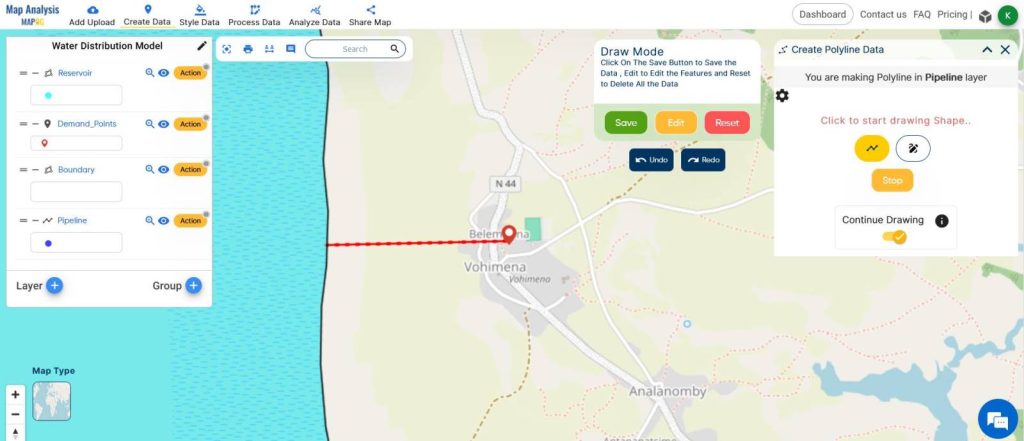
- Make sure to draw the pipelines in the shortest distance possible.
- Once done, click on Save.
- Lines will be created.
During the creation of these pipelines, it’s important to note that this may not represent the exact pipeline layout, and there might be some barriers during installation. Just to clarify, I’m using these pipelines solely for demonstration purposes to showcase the functionality of the polyline tool.
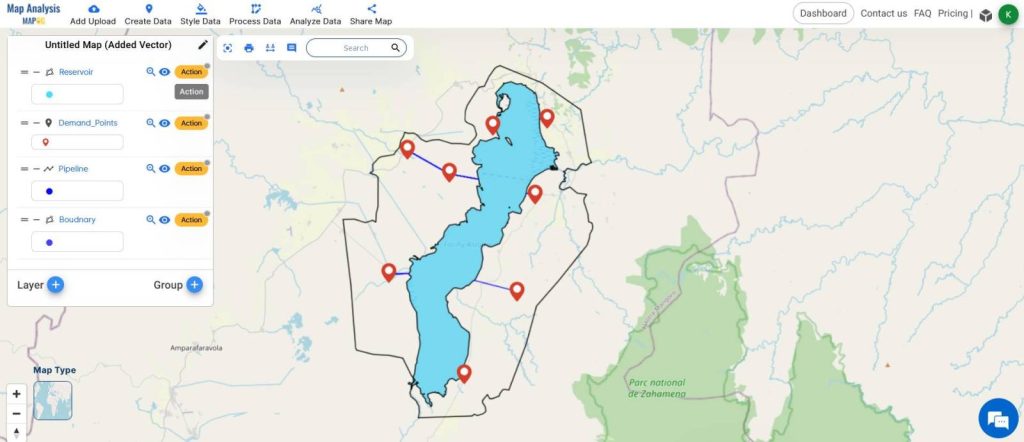
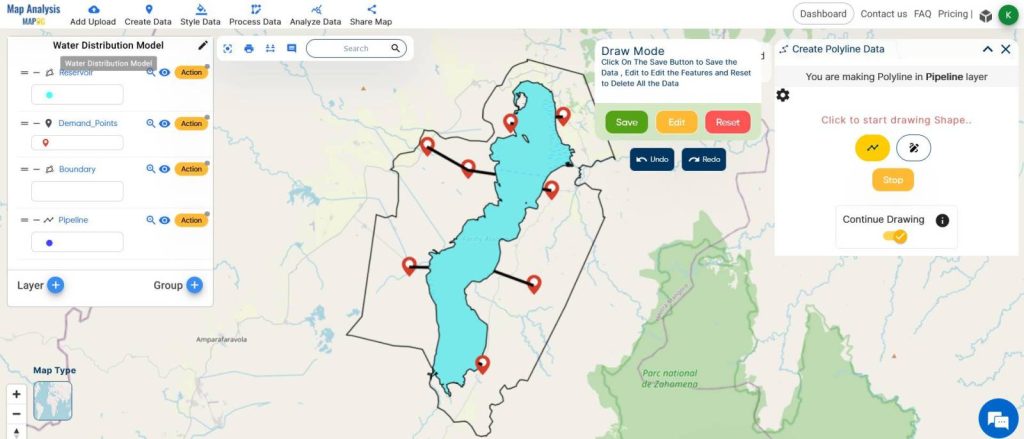
This is the Final Map

The created lines serve as a basic foundation for the installation of pipelines from the water body to the demand points.
From this, the infrastructure planners can identify the areas for pipeline installations, and use this map along with elevation data to point out potential spots to install water tanks for storage.
This helps allocate water resources to the villages and other demand points around the reservoirs.
MAJOR FINDINGS
- Identification of inefficiencies in current water distribution systems, highlighting areas with limited access or bottlenecks.
- Optimization recommendations for routing water infrastructure to improve distribution efficiency and equity among villages.
- Insights into potential resilience strategies to mitigate risks and ensure continuity of water supply, particularly in the face of environmental hazards or disruptions.
BENEFICIAL DOMAIN: Community Development and Environmental Sustainability
- Community Development: Through MAPOG’s analytical tools, optimized water resource allocation fosters improved living standards, health, and economic development within villages and communities.
- Environmental Sustainability: MAPOG’s analysis facilitates efficient water distribution, reducing waste and environmental impact, thus promoting the sustainable management of water resources and ecosystem health.
For any inquiries or support needs, feel free to contact us at support@mapog.com.
CONCLUSION
So, with MAPOG Map Analysis at the helm, we’ve unraveled the complexities of water resource allocation. By streamlining distribution routes and enhancing accessibility, MAPOG has set the stage for community empowerment and environmental stewardship. As we journey forward, let’s continue harnessing the power of MAPOG’s insights to ensure a future where water is not just a resource, but a lifeline for all.
VIEW OUR PREVIOUS BLOGS
Precision Agriculture: Using GIS Buffer Zones for Eco-Friendly Fertilizer Management