Welcome to our guide on Working with WMS Data in MAPOG! In this Article, we’ll explore the powerful capabilities of Web Map Service (WMS) and how you can leverage it within the MAPOG platform for enhanced mapping and analysis. WMS provides a standardized method for accessing geospatial data over the web, offering a diverse range of information layers such as satellite imagery, weather data, and population density maps. Join us as we delve into the world of WMS and discover how it can elevate your mapping projects with MAPOG‘s intuitive tools and functionalities.
MAPOG‘s versatile capabilities are widely recognized across domains such as City Planning, Tourism, Army and Rescue, Education Insights, Renewable Energy, Business Advice
Key Concept: Leveraging WMS Data in MAPOG for Population Density Analysis
The key concept revolves around leveraging Web Map Service (WMS) data within the MAPOG platform, with a particular focus on integrating population density information. WMS facilitates the retrieval of diverse geospatial datasets, such as satellite imagery and population density maps, over the web. By integrating population density data into MAPOG, users can enhance their mapping projects with crucial demographic insights. This integration empowers users to analyze spatial patterns, identify demographic trends, and optimize resource allocation strategies across various domains, including digitalization, isochrones, route compass, urban planning, merging tools, and environmental protection. These use cases demonstrate MAPOG‘s versatility in addressing diverse spatial analysis needs and facilitating informed decision-making processes across industries.
Step-by-Step Process: Working with WMS Data
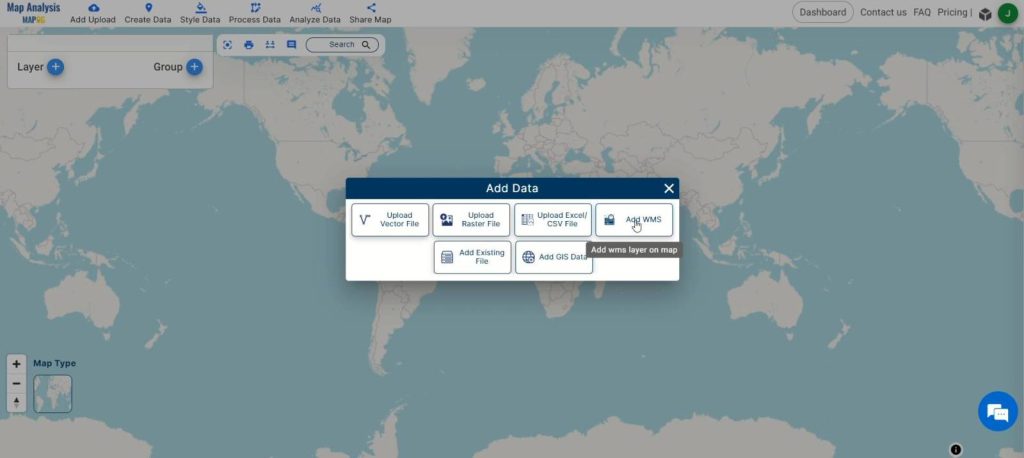
Step 1: Accessing WMS Data:
Open the MAPOG map analysis tool and select “Process Data.” Choose the “Add WMS” tool to access Web Map Service data.
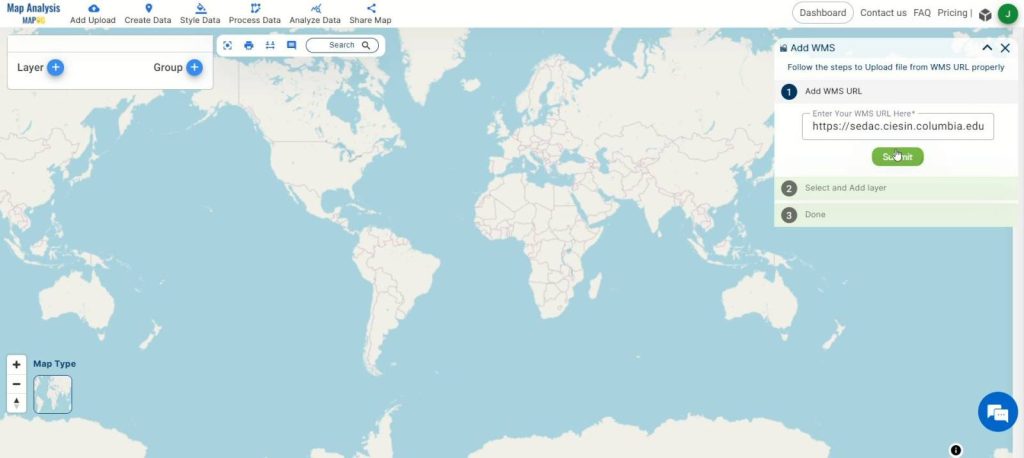
Step 2: Adding Population Density Layer:
Copy and paste the WMS link for the population density layer into the “Add WMS Layer” feature.
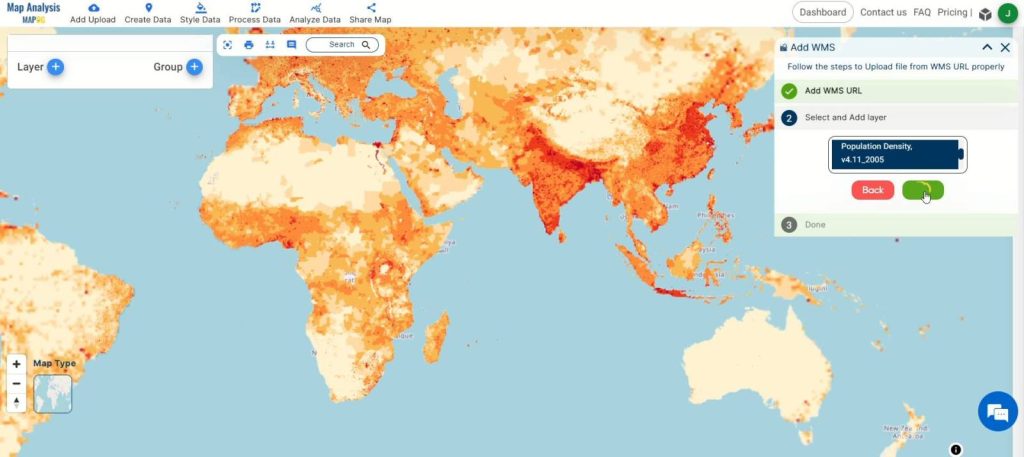
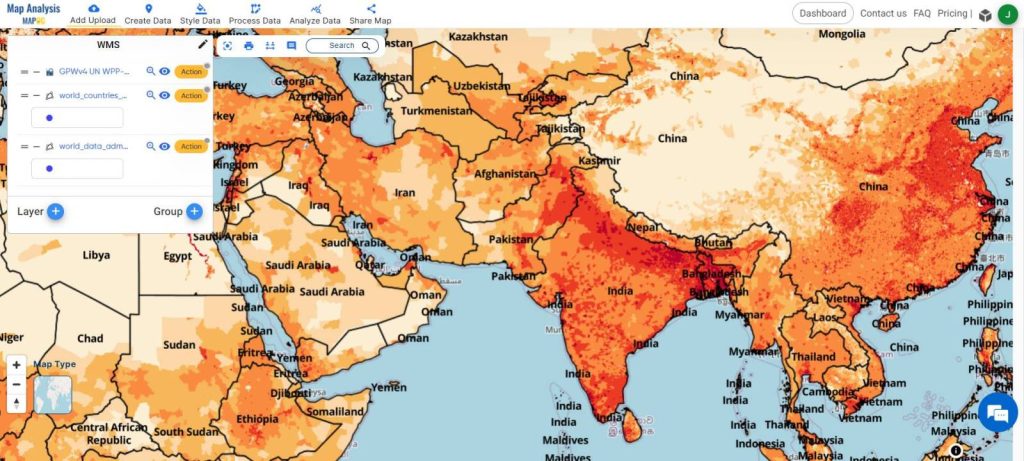
Step 3: Visualizing Population Distribution:
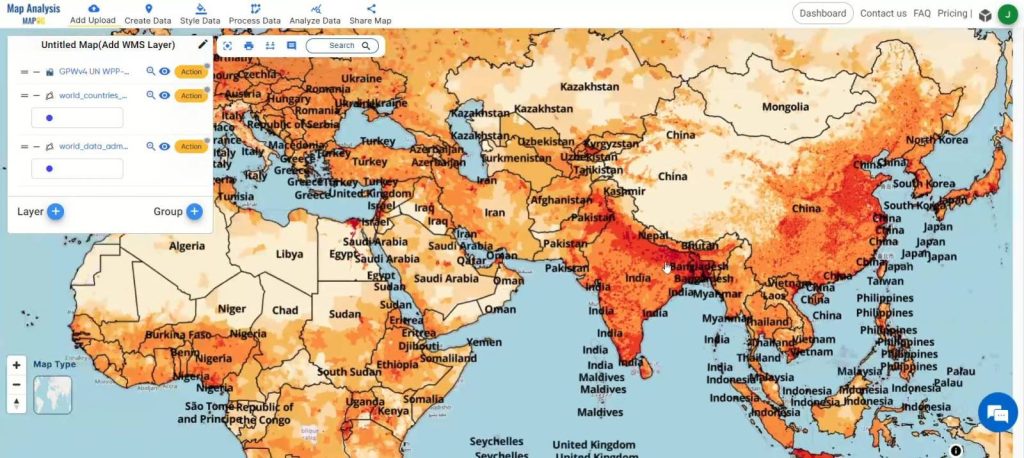
Once the link is added, MAPOG fetches the Population WMS Layer, displaying population distribution on the map.
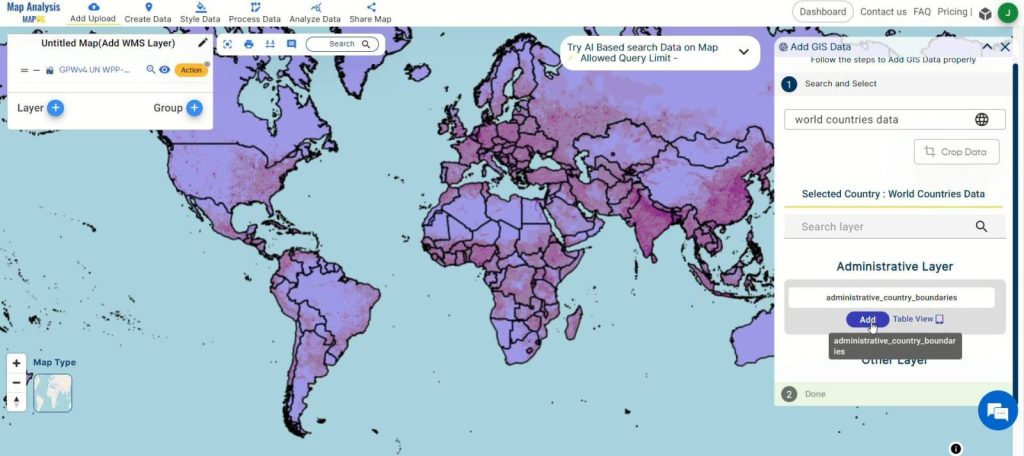
Step 4: .Enhancing Visualization:
To augment understanding, add an administrative boundary layer from MAPOG‘s “Add GIS Data” option.
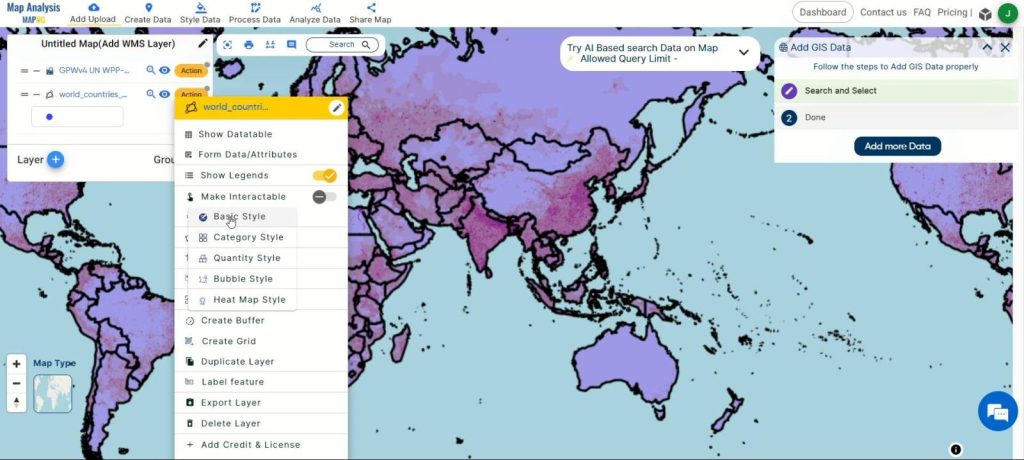
Step 5: Customize Style:
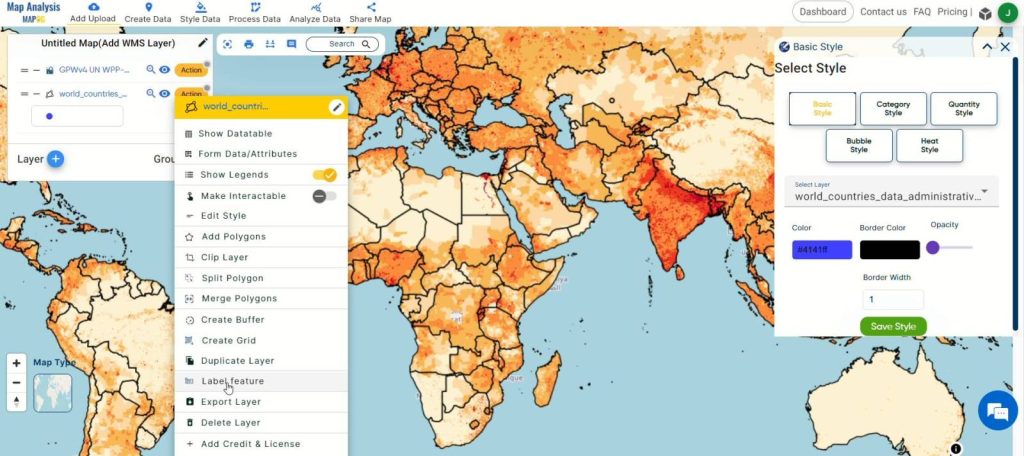
Refine the visual representation of the datasets by clicking on the action button and selecting “Edit Style.” Tailor the appearance to improve clarity and facilitate analysis.
Step 5: Label Key Points: Enhance understanding by labeling key points within the dataset. Click the action button on the desired layer, select ‘Label Feature,’ and apply labels to important locations.
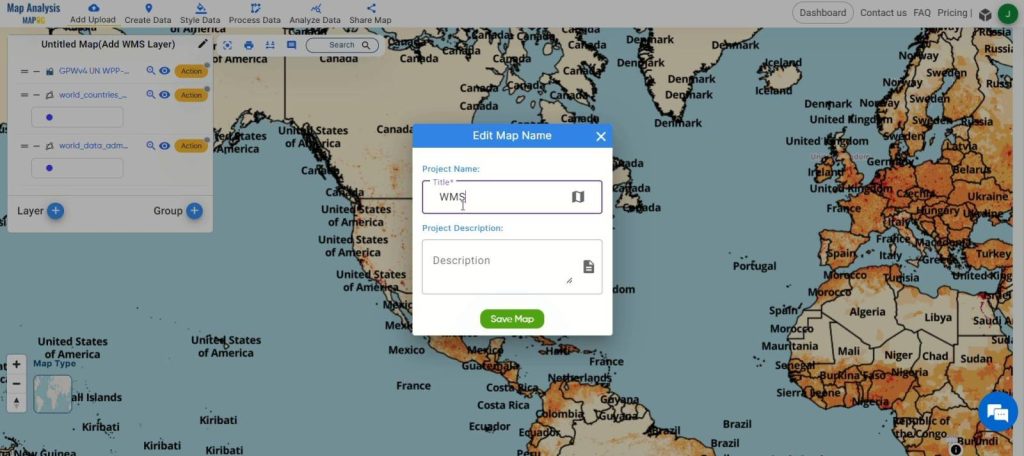
Step 6: Finalize and Save: Click on the pencil icon to rename the map if desired. Then, click “Save Map” to apply the changes and keep your data organized.
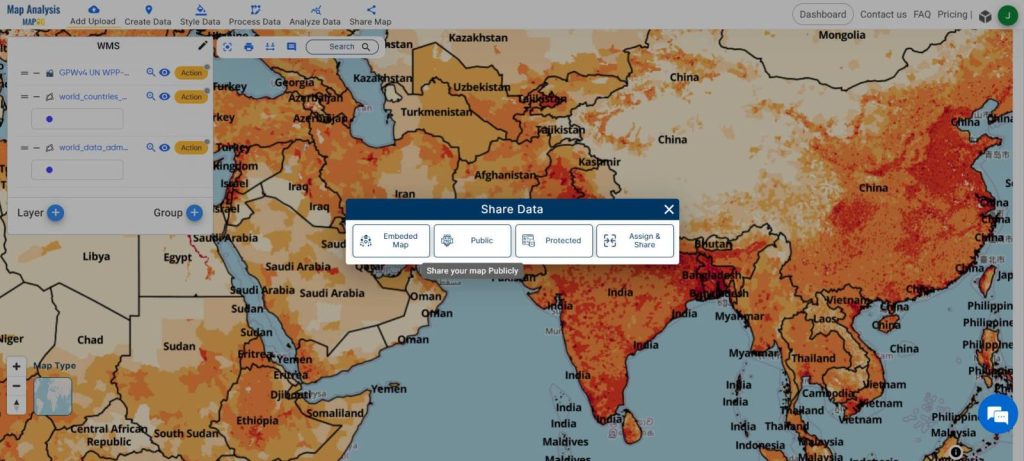
Step 6: Sharing Insights:
Share findings seamlessly with stakeholders to facilitate collaborative decision-making processes.
Major Findings:
Incorporating WMS data, particularly population density layers, into spatial analysis with MAPOG provides valuable insights into demographic trends and distribution patterns. This integration enables users to visualize population data alongside administrative boundaries, facilitating informed decision-making processes in various domains. By leveraging MAPOG‘s capabilities, users can efficiently analyze and interpret spatial data to address complex challenges and optimize resource allocation strategies.
Domains and Industries Benefiting
- Urban Planning
- Public Health
- Market Analysis
- Environmental Conservation
- Transportation Planning
- Emergency Management
- Retail Strategy
- Government Services
- Real Estate Development
- Education Planning
Conclusion
In conclusion, harnessing WMS data within MAPOG unveils a plethora of opportunities for spatial analysis and informed decision-making. With the capability to overlay diverse data layers like population density onto maps, users can extract valuable insights spanning various domains and industries. MAPOG‘s user-friendly interface and extensive functionalities empower users to optimize resource allocation, drive positive outcomes, and make data-driven decisions efficiently. Explore the potential of WMS data in MAPOG to revolutionize your spatial analysis endeavors today. For any inquiries or support, reach out to us at support@mapog.com.
Other Articles
- Create a Map to find suitable sites for constructing a new house
- Create Map for Analyzing Water Quality using Heat Map Style
- Create Map – School Map Area Coverage Through Buffer Analysis
- Mapping Safety Create GIS Map : Game-Changing Approach to Hospital Risk Analysis
- Create Map for Real Estate Developer for Best Site Selection
- Create Map for Landfill Optimization: Spatial Analysis Approach