Reef mapping stands at the forefront of marine conservation efforts, offering critical insights into the health and distribution of underwater ecosystems. Leveraging advanced GIS technology like MAPOG, researchers are now able to visualize underwater worlds with unprecedented clarity, using variant colors to represent their extent and density.
MAPOG also plays vital role in other sectors like transportation. You can go through this article ‘GIS Analysis in Urban Planning: Reshaping Transportation Future Insights of state/city‘ to know more about.
Key Concept for creating Reef map
Through the innovative use of MAPOG‘s quantity style feature, coral areas are depicted in vibrant gradients, providing a nuanced understanding of their distribution and significance. This approach enables researchers to analyze spatial patterns and identify key factors influencing reef health. The link for GIS data is available at the end of this article.
Instead of map analysis interface, Route compass is another interface od MAPOG. Check this article- ‘Make Routes for Military Aerial Planning- Through Bearing angle and Distance calculation – Online Route Compass‘ for more details.
Steps for creating reef map
Step 1 Upload the data
Navigating to the MAPOG map analysis tool, add the GIS data for our needs.
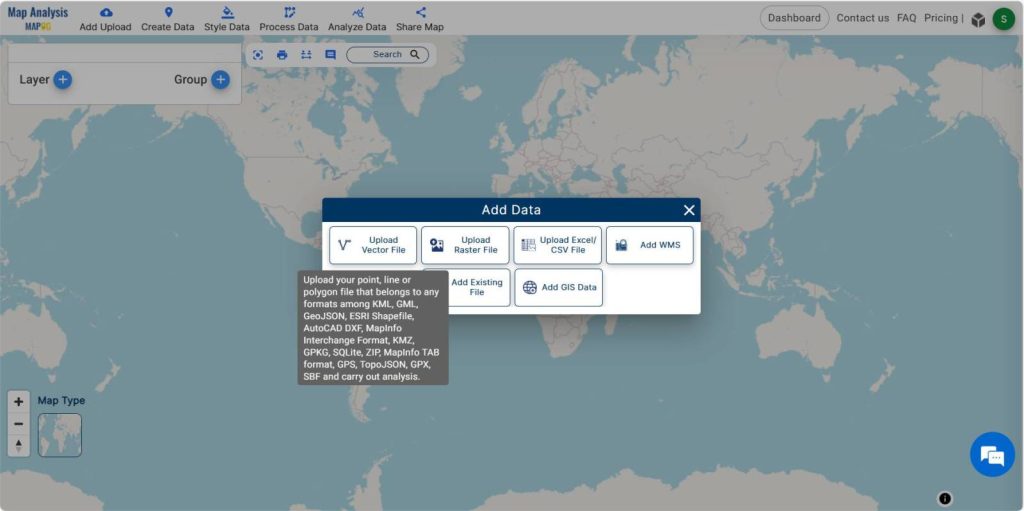
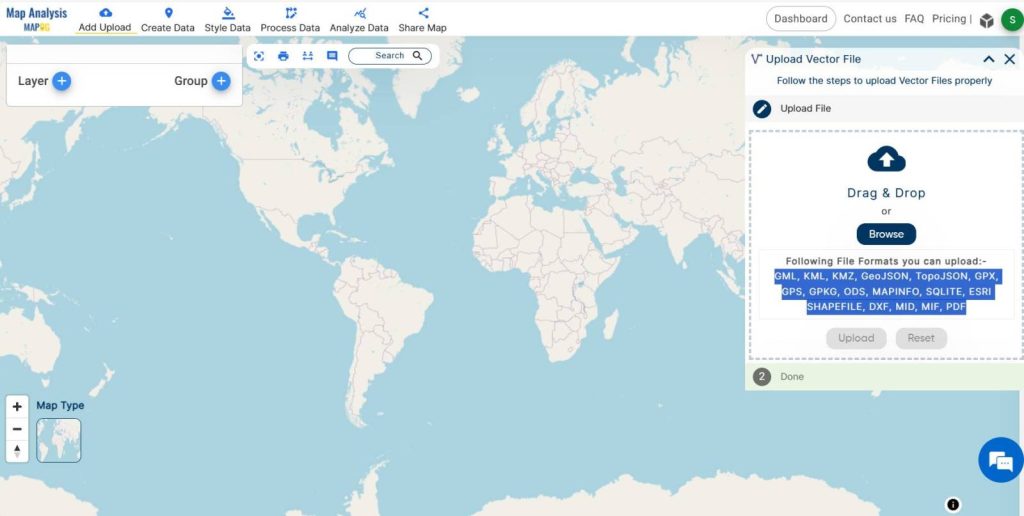
Here, the coral data in KML format is added to this platform. For that move on to Add upload option and select the Upload vector layer option and upload the KML file. Now the data is visible in the layer option.
Step 2 Project Title
We successfully added coral reef data. Now, we need to rename the untitled project and provide a project description in the description box.
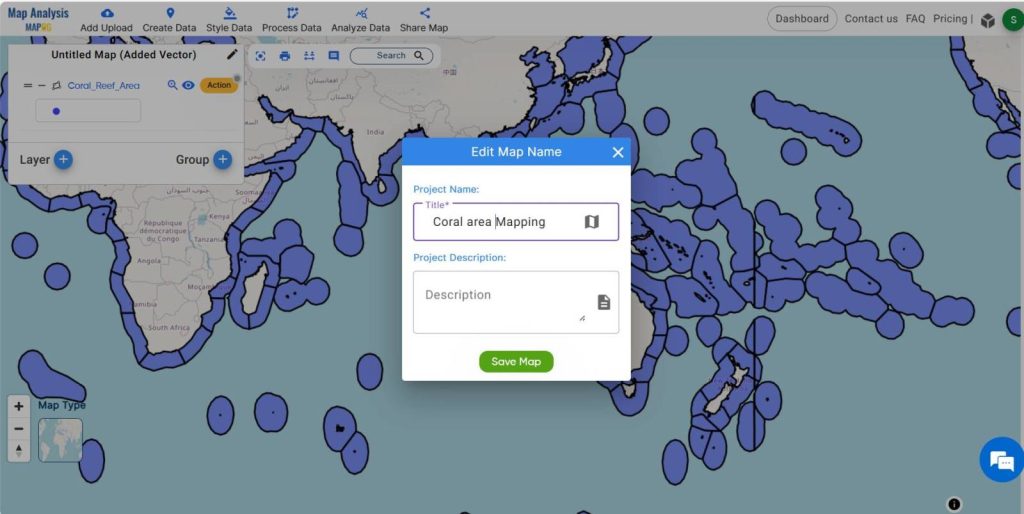
Additionally, we should proceed to the next step by ensuring the project has an appropriate title and detailed description entered in the designated fields.
Step -3 Rename the layers
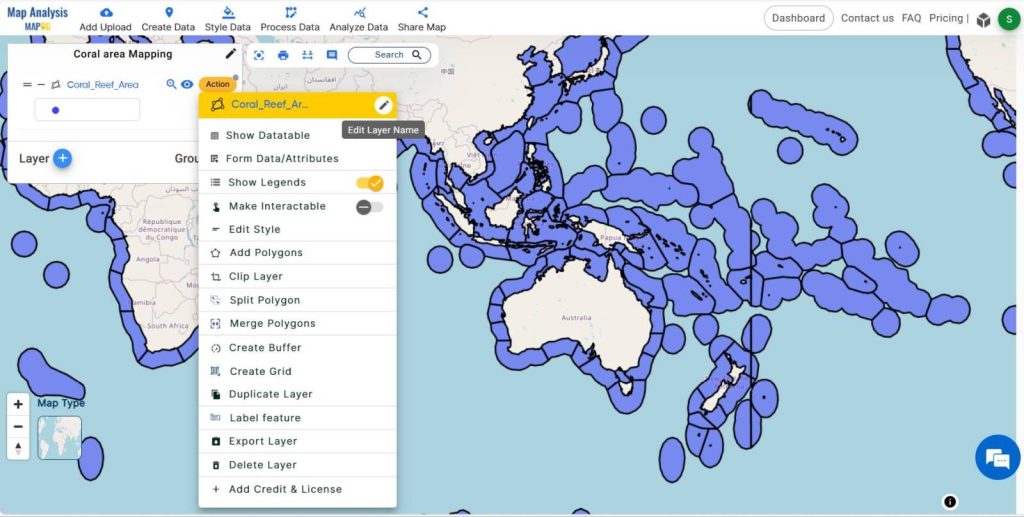
To improve comprehension, select the action button linked to the data layer and proceed to rename the coral reef data layer if necessary.
Step -4 Styling
To visualize the coral data based upon the area, move on to the style data menu, then select the quantity style.
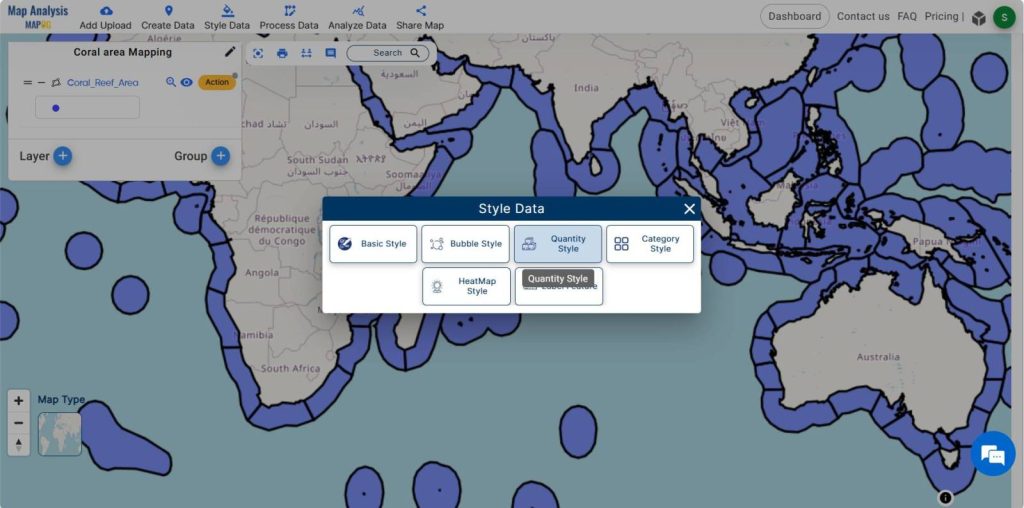
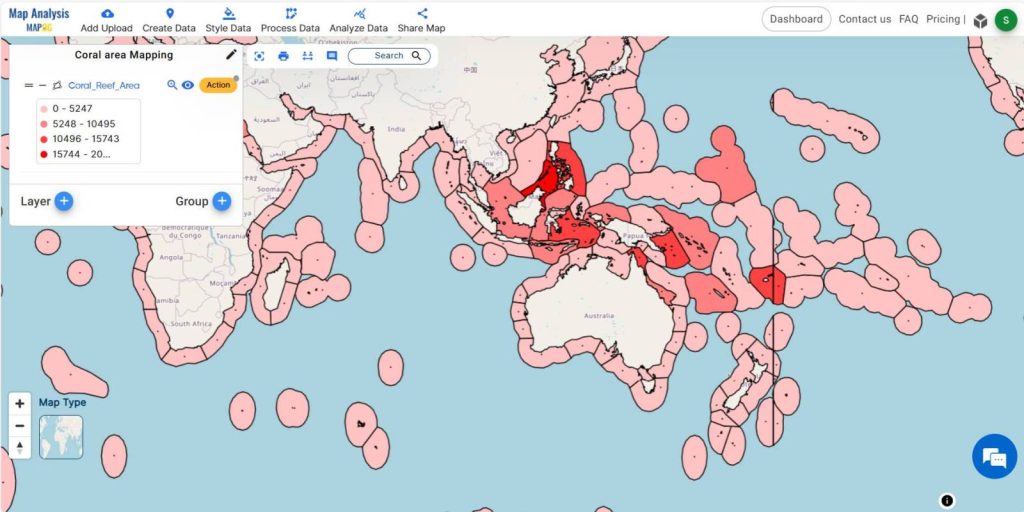
Choose the data layer, then adjust the border color, width, and opacity according to our requirements. Select the attribute (coral area) and configure the color gradients before submitting it.
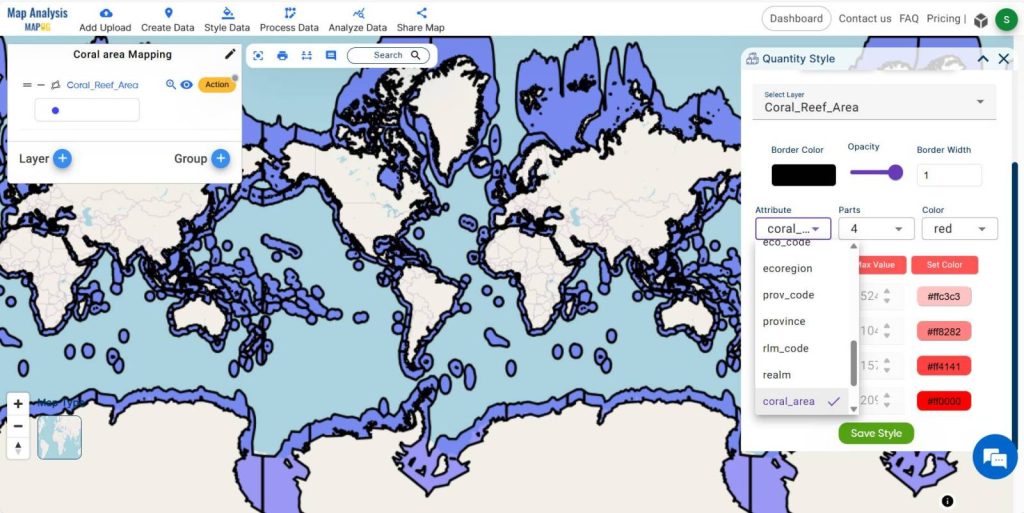
Select the attribute (coral area) and configure the color gradients before submitting it.
Step 6-Share the map
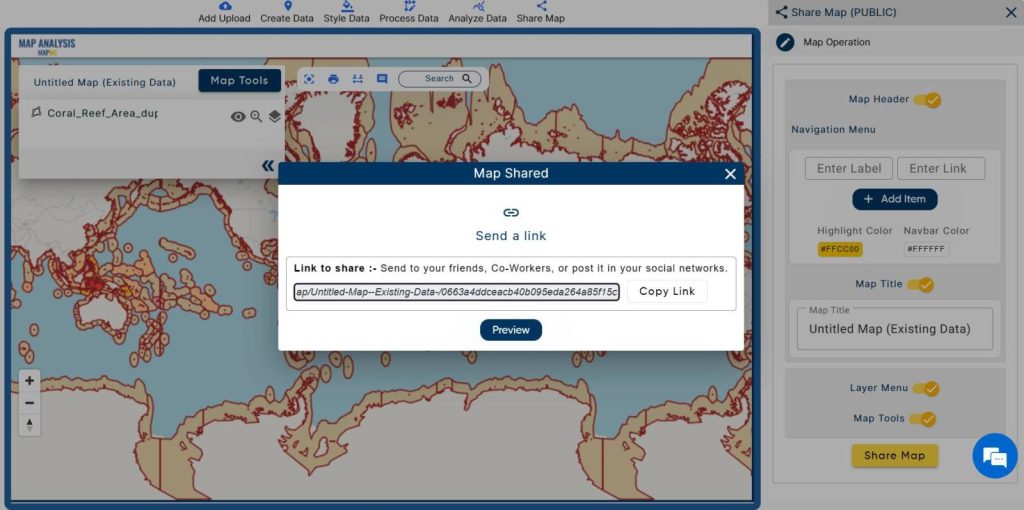
Share this map to the public using the share data menu .
MAJOR FINDINGS
- Precise Identification
- Data Visualization
- Resource Management
- Conservation Planning
- Monitoring and Assessment
DOMAIN AND INDUSTRY
Reef mapping using MAPOG finds application in various domains, particularly in ocean studies and marine conservation efforts. Scientists, policymakers, and stakeholders rely on these insights to inform management strategies and conservation initiatives, ensuring the preservation of fragile marine habitats.
CONCLUSION
MAPOG represents a groundbreaking advancement in marine conservation, allowing researchers to visualize underwater worlds with unprecedented clarity and detail, thereby enabling them to make informed decisions aimed at safeguarding our oceans for future generations, and through continued innovation and collaboration, we can strive towards a sustainable future for our planet’s precious marine ecosystems.
Let’s explore MAPOG Buffer analysis tool through this article-‘Mapping Healthcare Efficiency: GIS Buffer Analysis of Hospital Locations‘.
GIS Data Links-Coral reef data (kml)