Understanding and analyzing sports activities in various areas is crucial for making informed decisions about community health, engagement, and infrastructure investments. Mapping Sports Activity: Using Levels for Analysis, By using the level feature and category style in GIS, we can visualize and categorize sports activities on a map effectively.
Key Concept of Create Sports Maps Activity: Using Levels for Analysis
The level feature helps display data in different layers, giving a clear and organized view of the information. The category style groups data into distinct categories, making it easier to see patterns and trends in sports activities across different areas. Alongside this guide, datasets will be provided for practical application. Additionally, articles like “Creating Travel Guides: Mapping with GIS Buffer Zones” and “Creating GIS Solutions for Urban Agriculture Map” offer deeper insights into GIS applications.
Here’s a step-by-step guide to analyzing sports activities using MAPOG Map Analysis:
Step 1: Load the Sports Activity Data
1.Click on the “GIS Library.”
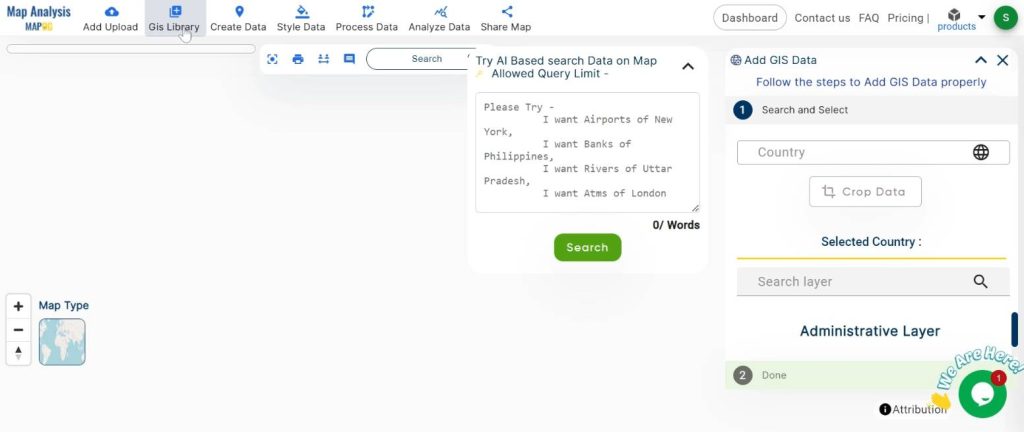
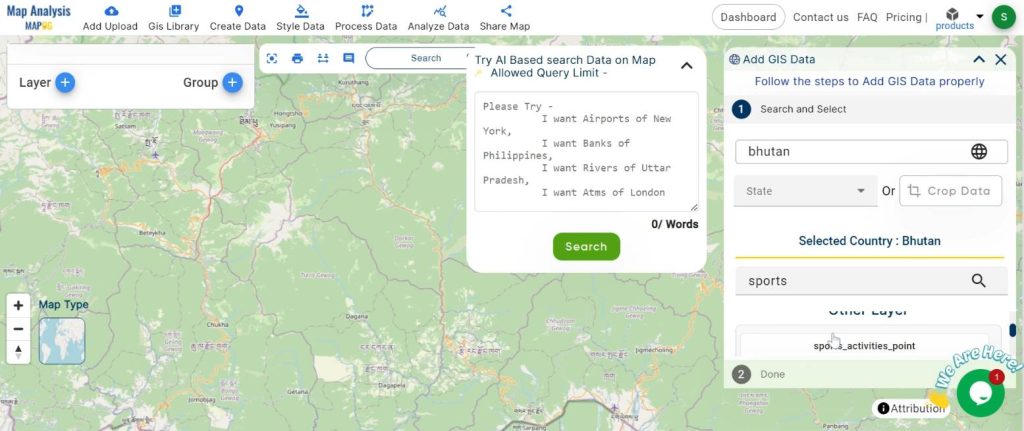
2.Search for the country name.
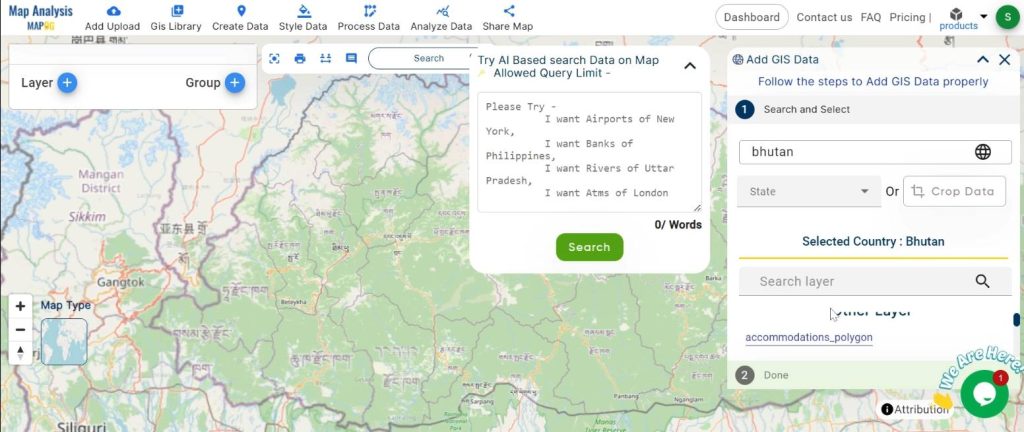
3.Select the required layer.
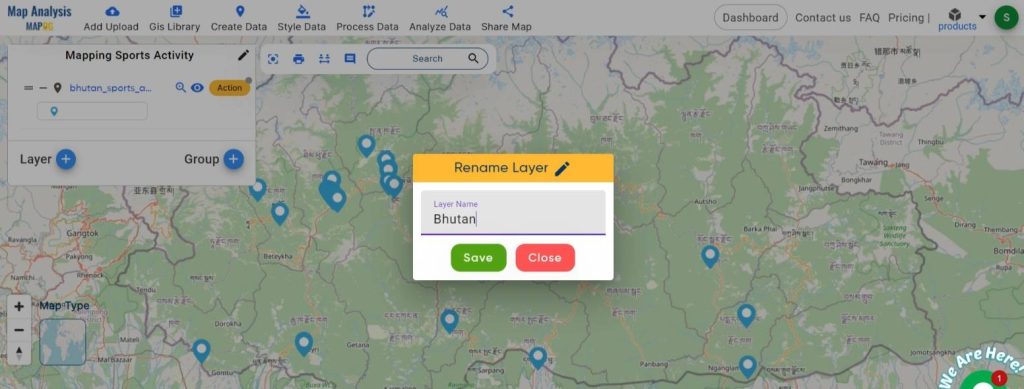
Step 2: Name the Map and Layer
1. Rename the untitled map
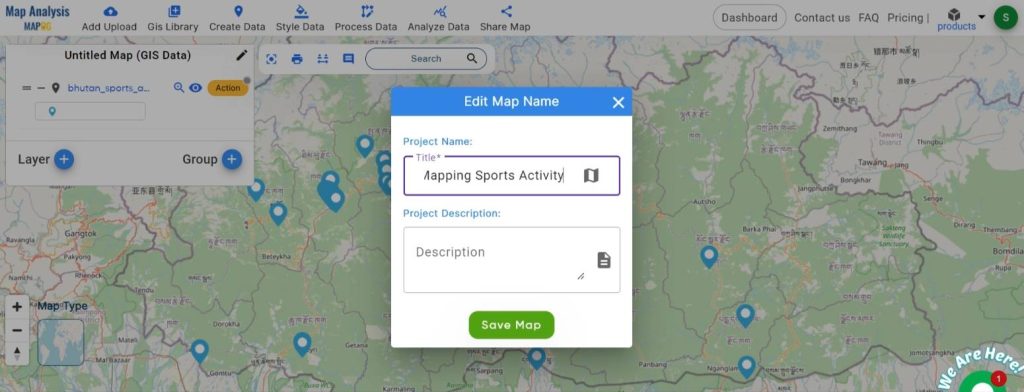
2.Layer to something meaningful.
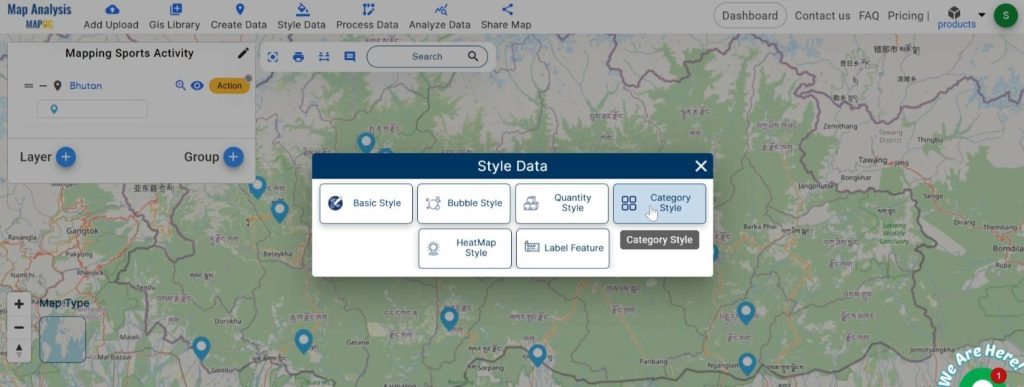
Step 3: Categorize the Activity Levels
1. Click on the “Style Data” button and choose “Category Style.”
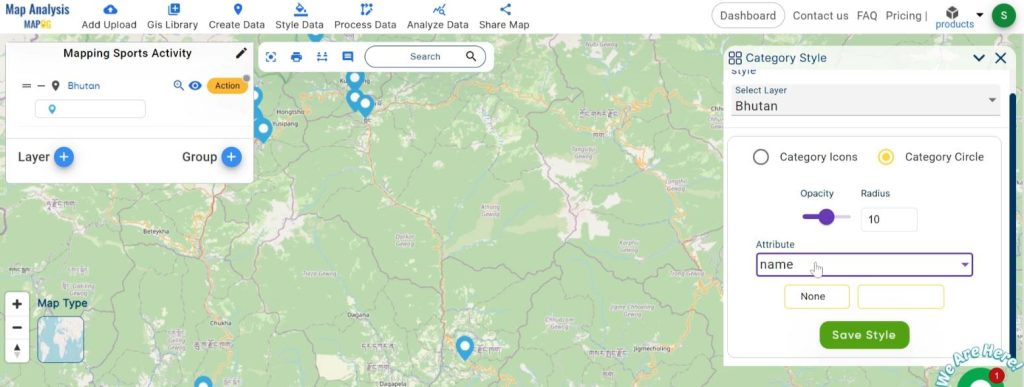
2.Select your layer and set the attribute and color.
Click on the “Save Style” button.
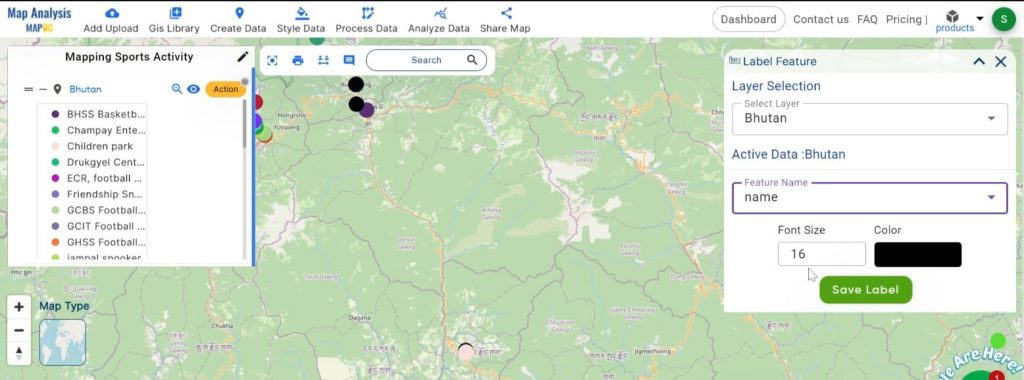
Step 4: Turn on the Level Feature
1.Click on the “Action” button and choose “Level Feature.”
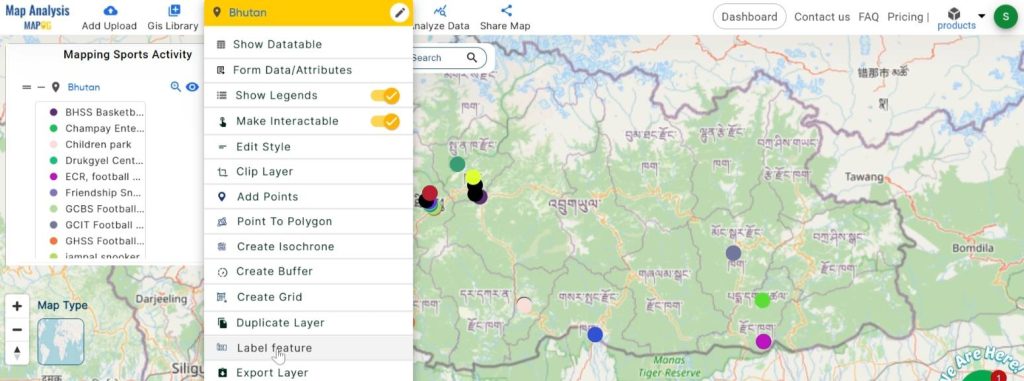
2.Set the feature name, font size, and color.
Click on the “Save Label” option.
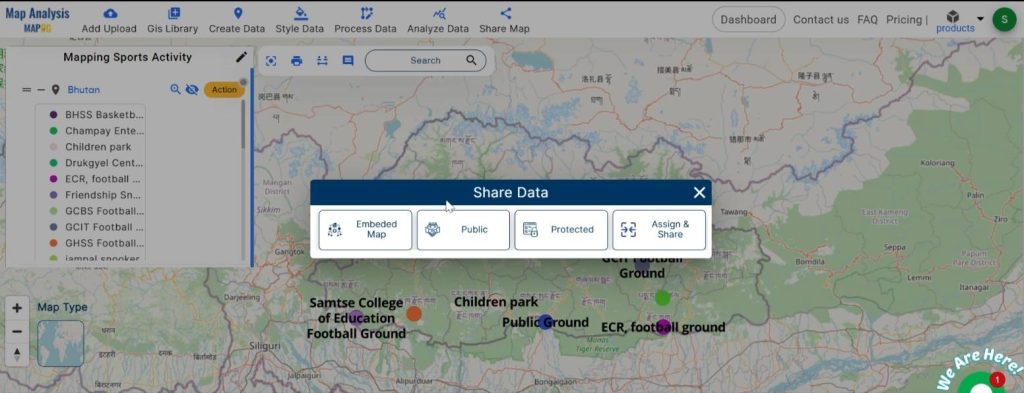
Step 5: Share the Map
Once your map is ready, share it with others to showcase your analysis.
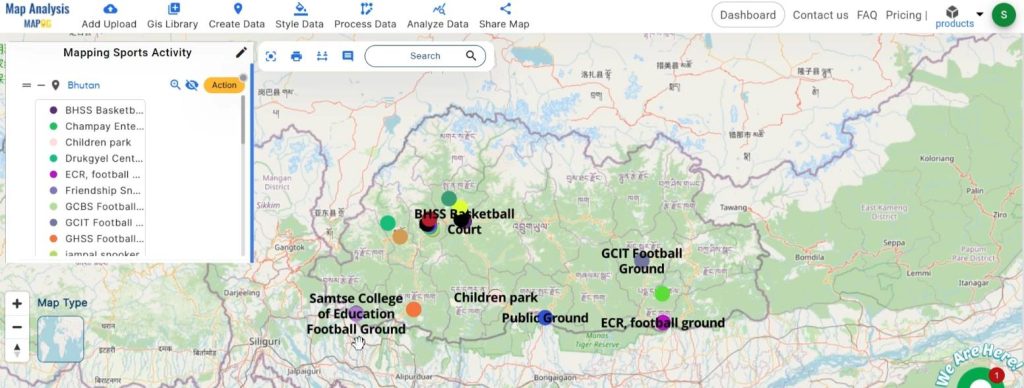
Major Findings
Using this analysis, we can identify three main areas based on their sports activity levels:
- High Activity Levels: These areas are well-utilized and benefit greatly from existing sports facilities.
- Medium Activity Levels: These areas show potential for growth with a bit more investment in sports infrastructure.
- Low Activity Levels: These areas need more facilities or programs to boost participation and engagement.
Domain and Industry Applications
This type of analysis has significant benefits for various domains and industries, including:
- Improved Health: Encouraging physical activity helps improve overall community health.
- Community Engagement: Sports activities bring people together, fostering a sense of community.
- Economic Boost: Investing in sports infrastructure can boost local economies through job creation and increased spending.
- Youth Development: Providing more sports opportunities helps in the positive development of young people.
Using GIS analysis with category styling and the level feature helps us better understand sports activities in different areas. This information is crucial for making informed decisions about where to invest in sports infrastructure to maximize community benefits. By identifying areas that need more facilities or programs, we can ensure that everyone has the opportunity to engage in sports and enjoy its many benefits.
Link of the Data:
Explore the data further through our GIS Data product, uncovering valuable information for in-depth analysis and understanding.