MAPOG uses geospatial intelligence to analyze Residential Land Use in Natural Reserves, enabling decision-makers to balance conservation and community needs. It helps identify sustainable development opportunities and informs regulatory frameworks, promoting responsible land management.
Key Concepts to Identify Residential Land Use in Natural Reserves!
The project’s output map visualizes residential land use in natural reserves, revealing that many areas are causing disturbances to wildlife habitats and flora, indicating a substandard level of land use in these areas. The links for GIS DATA which we’re using here are mentioned at the end of the article. Begin your journey by uncovering the secrets of “Protecting Wetlands: Guide to Create GIS Map for Nature” where GIS emerges as a stalwart defender of fragile wetland ecosystems.
Steps for Identifying residential land use in natural reserves
Step 1: Add GIS Data
First, navigate to the Map Analysis interface. Click on the Add upload button from header. A dialogue box will open. Click on Add GIS Data to add data.
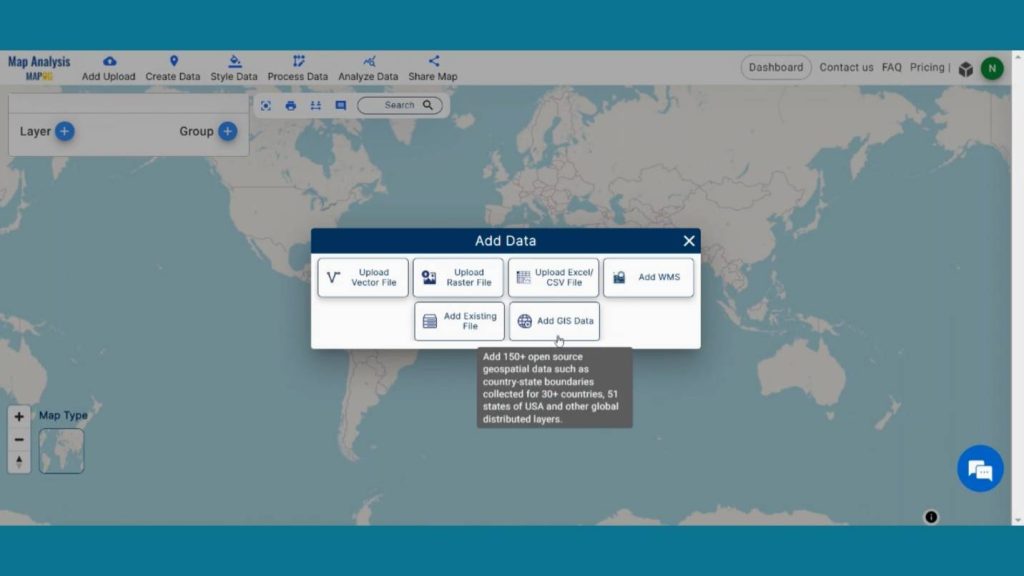
Dialogue box will appear on the right side of the screen. Look up the desired nation. Next, add the data to the map canvas and search for Protected Area Polygon in the search layer option.
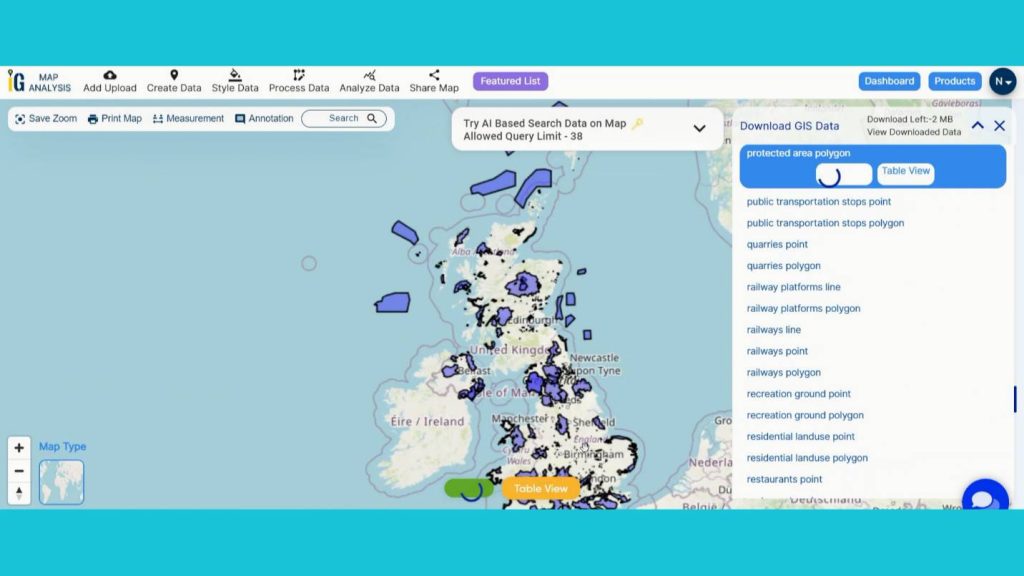
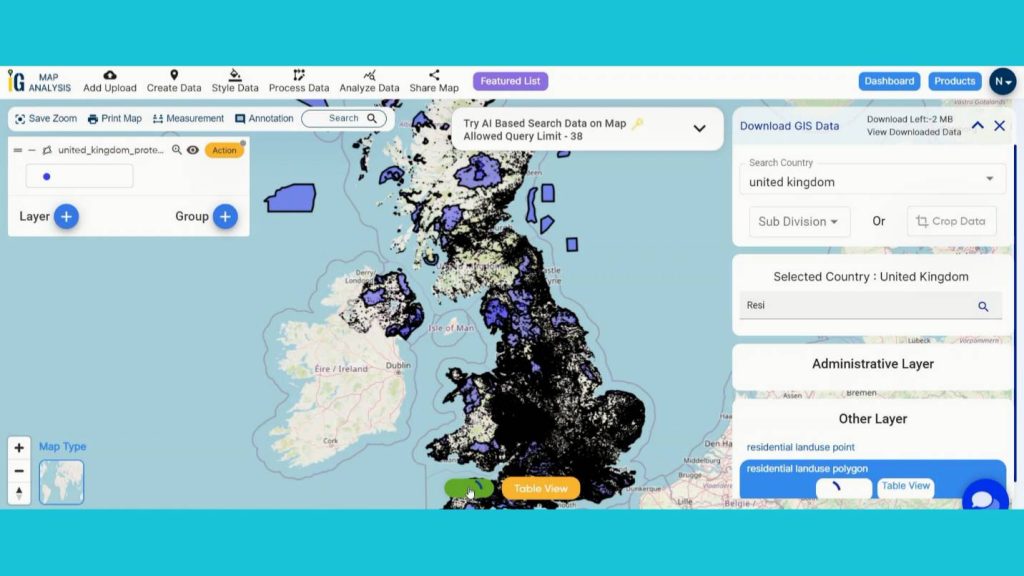
After adding the Protected Area Polygon comes the crucial step. Search for the Residential Land Use Polygon and add the data as we are showing the Residential areas covering the protected and natural reserve area.
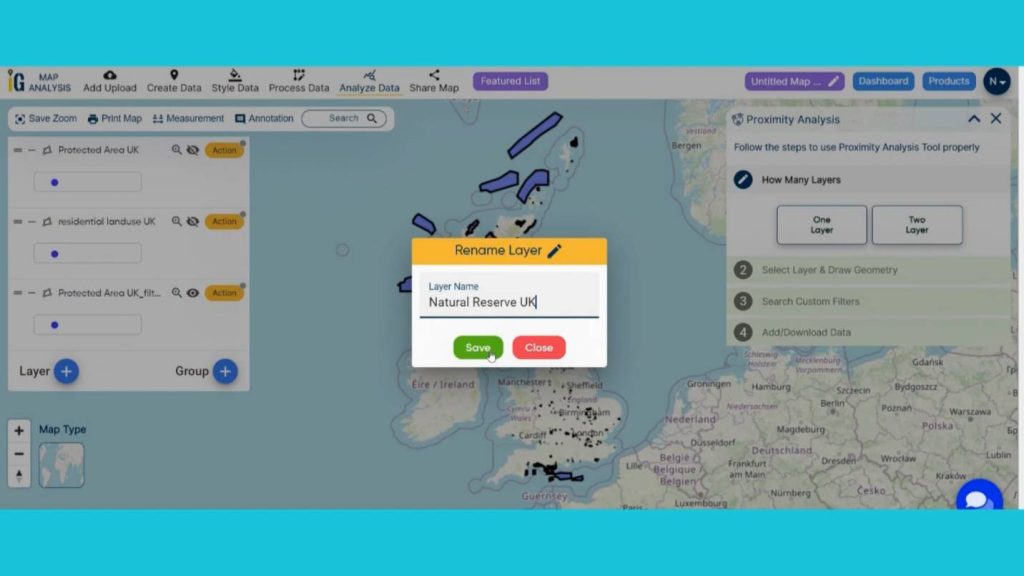
Step 2: Rename Layers
Now click the Action Button of the protected area layer and click on that pencil icon and rename that layer as Protected area and save it.
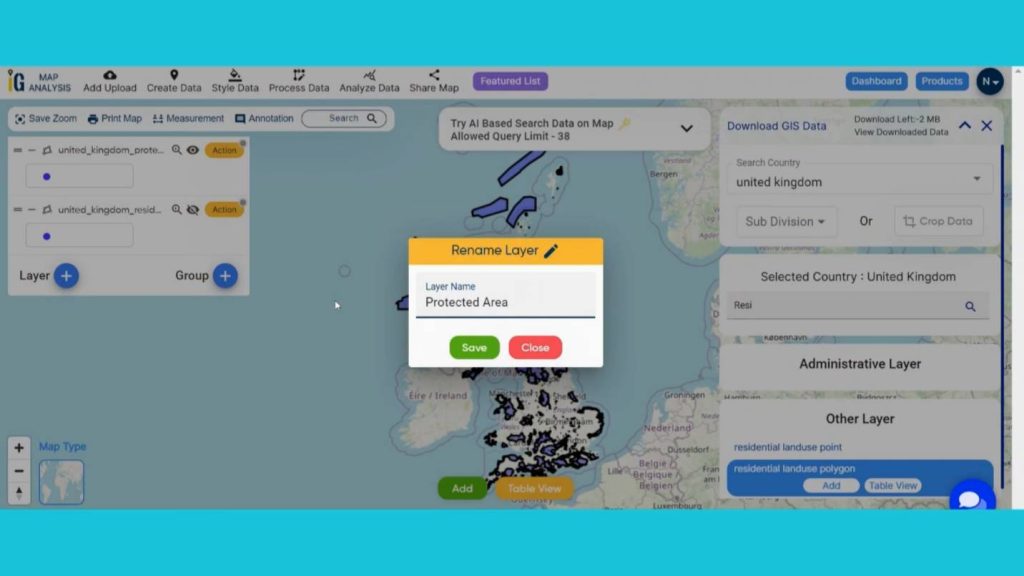
Rename the Residential Land use layer as Residential Land use by going through the same process for understanding purposes.

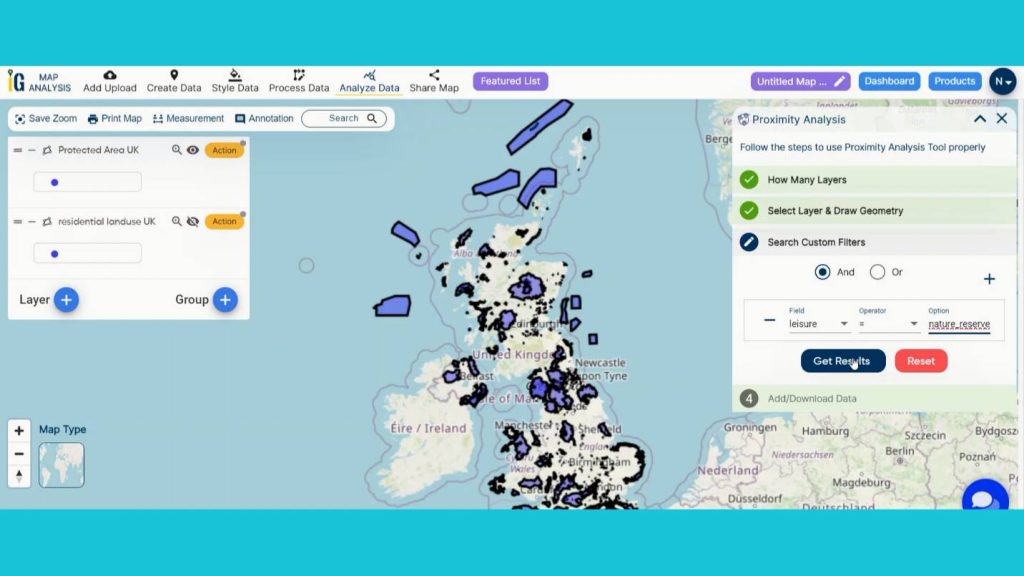
Step 3: Using Proximity Analysis
After adding all of the base data, use the Analyze Data Option to separate protected areas from Natural Reserve areas. Go to the “Analyze Data” menu. Click on the Protected Area Polygon layer after selecting a layer. Proceed by choosing “And,” “leisure” from the field drop-down menu, “nature_reserve” in the option, leaving the operator at “=,” and “Get results.” In the end, press the “Publish” button.
Then you can see all the natural reserves have been added. Rename the new layer as Natural Reserves.
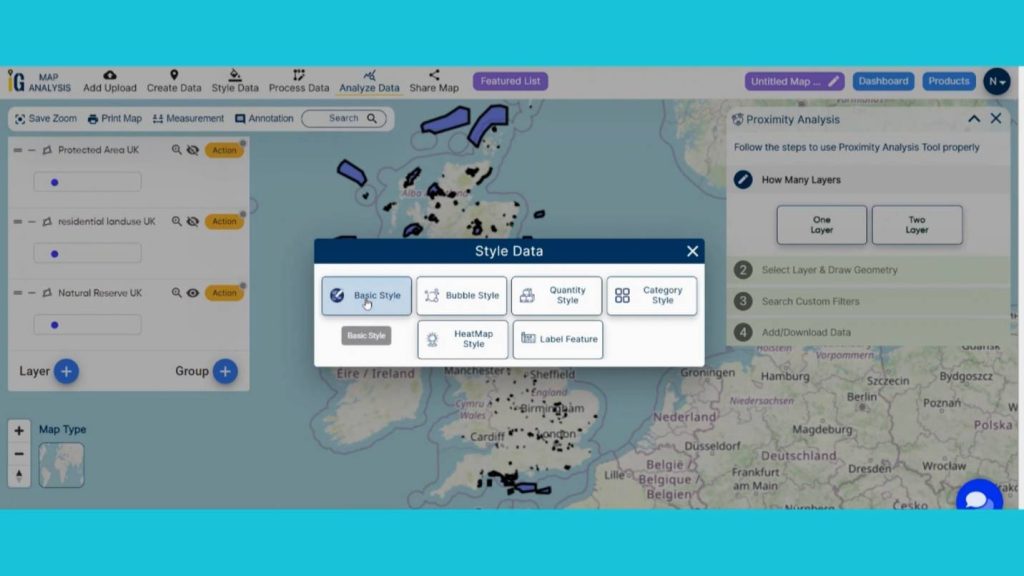
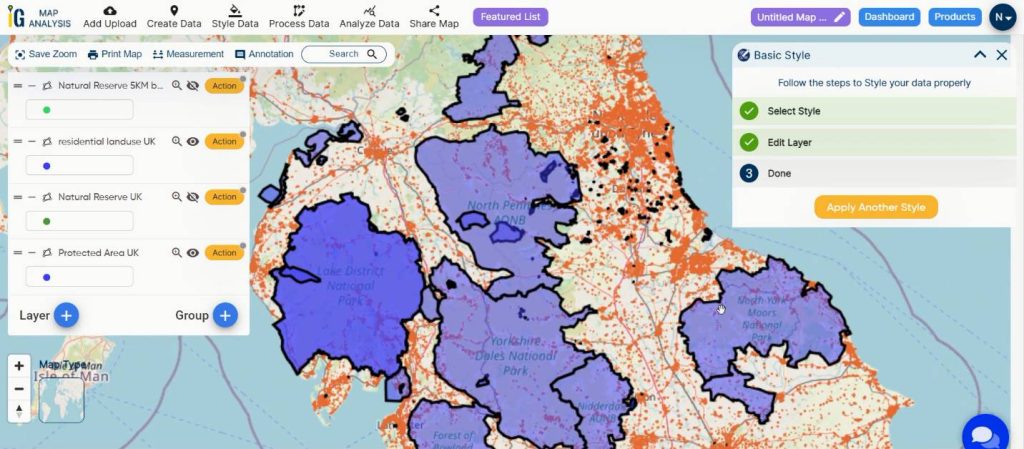
Step 4: Add Thematic Styling
Now Add thematic styling to differentiate between Natural Reserves. Go to the style data option from the header section and select the Basic style option from dialogue box.
Unlock precise spatial insights with “Grid Mapping for Accurate Spatial Analysis: Divide and Conquer with GRID Map Tool“. Benefit from enhanced data organization, targeted analysis, and streamlined resource management.
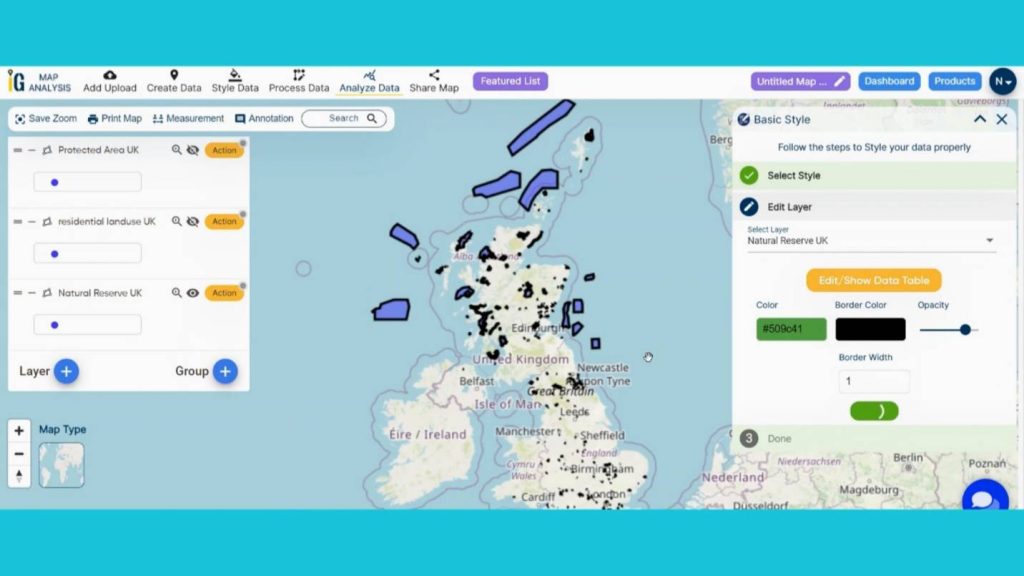
select the Natural Reserves from edit Layer section and provide green color to it and save the style.
Step 5: Create Buffer Zone
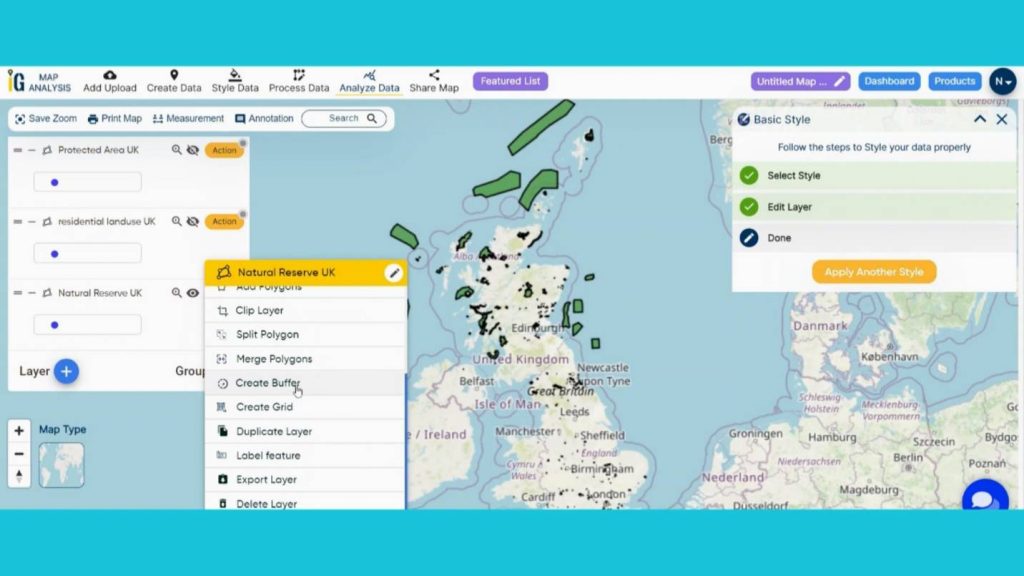
Now we’re going to perform a buffer analysis for a 5 km radius around the Natural reserve layer. First go to the Natural reserve layer and click on action. In the drop-down menu, click the Create Buffer option.
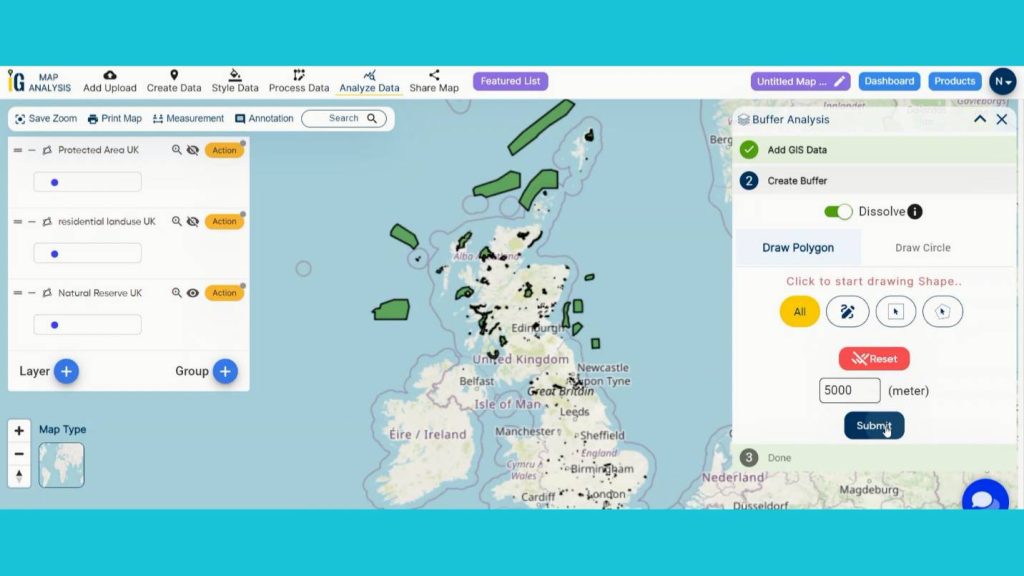
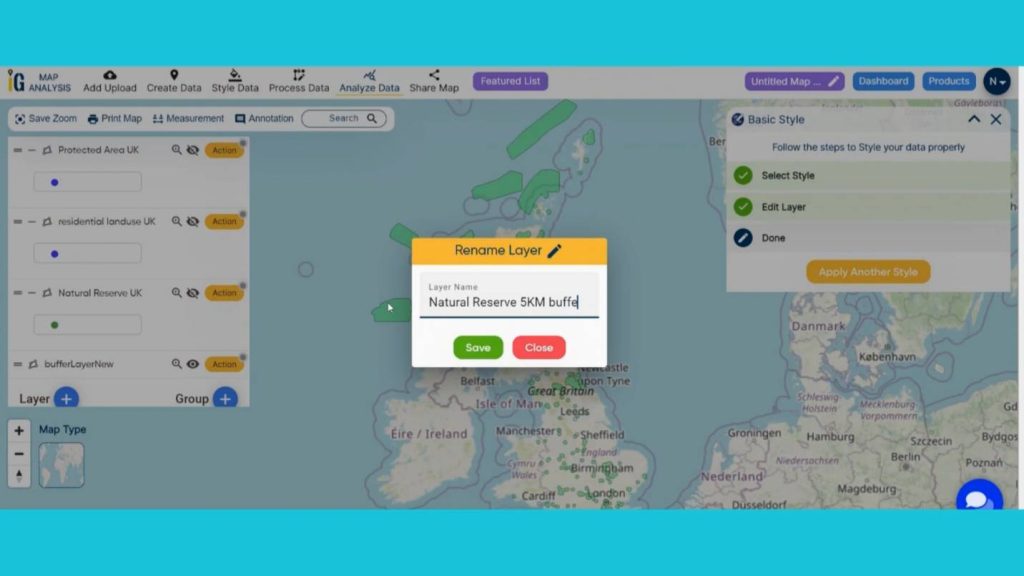
A dialogue box will open on the ride side of the canvas. Select all points, turn on the dissolve option to merge the overlapping buffers. Next, set the buffer range to 5 km in the buffer range section. Click on submit. Rename the layer as Natural Reserve 5 KM Buffer.
Step 5: Add Basic Style in Layers
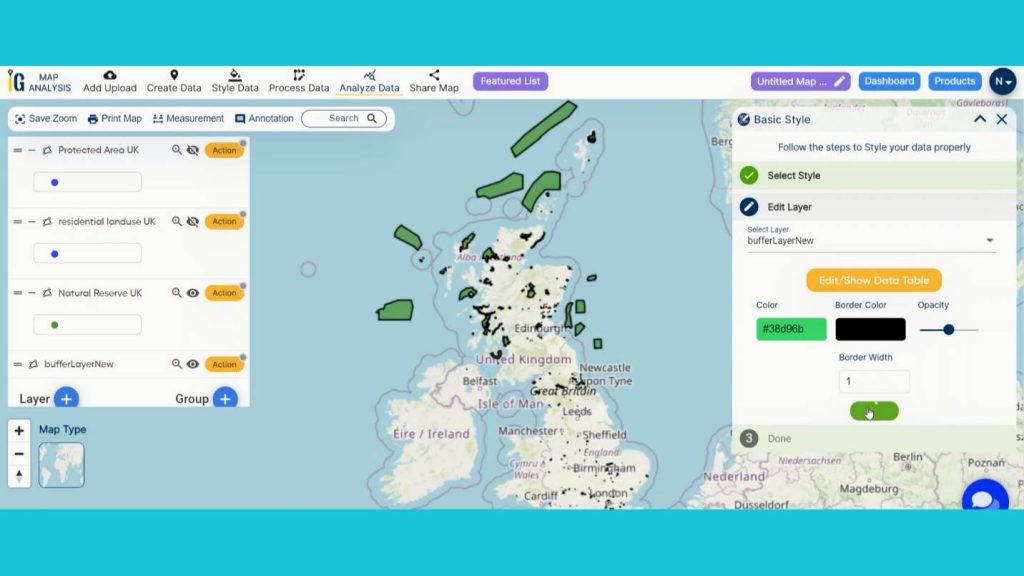
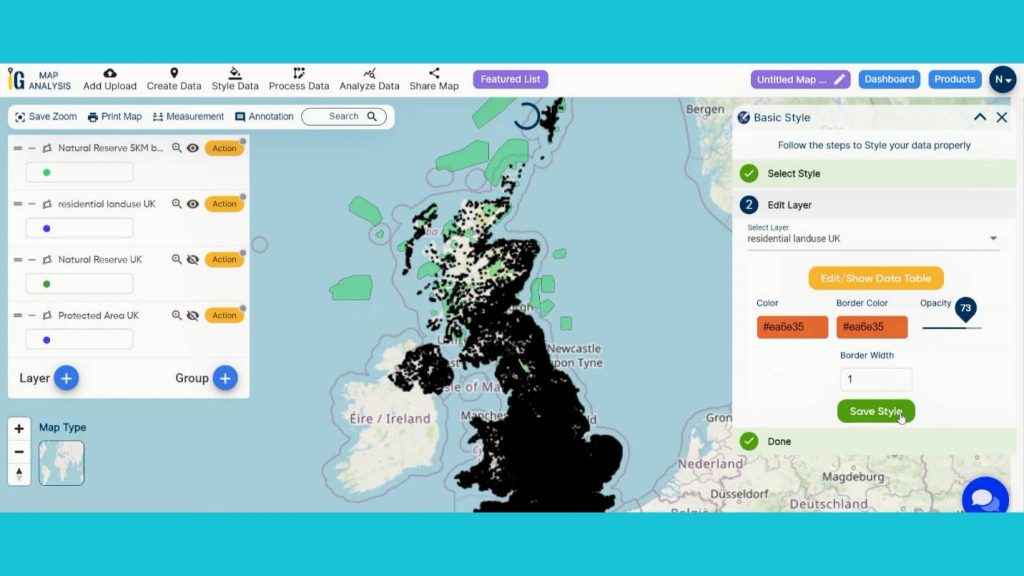
Now, let’s add thematic styling to differentiate & enhance the visualization of Residential Land use in Natural Reserve. To style the data go to the style data option and select the basic style option to visually interpret the data. Select the Natural Reserve 5 KM Buffer layer in the edit layer option.
Next, Rename that newly created buffer layer.
Next, select the basic style option and the layer to be published as Residential land use layer. Select a suitable color and save style. This will help us visualize the potential areas of influence.
Step 6: Results & Analysis
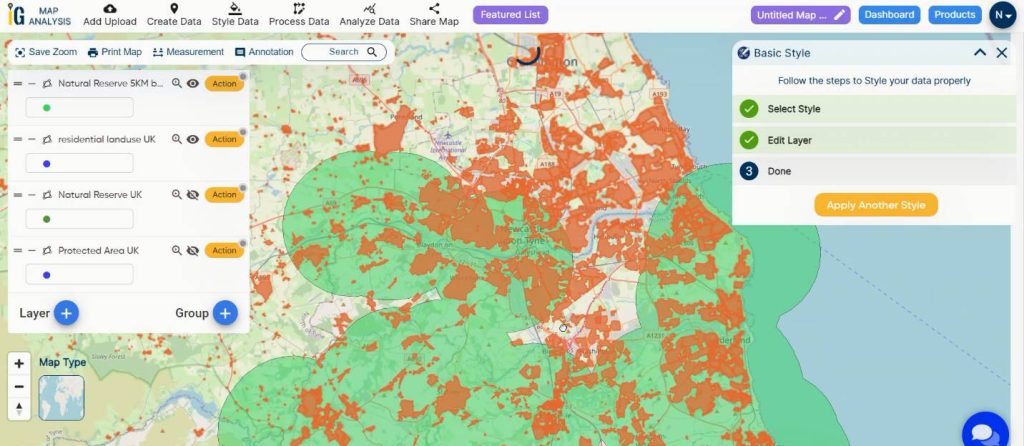
The green areas indicate the 5km buffer zone around the natural Reserve of and orange area signifies the Residential land use. Here we can see a large number of areas overlapping each other. The overlapping nature indicates that those areas are most probably getting converted as a residential land area.
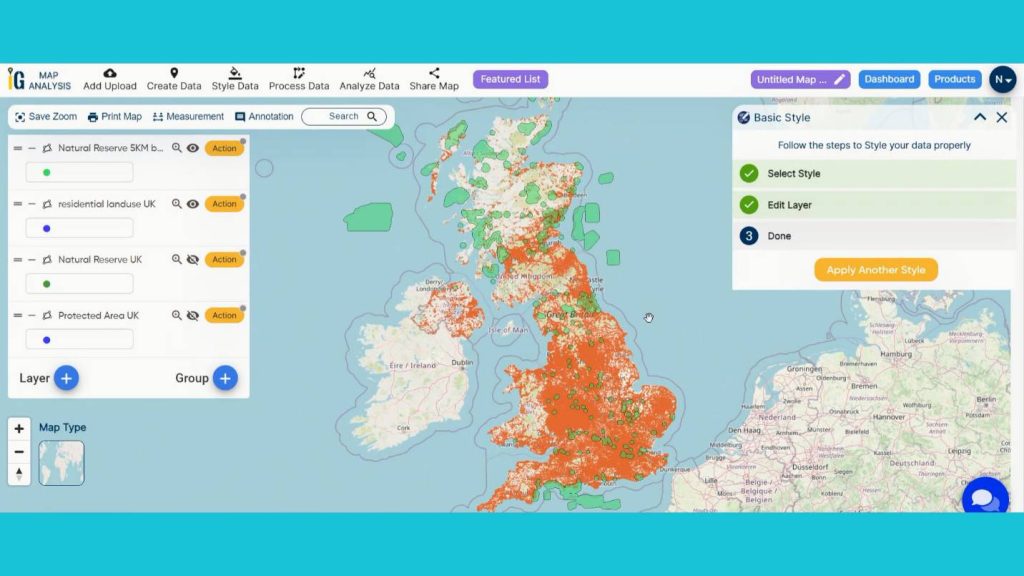
Now, Analyze the map.
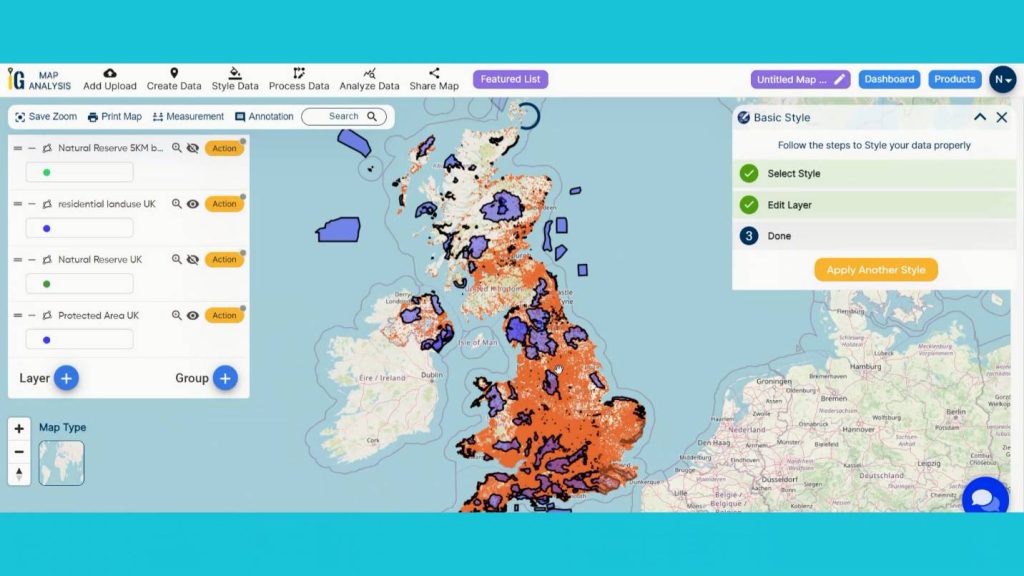
A protected area is a clearly defined geographical space, recognized, dedicated and managed, through legal or other effective means, to achieve the long-term conservation of nature with associated ecosystem services and cultural values (International Union for conservation and nature). The blue areas in the map are protected areas and it’s shown that a huge number of plots are getting used for residential purpose.
This comprehensive map is a powerful tool for This map is a powerful tool for identifying residential land use in natural reserves include, guides policy enforcement, conservation efforts, and sustainable land management, ensuring the responsible use of natural reserves and upholding environmental and legal standards and more. Export it for impactful use. The thematic nature of this map is clearly providing the insightful details of the Forest Fire in those areas.
Major Findings
Spatial Distribution of Unauthorized Structures: Identify the locations and patterns of illegal residential developments within natural reserves using GIS mapping and satellite imagery.
Land Cover and Vegetation Changes: Analyze changes in land cover and vegetation associated with illegal development, indicating potential environmental impact.
Building and Construction Materials: Examine the types of materials used in unauthorized structures to differentiate them from legally permitted constructions.
Domain and Industry
This comprehensive map, a valuable asset for Environmental Agencies, Conservation Authorities, Planning and Zoning Departments, and Legal Enforcement Agencies and beyond. Immerse yourself in the dynamic landscapes of urban planning through “GIS Analysis in Urban Planning: Reshaping Transportation Future Insights of state/city” discovering the transformative role of GIS in optimizing transportation for a sustainable and interconnected future.
Conclusion
Identifying residential land use in natural reserves shows that many residential areas are interfering with the life of wildlife habitats and the flora, fauna existing in the natural reserve zone buffer and the natural reserve zone too which is definitely Substandard. This article serves as a testament to the value of MAPOG’s GIS buffer Analysis, proximity analysis of natural reserves in spatial research and planning, offering a practical and clear path to unlocking geographic insights.
LINKS FOR THE DATA 👍
Here are some other blogs you might be interested in
- Fast Emergency Response: Using GIS and Isochrone Maps for 10-Minute Ambulance Arrival
- Mapping Tiger Attack Hotspots – Create an Online Map and Share
- Make Routes for Military Aerial Planning- Through Bearing angle and Distance calculation – Online Route Compass
- Mapping Healthcare Efficiency: GIS Buffer Analysis of Hospital Locations
- Add WMS- Two step online view of WMS layer on a map
- Plot ATM locations on a map and embed on your website
- Map habitat locations of endangered animals & keep track of their living
1 thought on “Creating an Online Interactive Map for Residential Land Use and Buffer Analysis with Thematic Visualization”