In the realm of Geographic Information Systems, Excel spreadsheets serve as a common source of data due to their versatility and ease of use. Integrating Excel data into MAPOG can enhance spatial analysis and decision-making processes. This article will walk you through the process of importing Excel data into MAPOG, enabling you to harness the power of geospatial analysis for your projects.
Key Concept–Import Excel Data into MAPOG
By employing the upload Excel tool, we can seamlessly import Excel data into MAPOG, with special emphasis on integrating major city data. By compiling data such as city names, country name, geographic coordinates, and population figures into Excel spreadsheets, analysts, planners, and policymakers can gain a comprehensive understanding of urban landscapes and their complexities. This data serves as a foundation for urban planning, infrastructure development, market analysis, and policy formulation, enabling stakeholders to make informed decisions to address challenges and capitalise on opportunities within major cities. Unlock the full potential of Excel data analysis by exploring additional articles tailored to various applications on this blog including Plotting Airports on MAP: Simplifying Logistics and Planning, Analysis of Forest Fire and Map Risk Areas with Buffer Tool etc.
Follow the below process Step-by-step to import excel data into MAPOG
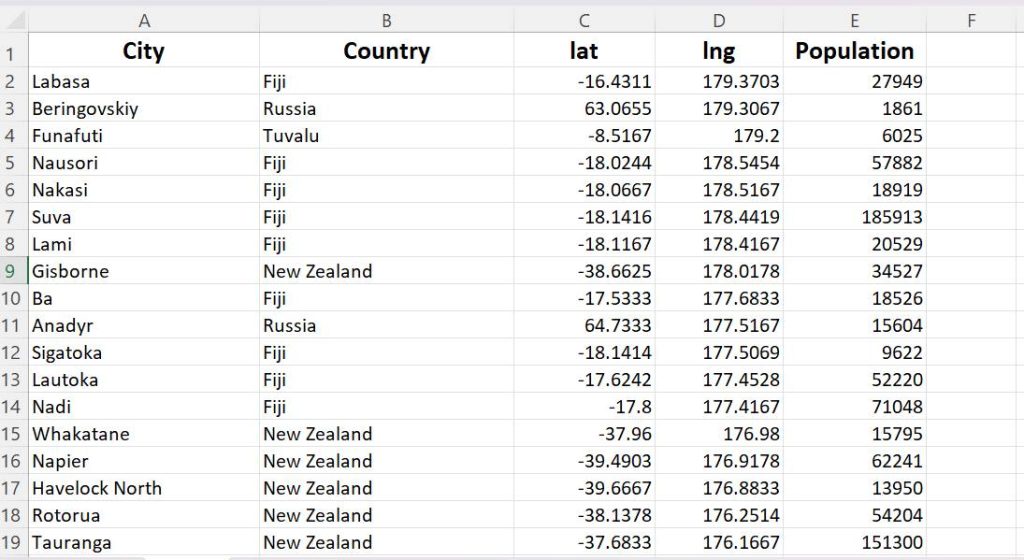
Step 1: Organise your Excel Data
Before importing your Excel data into MAPOG, ensure that your spreadsheet is well-organised and properly formatted. The Excel file should contain a clear structure with headers for each column. Additionally, ensure that your data includes location information, such as addresses, coordinates, or geographic identifiers, which will be used to spatially reference the data in MAPOG. And also make sure that your file is saved in one of the supported formats, including CSV, XLSX, XLS, or ODS.
Step 2: Open Map Analysis
Navigate to Map analysis interface from MAPOG platform.
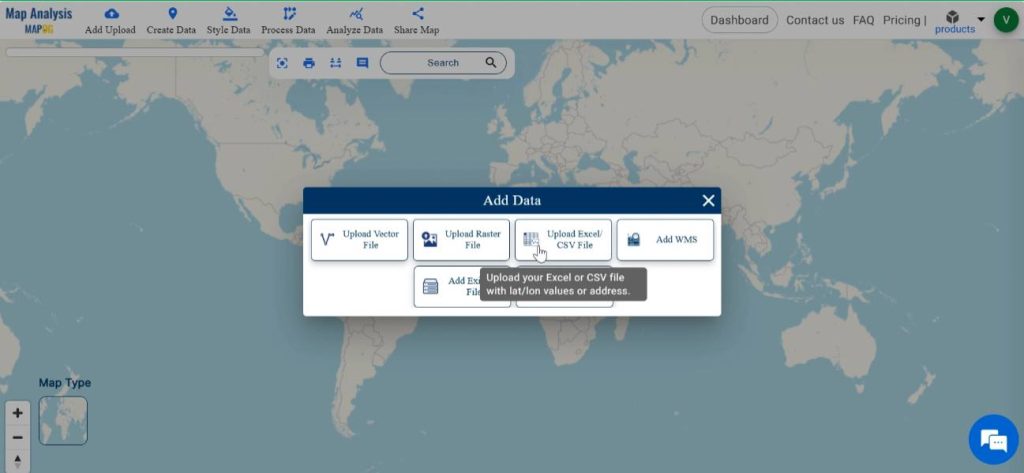
Step 3: Access the Import Tool
Click on the Add Upload option from the menu bar at the upper left end, and then go to the Upload Excel/CSV file option.
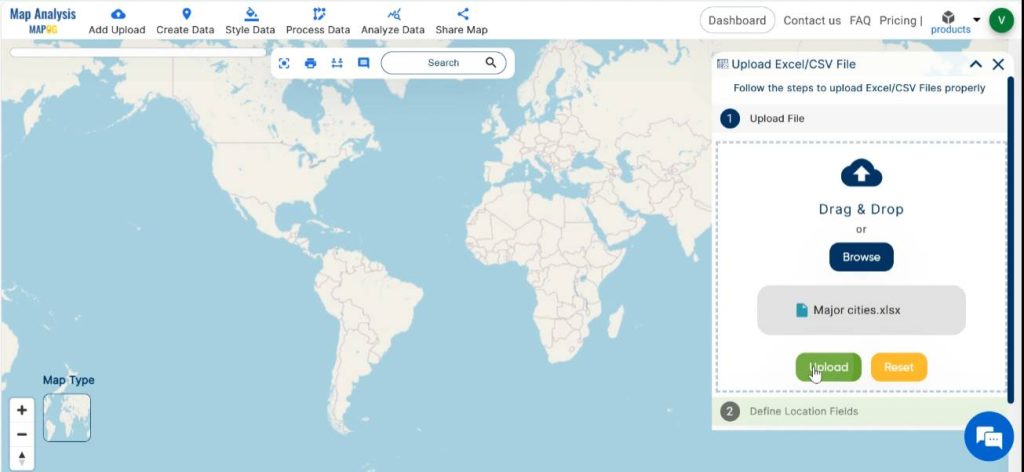
Step 4: Select Excel File
In the dialogue box opened, click on browse. Navigate to and select the Excel file you want to import. Then, click on upload.
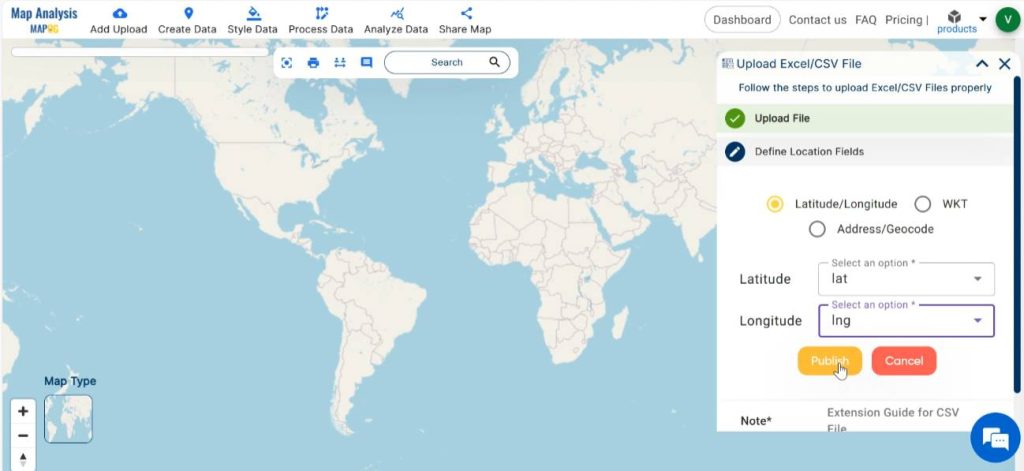
Step 5: Define Data Fields
Based on the type of location information present in the file, choose the suitable format provided in the “Define Location” field. This could include latitude-longitude coordinates, Well-Known Text (WKT) representations, or addresses.
Match the columns in your Excel spreadsheet to the corresponding location fields. This step ensures that the data is imported accurately and matches the intended attributes. Then proceed to publish.
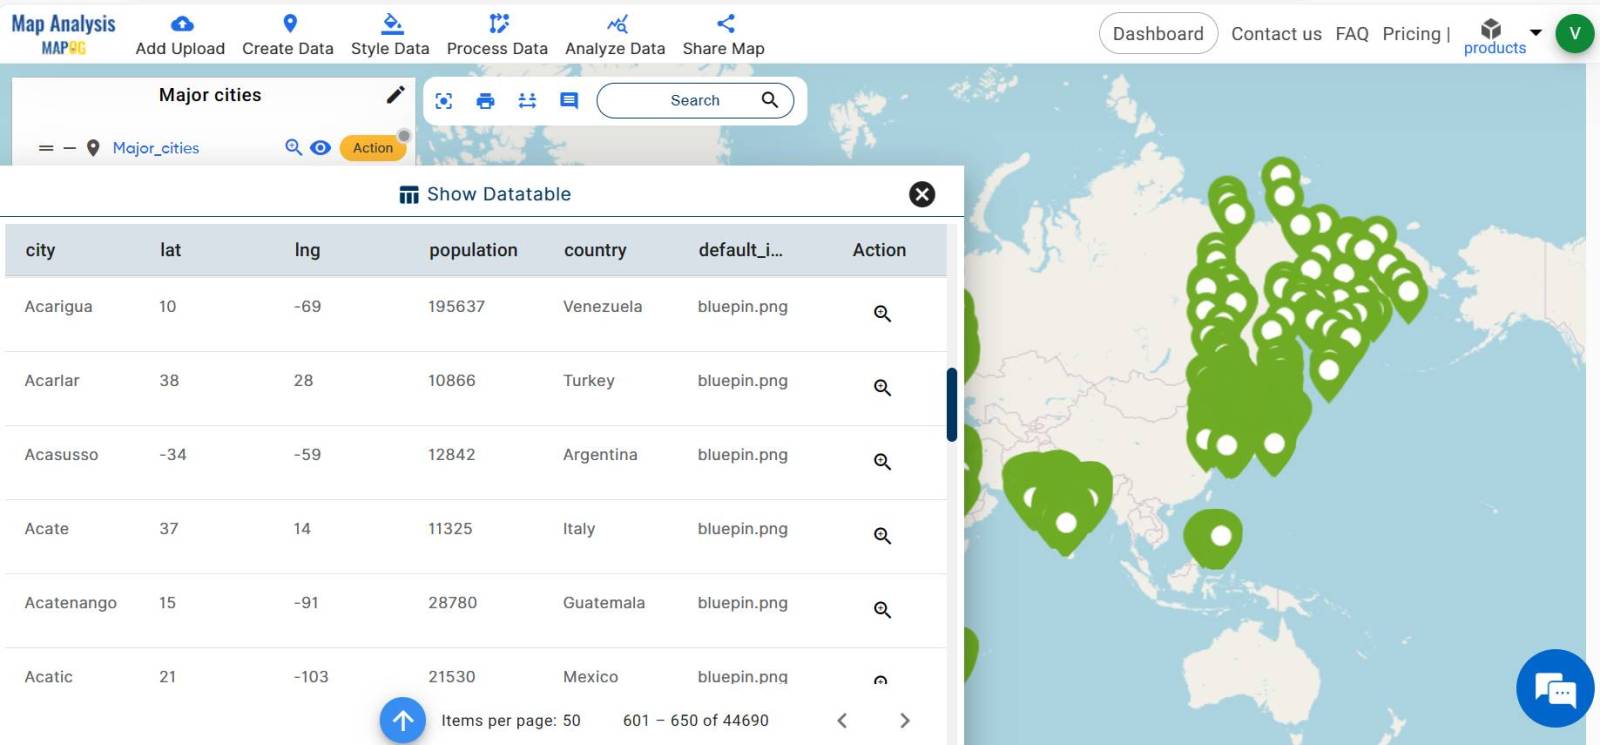
Step 6: Review Imported Data
After importing the Excel data, review the data table of the imported dataset. For this, click on action and select Show Datatable option. Verify the attributes in the data table to ensure the quality of the imported data for further analysis.
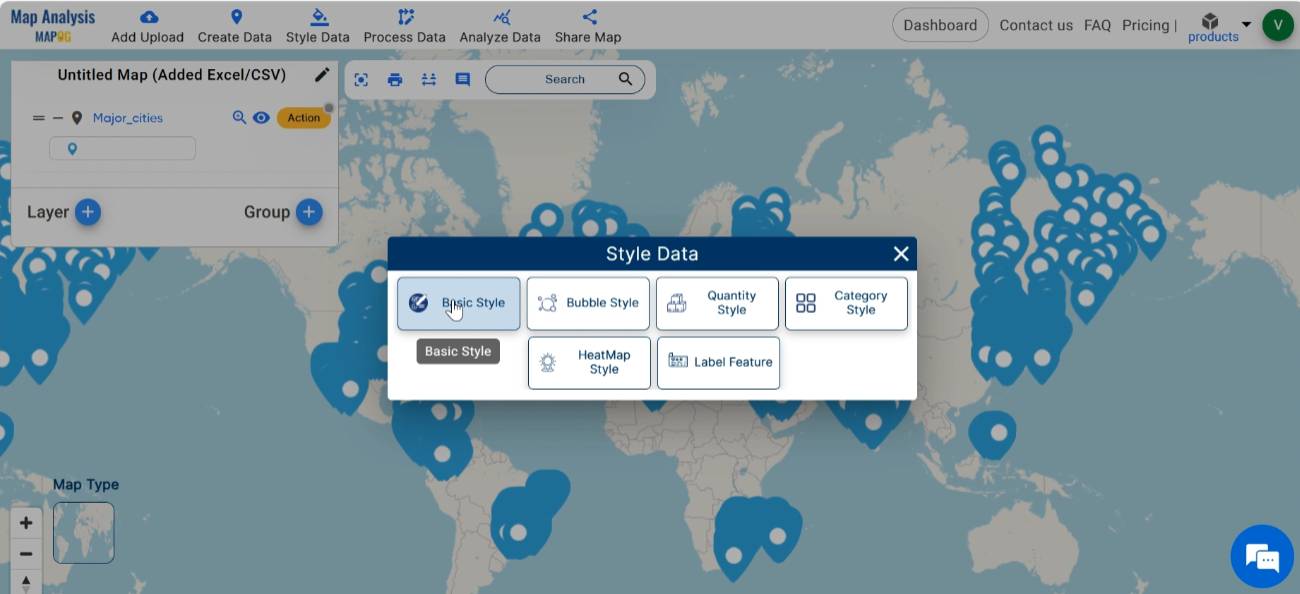
Step 7: Style the Map
Enhance the visual appearance of the map by styling the layers with suitable colours. In order to do this, click on Style Data and select Basic Style.
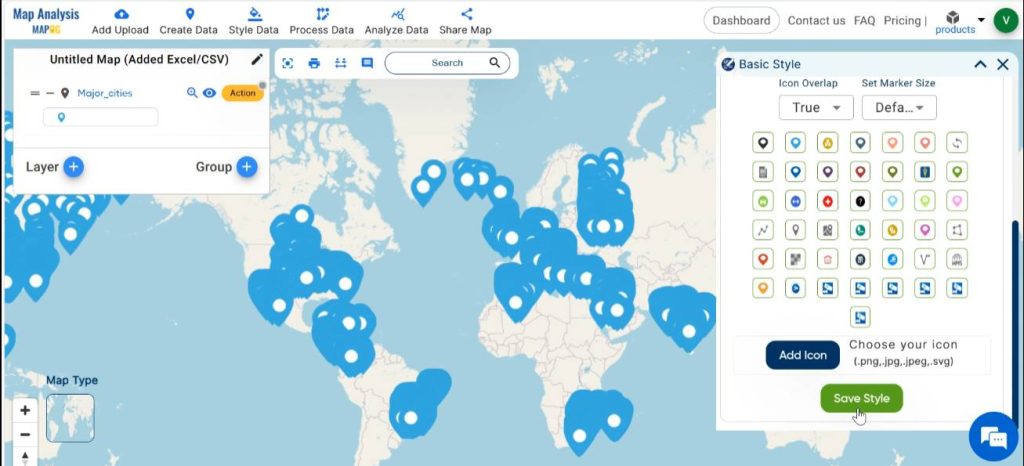
Select the layer to be styled, then choose the suitable colour gradient for the layer from the available colour palette. Save your changes by clicking on Save Style.
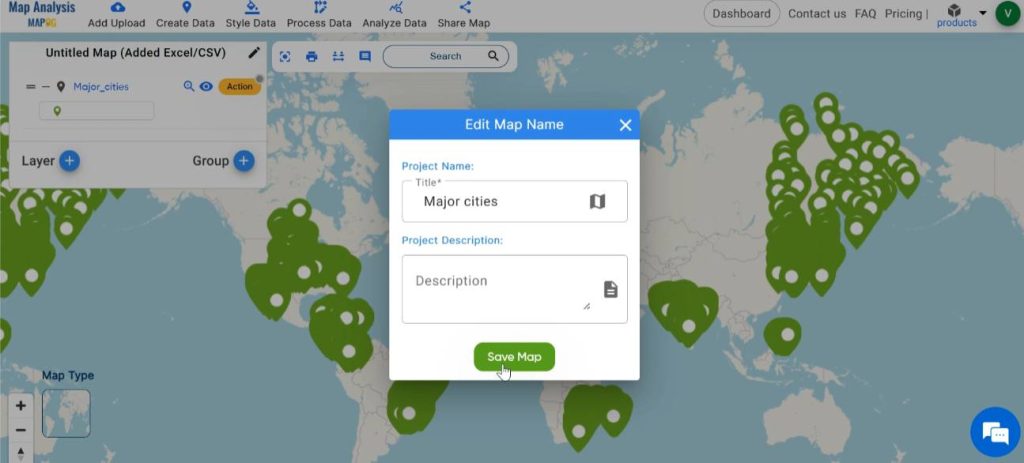
Step 8: Save the Map
Once you’re satisfied with the imported data, save your project. For this, click on the pencil icon near the “Untitled Map” text. Enter a suitable name, and if desired, provide a brief description of your project. Finally, save the map by clicking on the “Save Map” button.
Finally, we have successfully imported excel data into MAPOG.

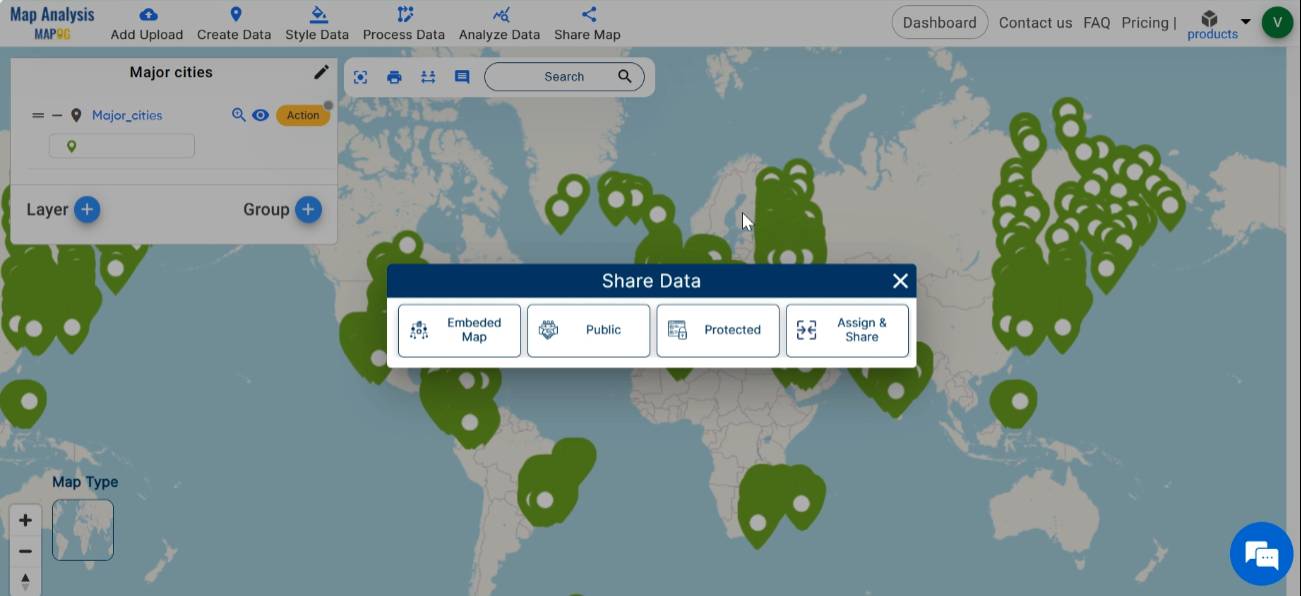
Step 9: Share the Map
Using the share tool, effortlessly share your map.
Major Findings
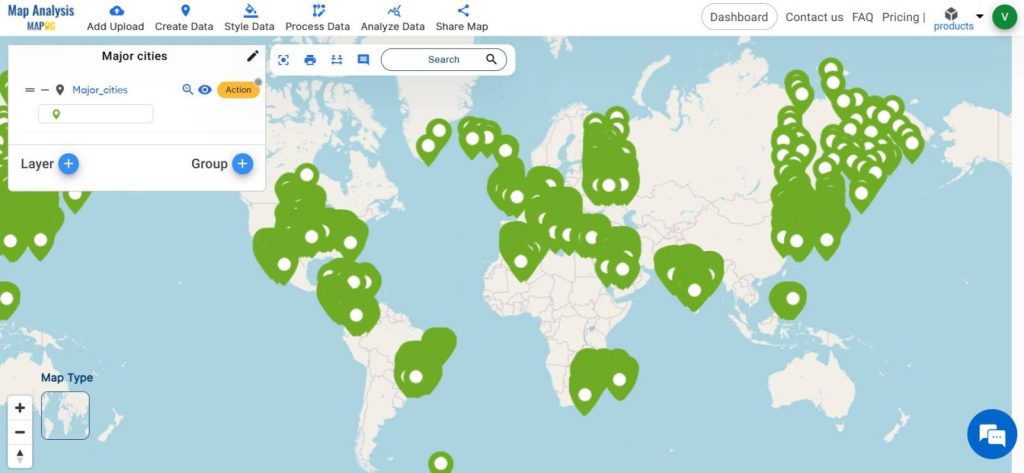
Importing Excel data of major cities into MAPOG is a straightforward process that allows users to leverage geographic information for analysis and visualisation. This map depicting major cities can serve as a valuable tool for understanding the spatial dynamics of urbanisation, economic development, and human geography. And thus, providing insights that inform decision-making and policy formulation at various scales.
Industry and Domain
- Urban Planners and Policy Makers: They can use the map to gain insights into the spatial distribution of major cities, urban growth patterns, and demographic trends.
- Researchers and Academics: Researchers and academics in fields such as geography, urban studies, sociology, and economics can utilise the map for spatial analysis, empirical research, and academic studies.
- Businesses and Investors: Businesses and investors can benefit from the map by gaining insights into market opportunities.
Conclusion–Import Excel Data into MAPOG
Integrating Excel data into MAPOG expands the capabilities of spatial analysis and decision-making. By following these steps, users can efficiently import Excel data into MAPOG. Thus, enabling the integration of tabular and spatial data for comprehensive analysis and visualisation. This integration empowers users across various domains to leverage the combined power of MAPOG and Excel for informed decision-making and spatial understanding.