Welcome to the world of Sustainable Waste Management. MAPOG is showing us a new path by ‘Mapping Recycle Centres Near Landfill. Let’s explore it. This is bringing big changes to the waste management system and making it more efficient and environmentally conscious. Join us on this journey.
Key Concept Mapping Recycle Centres Near Landfill:
Here, strategically place recycling centres to decrease landfill loads, support waste management, and envision an eco-friendly future. The link to the data is attached at the end of the article. Check out another blog Mapping Tiger Attack Hotspots – Create an Online Map and Share.
Steps to Mapping Recycle Centres Near Landfill:
Step 1:
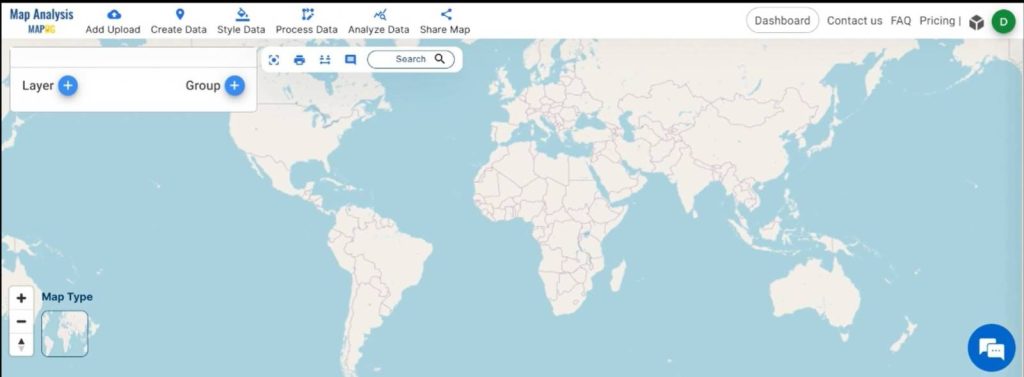
Open MAPOG Map Analysis Interface, and upload GIS data by clicking “Add Upload” from the menu toolbar, then navigate to “Add GIS Data.”
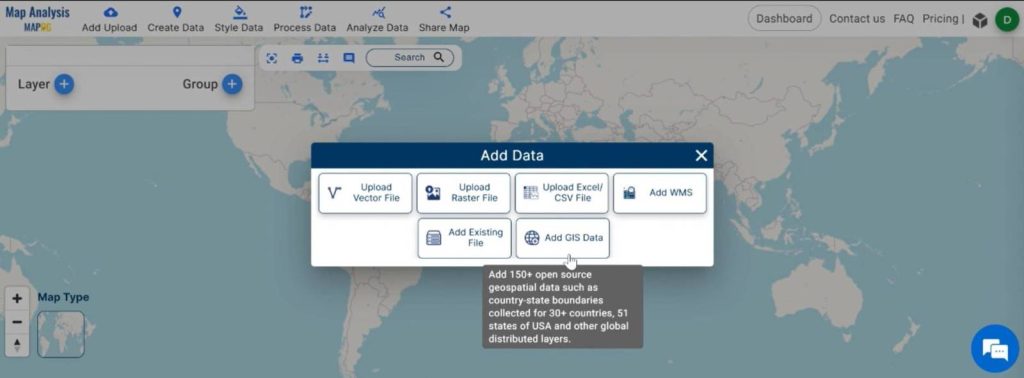
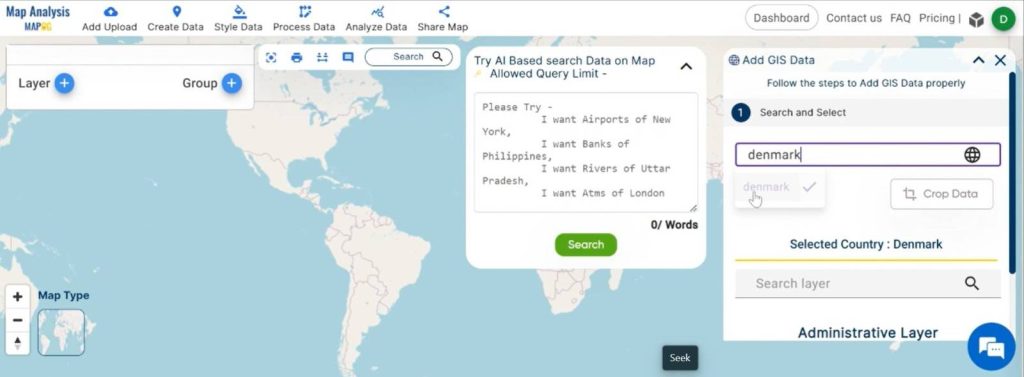
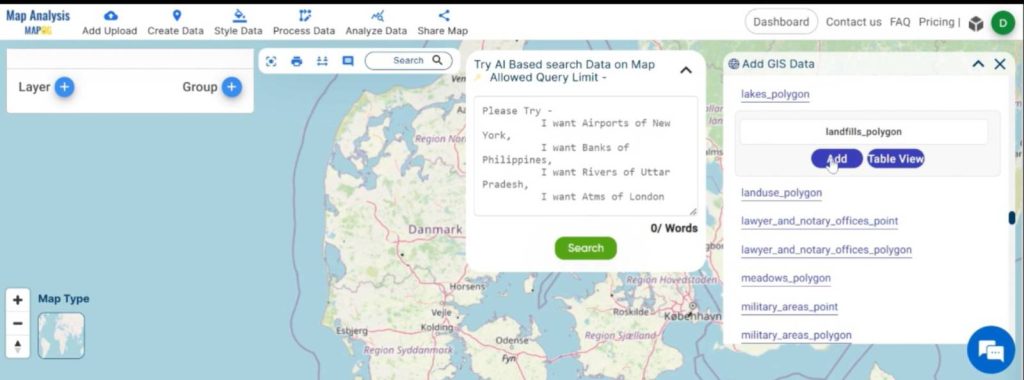
Choose your desired country and select the relevant landfill site polygon data, then “Add” to build a solid foundation for your analysis.
Step 2:
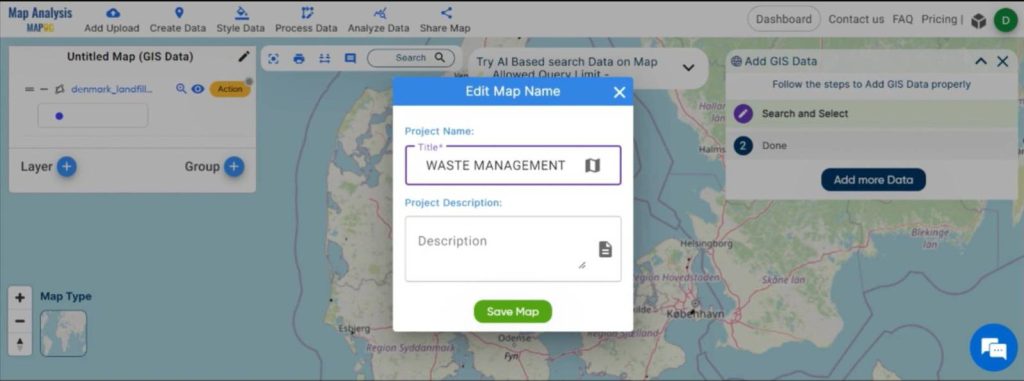
After successfully adding the data, give a suitable name to the layer from “Edit Map Name”.
Step 3:
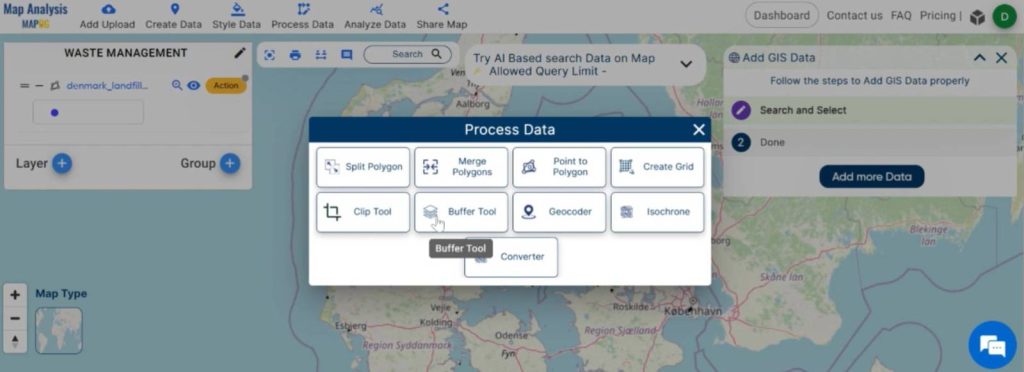
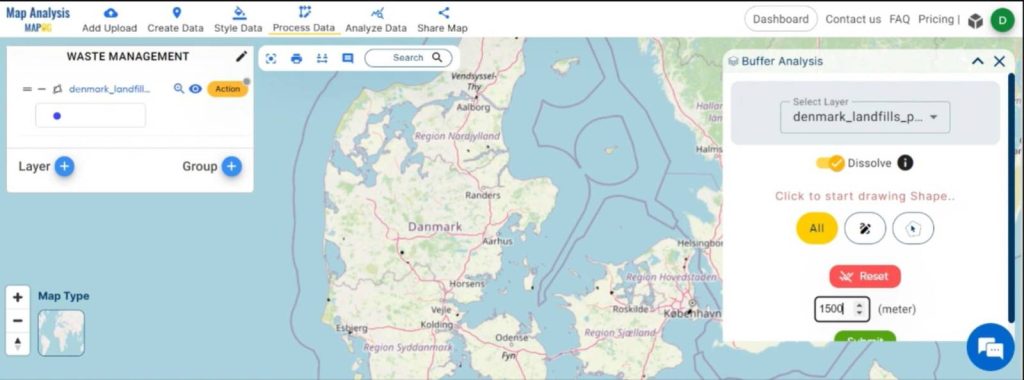
Now for adding a buffer zone navigate to the “Process Data“, a new panel window will open on your screen, click on the “Buffer Tool” choose the layer where you want to create the buffer zone.
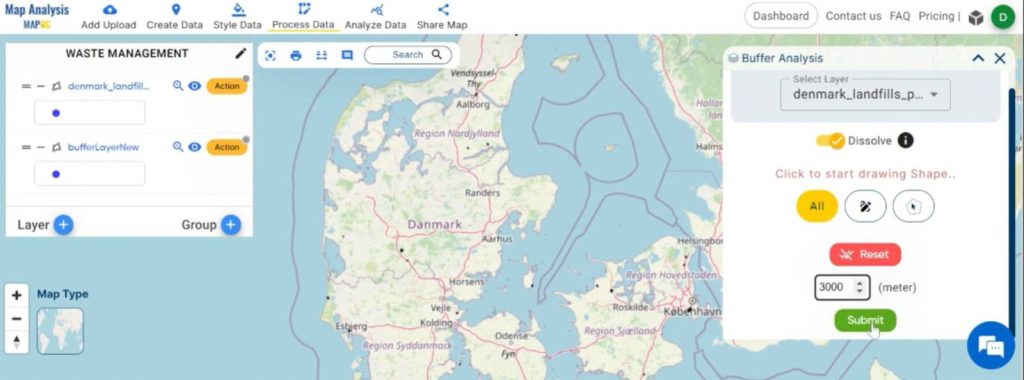
Input the desired range (e.g. 1500m, 3000m), and ‘submit’. The Buffer Lyer is added now. Similarly, add multiple buffer zones as needed.
Step 4:
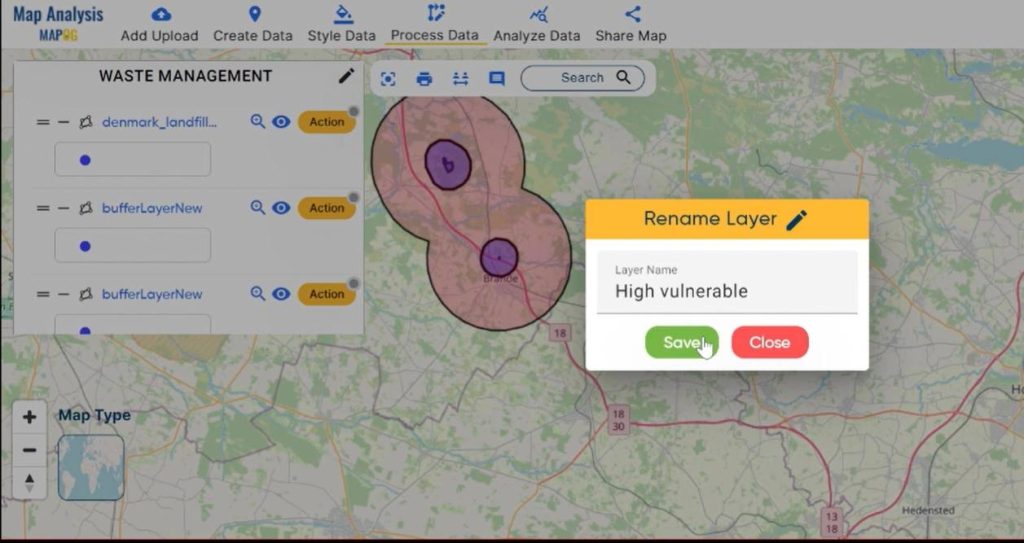
For renaming Buffer layer, Go to the “Action” button, select the pencil icon, and assign names like “High Vulnerable” (for 1500m) and “Moderate Vulnerable” (for 3000m).
Step 5:
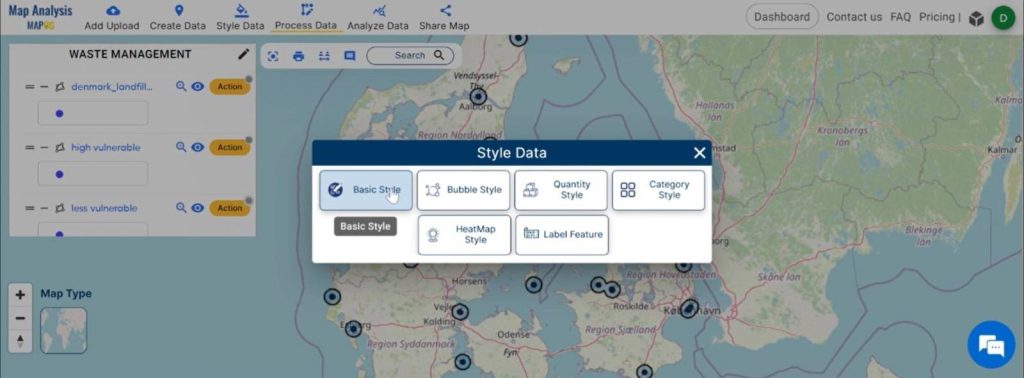
Customize the appearance of different buffer layers by navigating to “Style Data“, a new panel window will open on your screen, select “Basic Style.”
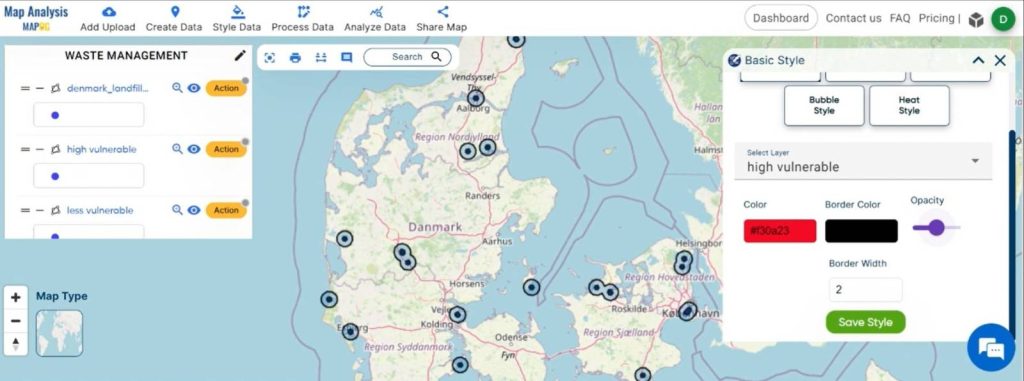
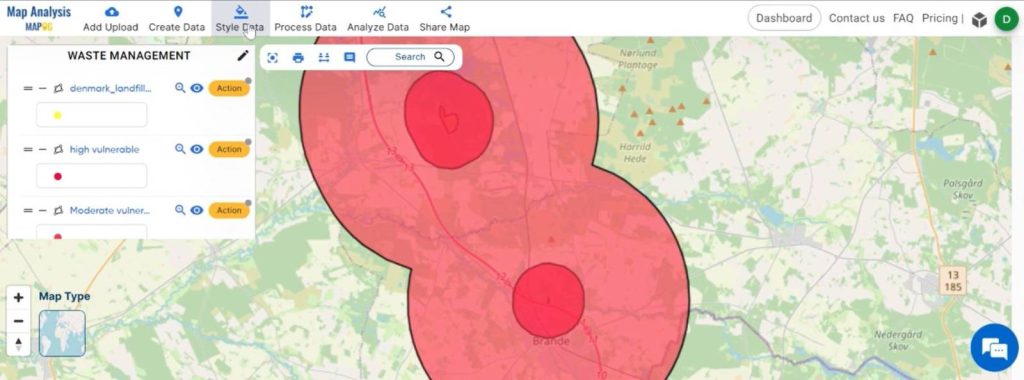
Now you can choose suitable colours for each buffer layer to enhance visual clarity from the right side of your screen.
Step 6:
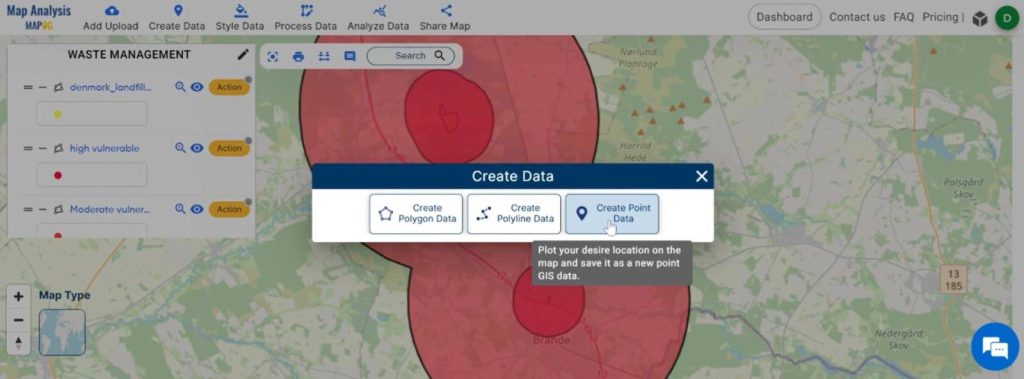
To plot recycle centres go to the “Create Data” tool and “Create Point Data” feature.
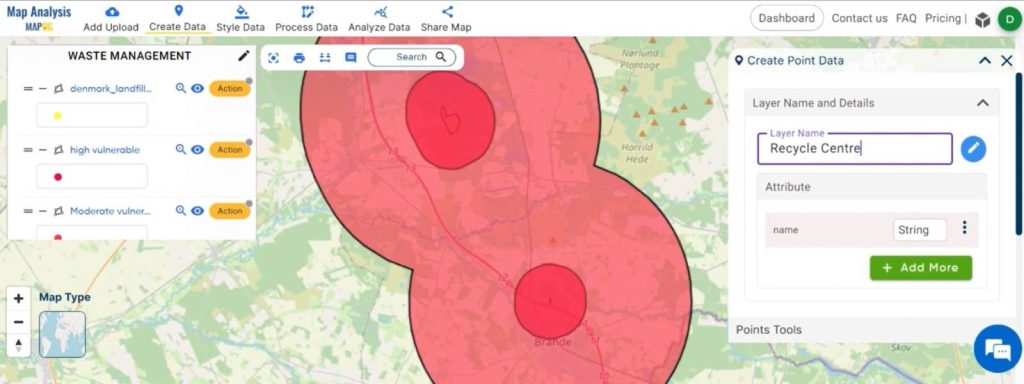
Name your point data from ‘Layer Name‘.
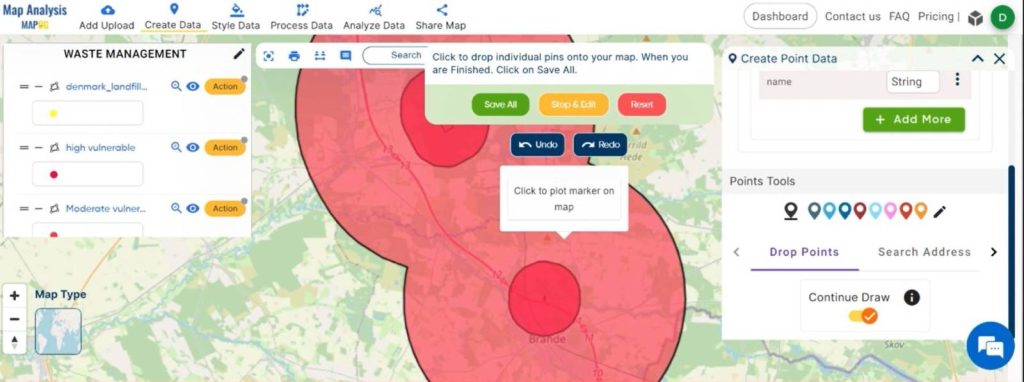
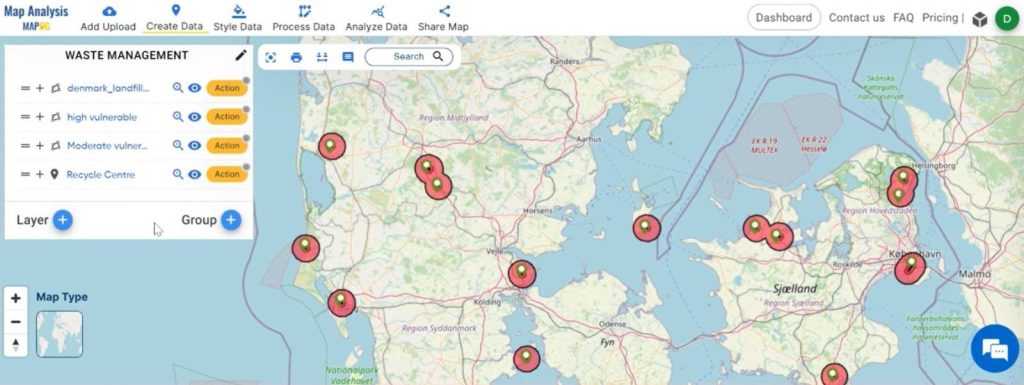
Choose the “Drop point’ option and select “ Continuous Draw”. Now, plot the point to show recycle centres within the 1500m buffer zone for every landfill site. After plotting, click “Select All” for effective placement.
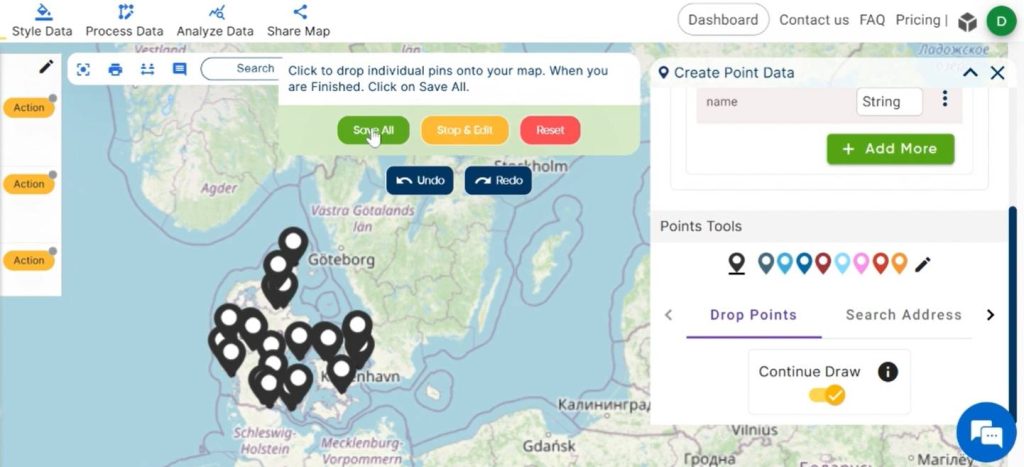
Step 7:
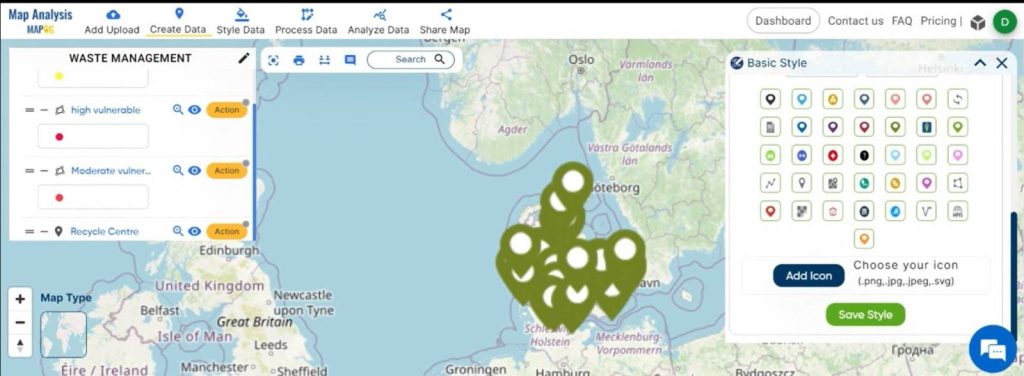
From “ Basic Style” you can change your icons and style your data. Go to “ Style Data” and click “ Basic Style”. Now choose icons as per your requirement.
The final map is ready now.
Major Findings for Mapping Recycle Centres Near Landfill:
- MAPOG optimizes waste management by strategically placing recycle centers.
- The implementation of buffer zones at 1500m and 3000m acts as a proactive measure to mitigate environmental impact, fostering efficiency.
- The approach not only improves operational effectiveness but also raises community awareness about environmental risks.
Industry and Domain for Mapping Recycle Centres Near Landfill:
- MAPOG is designed for a diverse audience, including environmental planners and waste management teams.
- Its practical solutions extend to benefit local communities residing near waste sites.
- MAPOG contributes to a sustainable and eco-friendly future, involving all in maintaining our surroundings.
Conclusion:
In a nutshell, MAPOG isn’t just a map; it’s a solution. It helps clean up polluted areas and guides everyone, for waste management, towards a safer future. Explore the map we’ve made, showcasing waste sites and planned recycle centers.