What is a Split Polygon tool?
The Split Polygon tool is a function that allows to divide a polygon into multiple sections along a specified line. This tool enables analysts to dissect complex geometries into simpler components, facilitating more precise spatial analysis and data management. This article delves into the significance of the MAPOG Split Polygon tool and its application in public health planning.
- Data Manipulation: It allows users to manipulate spatial data efficiently by dividing polygon features into smaller, more manageable units.
- Efficiency: Splitting polygons automatically streamlines the editing process, saving time and effort compared to manual delineation or digitization.
- Enhanced analysis: Dividing polygons into smaller units can facilitate more detailed spatial analysis.
The Split Polygon tool enhances data management, editing capabilities, analysis workflows, and visualisation techniques. Thus, contributing to more effective and informed decision-making in various fields such as urban planning, public health, and more.
Key Concept– Public Health Planning using Split Polygon Tool
In public health planning, the split polygon tool in MAPOG enables the division of geographic areas into smaller, more manageable units, facilitating targeted interventions and precise planning. Armed with this knowledge, public health planners can craft tailored approaches to meet the distinct requirements of each locality, such as implementing vaccination campaigns, enhancing healthcare provision, and so forth. This approach facilitates efficient administration and ensures fair distribution of public health initiatives, extending assistance to those most in need. Embark on a journey through the various articles on our blog like How to Merge Polygons in Maps and Biodiversity Conservation: Step-by-Step Guide to Clip Polygon for Effective Maps for a mesmerizing reading voyage. The links for GIS Data which we are using here are mentioned at the end of the article.
Follow the below process Step-by-step for Public Health Planning
Step 1: Open Map Analysis
Navigate to Map analysis interface from MAPOG platform.
Step 2: Upload data
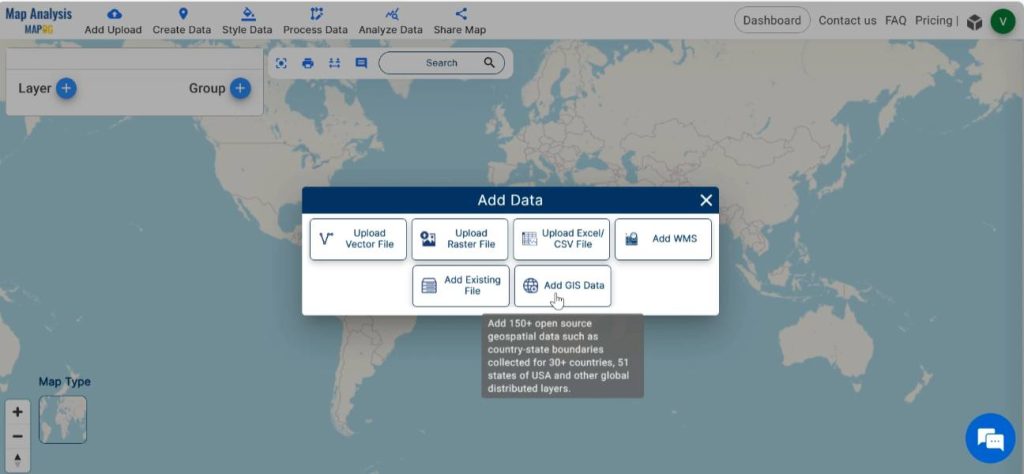
Administrative boundaries serve as a solid framework for public health initiatives. Therefore, let’s initiate the process by adding administrative boundary polygons onto the map. For this, click on the Add Upload option from the menu bar at the upper left end, and then go to the Add GIS Data option.
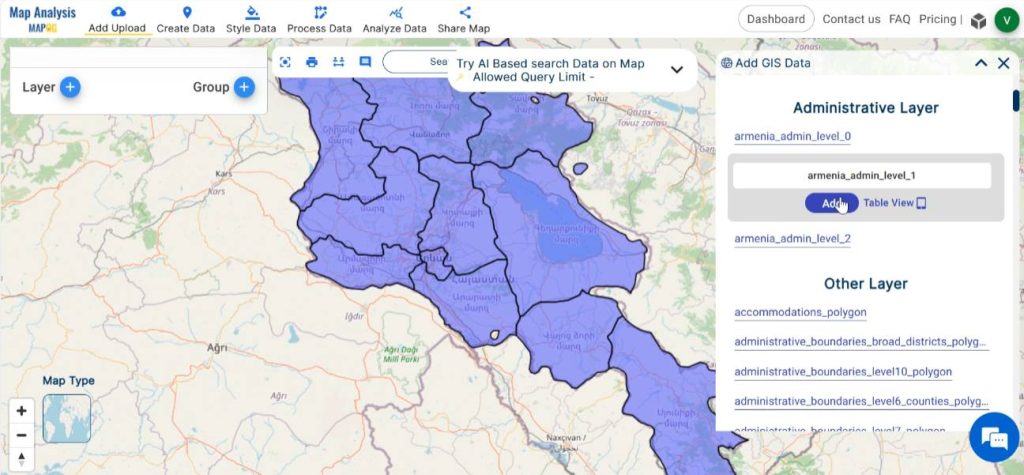
Then, select the country of your preference from the GIS data. Find out and Add administrative boundary polygon layer. With the Table view option preview the data table of the chosen layer.
Step 3: Save map
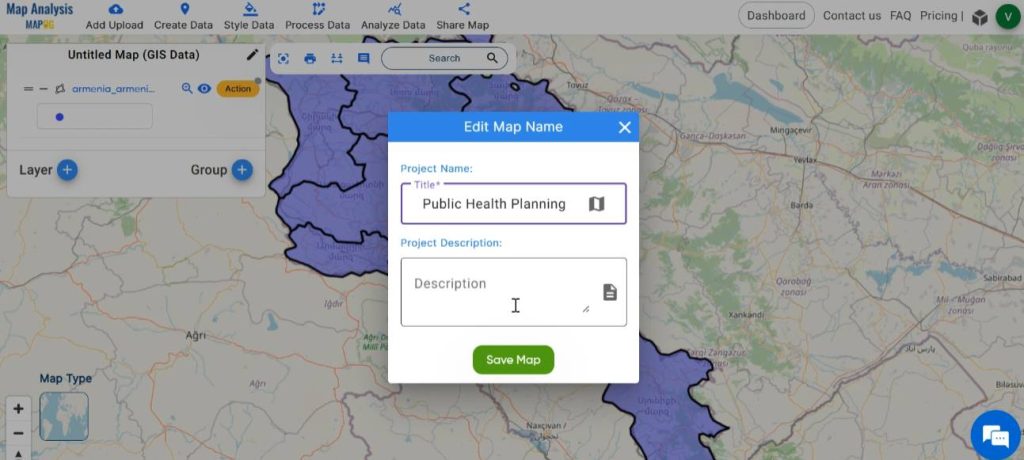
In the next step, save the map with a suitable name. In order to do this, click on the pencil icon near “Untitled Map”. Enter a suitable name, and if desired, provide a brief description of your project. Finally, save the map by clicking on the “Save Map” button.
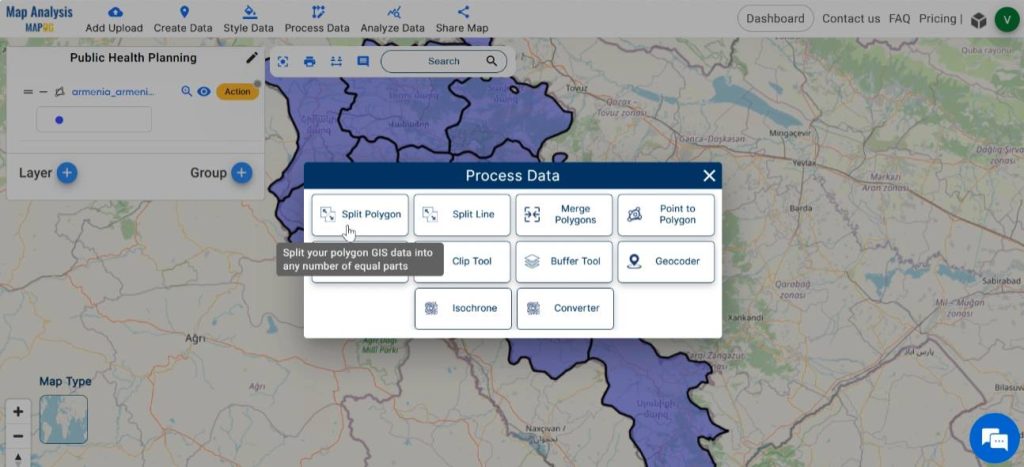
Step 4: Split the polygons
Now, let’s proceed to split the relevant administrative area into equal divisions to facilitate more manageable administration. For this, click on Process Data and then select Split Polygon tool.
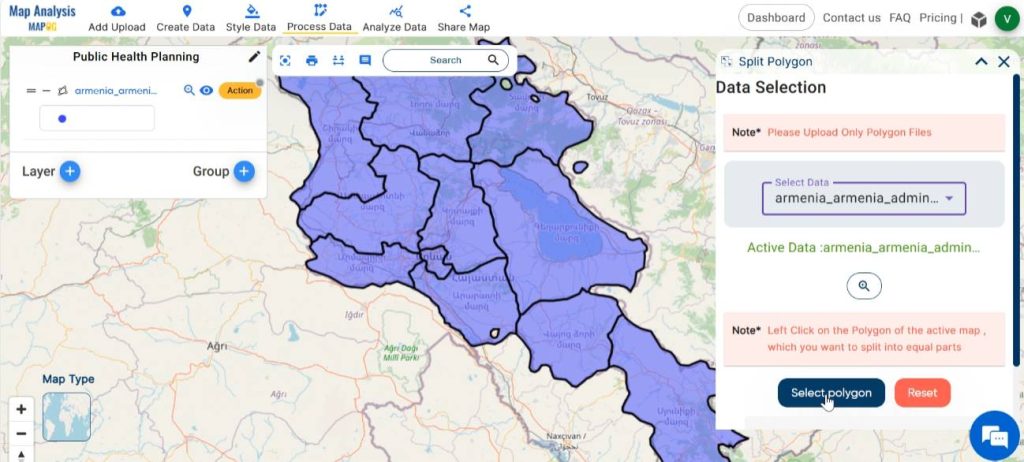
In the dialogue box appeared, select the layer having data to be splitted. Then click on ‘Select Polygon’ and select polygon on the map which you want to split into equal parts by left click.
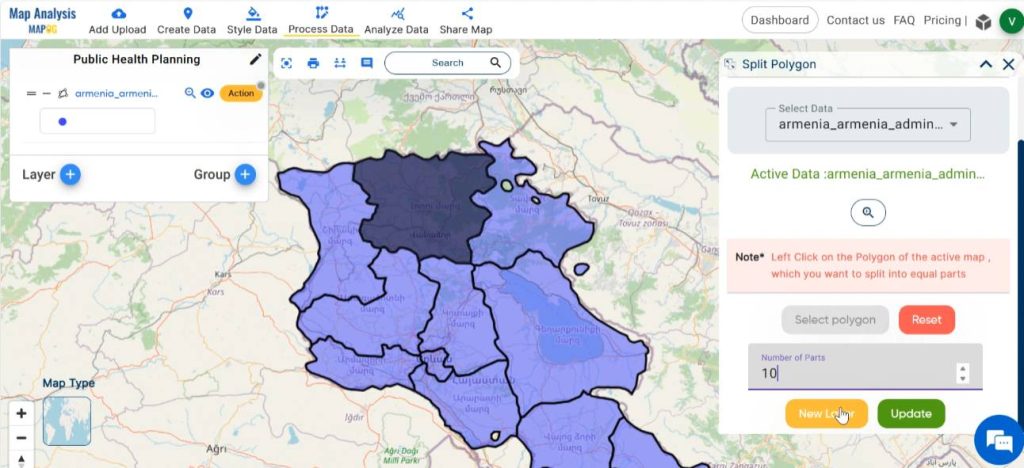
In the given field, enter the number of parts to which the polygon is to be split. For Saving the map either click on ‘Create a new layer’ to save the map as a new layer or update it into the current layer.
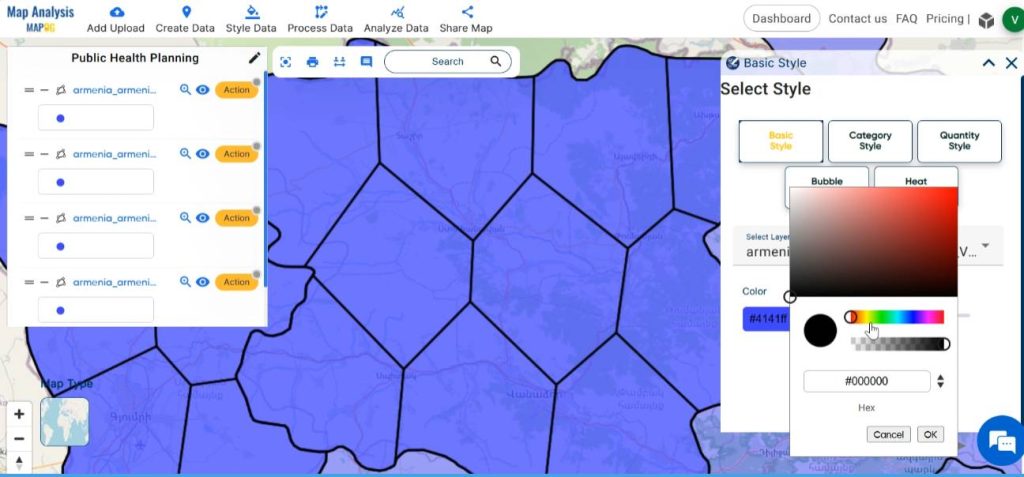
Step 5: Style the Map
For visual enhancement of the map, click on Style Data and select Basic Style.
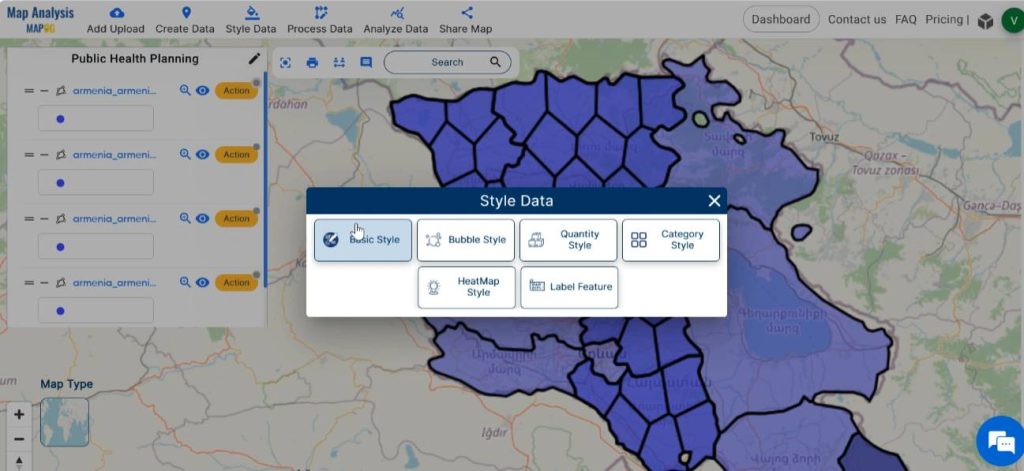
Choose the layer to be styled. Then, select a suitable colour gradient for the layer. Finalise the changes by clicking on Save Style.
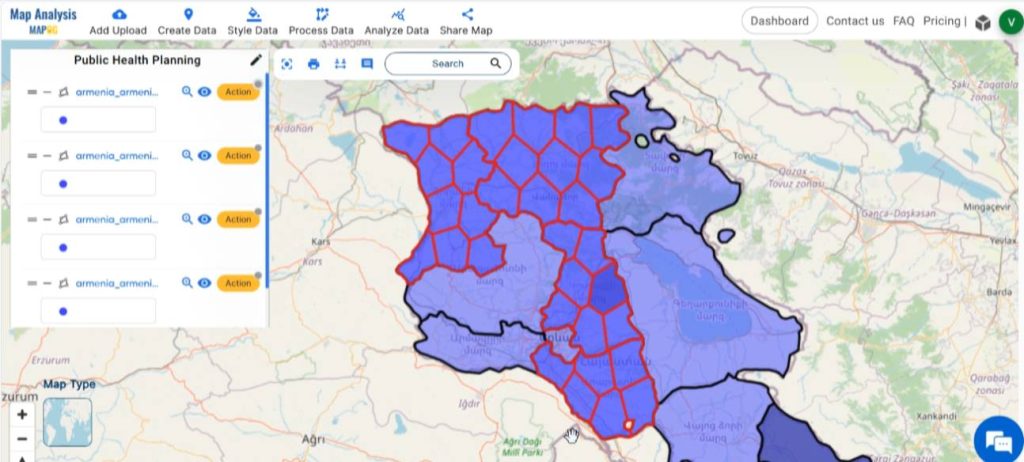
Finally, we have generated a map for public health planning using the MAPOG split polygon tool, dividing a large area into clear and distinct smaller areas that can be targeted with public health interventions.

Major Findings–Public Health Planning using Split Polygon Tool
- Resource allocation: The map enables optimised resource allocation, ensuring that public health resources such as healthcare facilities, personnel, and funding are distributed equitably based on the specific needs of each area.
- Enhanced monitoring and evaluation: The division of the large area into smaller units allows for more precise monitoring and evaluation of the effectiveness of public health interventions.
- Improved stakeholder engagement: The clear delineation of smaller areas on the map fosters enhanced collaboration and engagement with local communities, authorities, and stakeholders.
Industry and Domain
- Healthcare providers: Healthcare professionals and organisations can utilise the map for more efficient delivery of healthcare services and interventions.
- Policy Makers: Decision-makers at various levels of government can benefit from the insights provided by the map to inform policy development and resource allocation strategies.
- Researchers and Academia: Researchers studying public health issues can use the map as a valuable tool for spatial analysis for more detailed investigation.
Conclusion–Public Health Planning using Split Polygon Tool
In conclusion, the integration of MAPOG Split Polygon Tool, plays a pivotal role in public health planning. By enabling the subdivision of geographic areas and facilitating spatial analysis, MAPOG empowers health professionals to allocate resources efficiently, and tailor interventions to the specific needs of communities.
GIS Data Links
Explore more content on our blog:
Online GIS Data Map Viewers and Table Visualizations
Creating GIS Solutions for Urban Agriculture Map
Mapping EV Charging Station Accessibility with Isochrone Analysis