In the realm of Geographic Information Systems (GIS), MAPOG stands out as a robust tool for spatial analysis and visualization. This article delves into the application of MAPOG, centering on the analysis of thematic route maps with bus stop buffer zones. Our exploration involves thematizing route lines with distinct colors and integrating bus stop buffer zones to emphasize crucial transit points. Discover the power of MAPOG in ‘Creating Thematic Route Maps and Bus Stop Buffer Zones’.
Key Concept to Creating Thematic Route Maps and Bus Stop Buffer Zones
This exploration focuses on harnessing the capabilities of MAPOG, a robust Geographic Information Systems (GIS) tool, for spatial analysis and visualization. The key objective is the creation of thematic route maps enriched with bus stop buffer zones. Importantly, for full transparency and accessibility, we provide the link to the utilized data at the end of this article. Our emphasis lies in thematizing route lines with distinctive colors and strategically integrating bus stop buffer zones to highlight essential transit points.
Below are the steps to transform our mapping exploration into a reality using the user-friendly MAPOG Map Analysis tool:
Think of it as your navigational ally, seamlessly uncovering the intricacies of thematic route maps and bus stop buffer zones. Let’s delve into the straightforward process that turns this GIS journey into an accessible and insightful experience.
Step1. Upload Roads Data:
Upload a base map for context and bring in road data. This initial step sets the stage for a detailed analysis, benefiting urban planners, transportation agencies, and logistics companies.
- Click on the “Add Data” button and Choose “Upload Vector File” option.
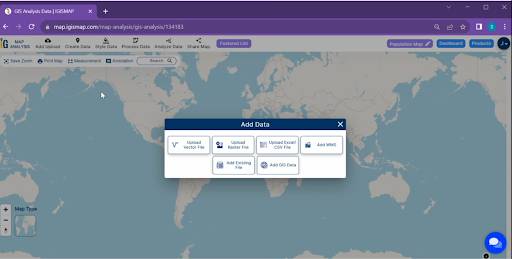
2. You can see the “Upload Vector File” Tool successfully open on the right side of your screen. Here You have to select your Bus Stop data. Click on the “Browse” button.
3. Click on the “Upload” button.
Step2. Thematic Styling for Roads:
Now, add thematic styling to differentiate roads and highways. This level of detail aids urban planners, ensuring clarity in designing infrastructure projects for city development.
- Click on the “Style Data” button and choose the “Category Style” option.
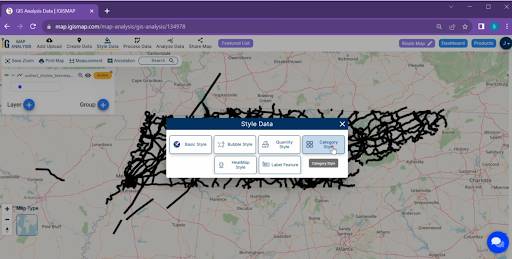
2. Here you have to select the agriculture layer and click on the “category circle” option. change the line color now select the attribute “Name” and click on the save style button.
Utilize MAPOG tools to thematize route lines with different colors based on relevant attributes, providing a dynamic representation of the transit network.
Step3. Uploading Bus Stop Data:
Now that we’ve set the stage with roads and bus routes, enhance our map by adding crucial details. First up, we’ll incorporate bus stop data. Once uploaded, MAPOG will populate the bus stop locations on our map. This step is essential for our next move – creating strategic buffer zones around key bus stops.
- Buffer zones around agriculture areas are created. Click on the “process data” option then choose the “Buffer tool“.
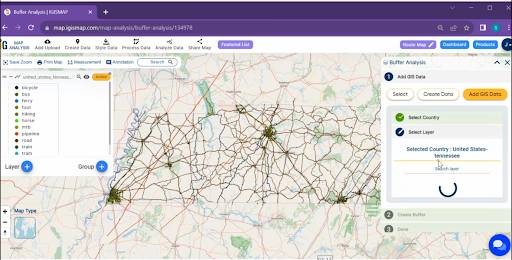
2. You can see the Buffer Analysis Tool open on the right side of the screen. here add the Bus Stop Layer.
Step4. Create Bus Stop Buffer Zones:
Now, let’s dive deeper. Create buffer zones around key bus stops to offer nuanced insights. Bus stop buffer zones enhance transit planning by optimizing bus stop locations, promoting pedestrian safety, and influencing urban development decisions.
- Set the buffer range 1000 metres. Click on the Submit Button.
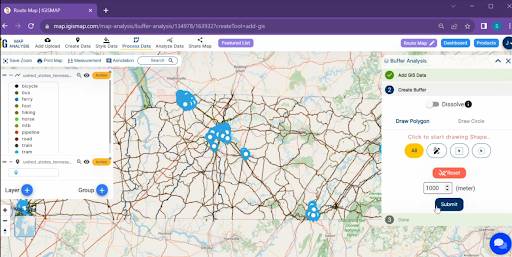
Implement the bus stop buffer zone tool to create visual buffers around key transit points, enhancing the clarity of important bus stops along the thematic route map.
Step5. Finalize and Export the Thematic Map:
With our map now enriched with details, let’s make those final adjustments. This comprehensive map is a powerful tool for industries like emergency management, city planning, retail strategy, and more. Export it for impactful use.
Results and Analysis:
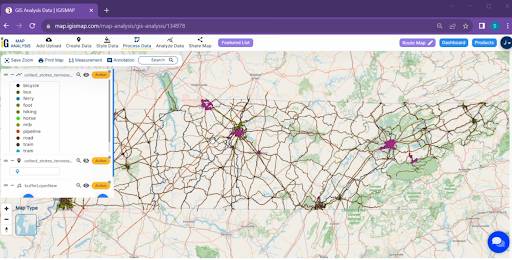
Upon completion of the above steps, MAPOG will generate a visually engaging thematic route map with bus stop buffer zones, offering a comprehensive overview of Tennessee’s transit infrastructure. Analyzing the map will reveal insights into route patterns, connectivity, and the significance of key bus stops.
Findings:
The findings may include identifying well-connected transit corridors, understanding the distribution of key bus stops, and recognizing areas with high transit activity, all crucial for enhancing the efficiency of public transportation systems.
Factors or Benefited Domains:
- Urban Planning: Planners can use the information to assess the effectiveness of current transit routes, guiding future urban development strategies and infrastructure planning.
- Transportation Agencies: Transit authorities can optimize route planning and resource allocation based on the insights gained from the thematic route map, improving overall transit system efficiency.
- Real Estate Development: The real estate sector can benefit from understanding transit connectivity, influencing decisions on property development and investments in areas with robust transportation networks.
- Emergency Services: Emergency service providers can use the thematic route map to identify key transit routes and bus stops, facilitating rapid and efficient response strategies during emergencies.
In conclusion, MAPOG proves to be an invaluable tool for spatial analysis, as demonstrated by the creation of thematic route maps with bus stop buffer zones. The insights gained from this analysis have far-reaching implications for urban planning, transportation agencies, real estate development, and emergency services, making it a crucial resource for informed decision-making in these domains.
Link of the Data:
Explore the data further through our GIS Data product, uncovering valuable information for in-depth analysis and understanding.