Thematic Mapping for Data Analysis is a powerful technique used to visualize complex datasets by representing geographic patterns through color-coded maps and scalable symbols. One of the most effective methods in thematic mapping is Bubble Thematic Mapping, where data points are displayed as bubbles of varying sizes, proportional to a specific attribute such as population density, market trends, or resource distribution. This technique enhances spatial data visualization, making it easier for researchers, businesses, and policymakers to identify trends, compare regions, and make informed decisions. Whether for urban planning, demographic studies, or business intelligence, thematic maps provide an intuitive way to analyze and interpret large-scale data efficiently.
Now MAPOG is also on Playstore Download Now.
What is Bubble Thematic Styling?
Bubble thematic styling is a cartographic technique where data points are represented by varying sizes of bubbles, with each bubble’s size proportional to the value of the corresponding attribute, allowing for visual comparison and analysis of spatial patterns.
Purpose of using Bubble Thematic Styling
- Enhanced Visual Appeal: Bubble thematic styling allows for the creation of visually appealing user interfaces through customizable bubble shapes, colors, and animations, improving user engagement and aesthetic appeal.
- Simplified Information Organization: By employing bubble thematic styling, information can be organized into easily digestible clusters, facilitating intuitive navigation and comprehension for users, particularly in complex data visualization or storytelling contexts.
Benefits of using Bubble Thematic Styling
- Efficiency in Design Consistency: Bubble Thematic Styling enables rapid creation of visually cohesive designs by applying consistent themes across various elements, reducing the need for manual adjustments and ensuring a polished look throughout the application.
- Enhanced User Experience: By employing Bubble Thematic Styling, developers can tailor the user interface to match specific preferences or branding, resulting in an immersive and engaging experience that resonates with the target audience, thereby improving user satisfaction and retention.
Industries and domains
Bubble thematic styling can be used in web design, event planning, marketing, fashion, interior design, gaming, education, and virtual reality.
Key Concepts
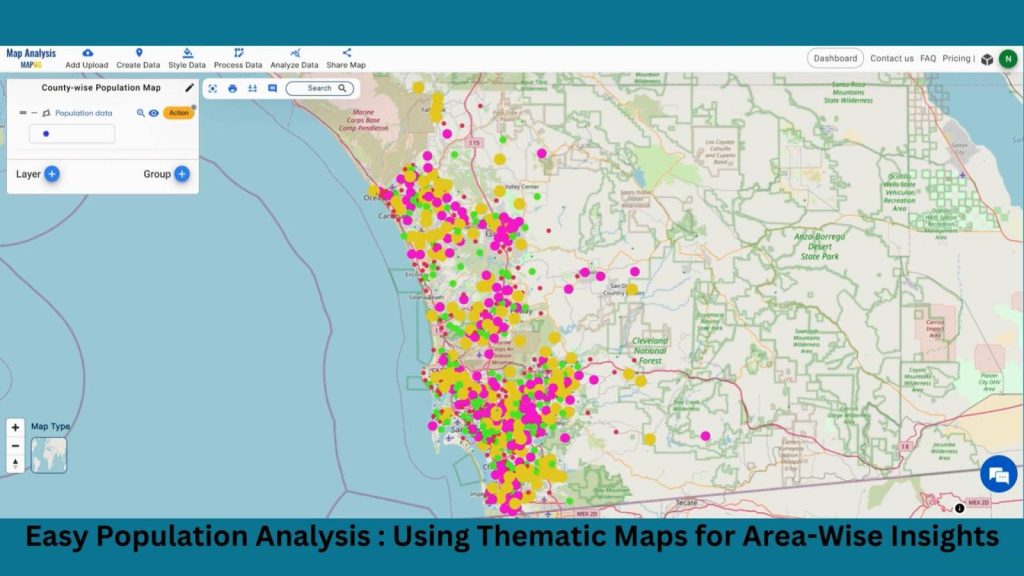
In “Easy Population Analysis: Using Thematic Maps for Area-Wise Insights” in MAPOG, we leverage bubble style visualization to analyze population distribution at the block level, offering insights for targeted resource allocation and urban planning solutions.
Area-Wise Population Analysis revealed population density variations using Bubble Thematic Styling in MAPOG, aiding in targeted resource allocation for urban development planning.
Steps to create Easy Population Analysis: Using Thematic Maps for Area-Wise Insights
Step 1: Upload Population data
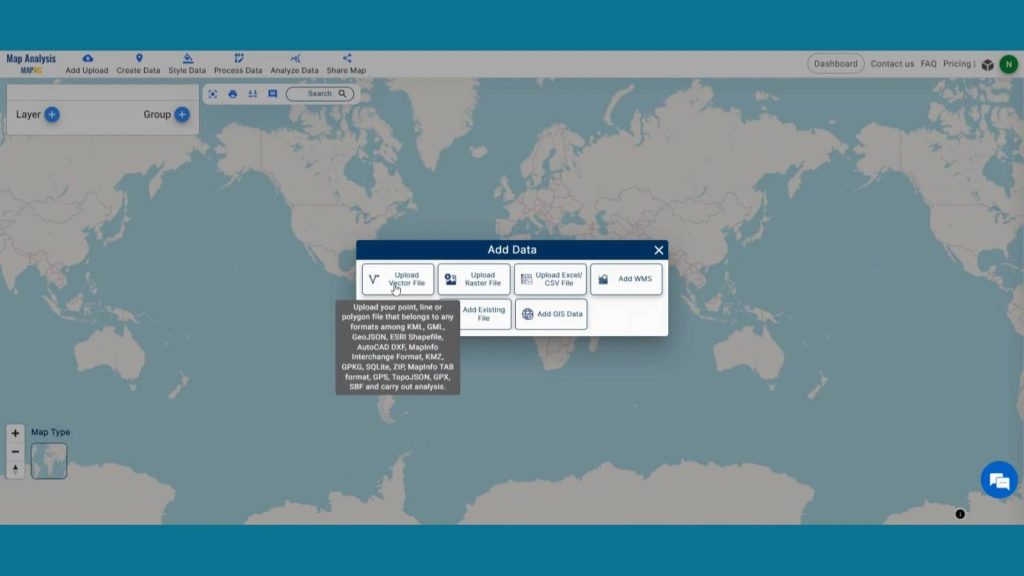
First, navigate to the Map Analysis interface. Then click on the “Add upload” button in the upper left corner. A dialogue box will open. Click on “Upload Vector File” to add data.
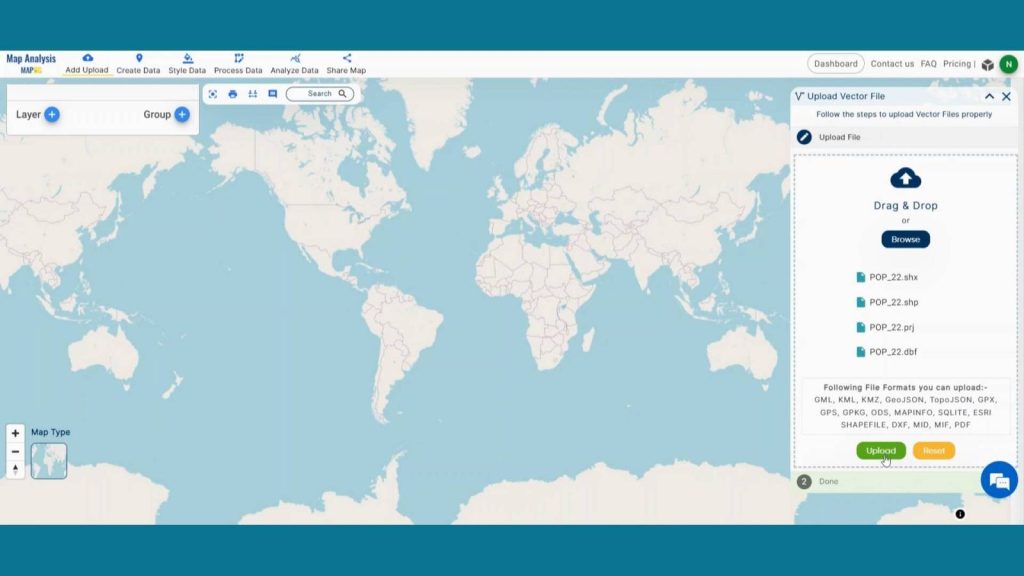
A box will open on the right side of the screen, select Browse option to browse the County-wise population data & click Upload to upload the data.
Step 2: Save Project
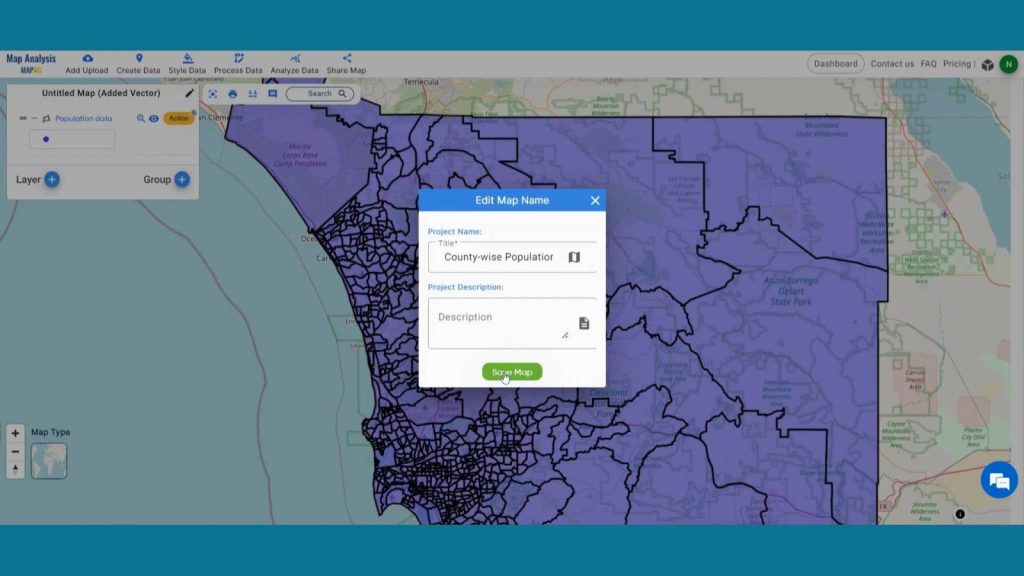
Now, click on the pencil icon situated right after the “Untitled Map” text to save the project. In the dialogue box write proper name and description that describe the project accurately. And click on save map option. Your project will be saved.
Create a sustainable future with landfill optimization using spatial analysis techniques. Dive into how buffers, split polygons, and grid creation revolutionize waste management strategies in “Create Map for Landfill Optimization: Spatial Analysis Approach”
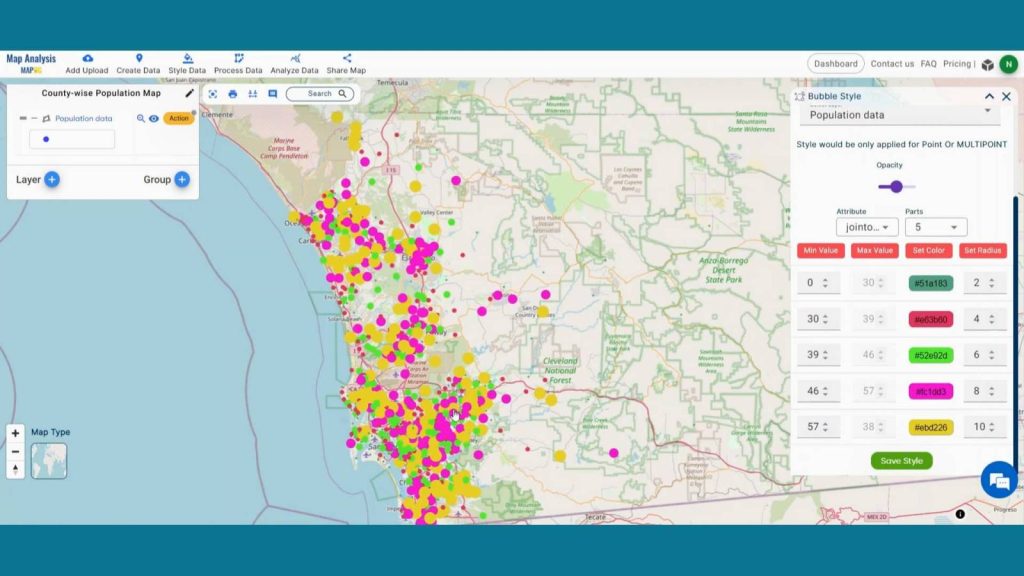
Step 3: Add Thematic Style
Enhance the visualization of County-wise population and using style data option in the header. Click on Bubble style option.
Unlock the potential of highway buffer mapping for precise building overlap analysis and road extension strategies by “Mapping highway Buffer and Building Overlap Analysis – Extend Roads Width”. Explore how this technique enhances infrastructure planning and safety measures with targeted road width adjustments.
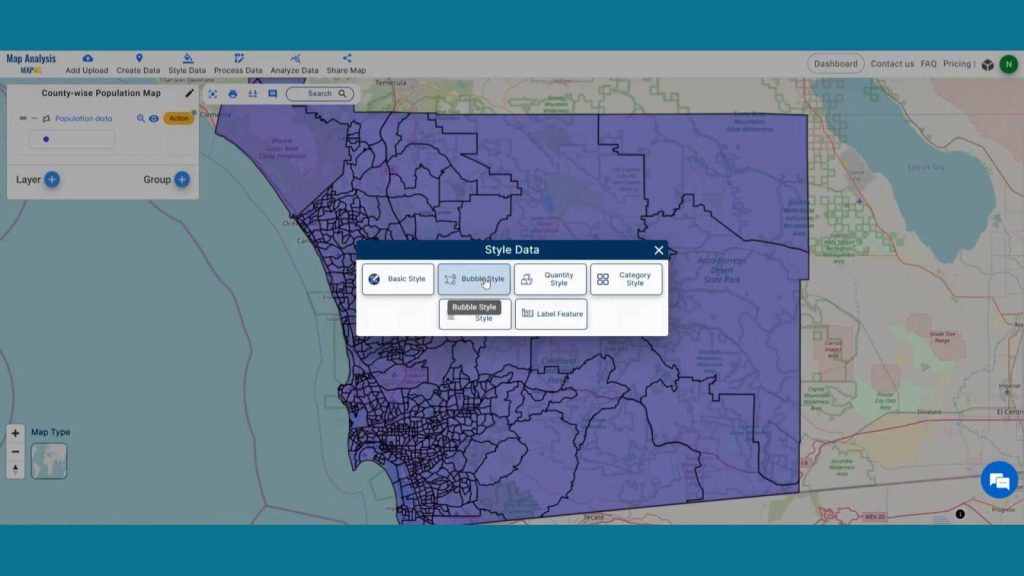
In data selection select the Block layer. Select the population attribute. MAPOG gives opportunity to reclassify attributes and change the size and colors of bubbles. Click on save style after you are satisfied with your changes.
Step 4: Results & Analysis
With our map now enriched with details, let’s make those final adjustments. The use of bubble-style thematic maps in MAPOG enhances data visualization, allowing for easy interpretation of population trends and spatial disparities, thereby informing informed decision-making in various fields such as urban planning, resource allocation, and public policy.
Major Findings
1. Population Distribution: Visualizing county-wise population density reveals areas of high and low population concentration across the region.
2. Urban-Rural Divide: Bubble styling highlights urban centers with larger bubbles, emphasizing population hubs amidst rural surroundings.
3. Demographic Hotspots: Identifying counties with disproportionately large bubbles indicates areas of significant population growth or demographic importance.
Domain and Industry
This map is an effective tool for retail, healthcare, urban planning, and other fields.
Explore the forefront of forest fire analysis with the Buffer Tool! Delve into how this technique identifies risk areas, empowering proactive measures for forest conservation and community safety in “Analysis of Forest Fire and Map Risk Areas with Buffer Tool”
Questions Solved through this article –
1. How does population density vary across different counties when visualized using bubble thematic styling?
2. Which counties exhibit the highest population growth rates, as indicated by the size of the bubbles in the thematic map?
3. Are there any spatial patterns or clusters of high population density observed in the county-wise analysis with bubble thematic styling?
4. Can the bubble thematic styling technique in MAPOG provide insights into disparities in population distribution and urban-rural dynamics across counties?
Conclusion
In conclusion, utilizing block-wise population analysis with bubble thematic styling in MAPOG provides actionable insights into spatial population distribution, aiding in informed decision-making for targeted resource allocation and urban planning initiatives, ultimately addressing population density disparities effectively.
Here are some other blogs you might be interested in