Unveil the power of precision in GIS with MAPOG’s Split Polygon by Line tool. Explore how this innovative feature revolutionizes polygon splitting, facilitating nuanced analysis and insightful mapping with ease and accuracy.

KEY CONCEPTS
Our goal is to split the Polygons using the split-by-line tool from MAPOG Map Analysis.
Learn more about the analyses using Split Polygons here Create Map for Landfill Optimization: Spatial Analysis Approach
Steps for Creating a Map with Joined Attributes
Below are the steps to follow to create the map
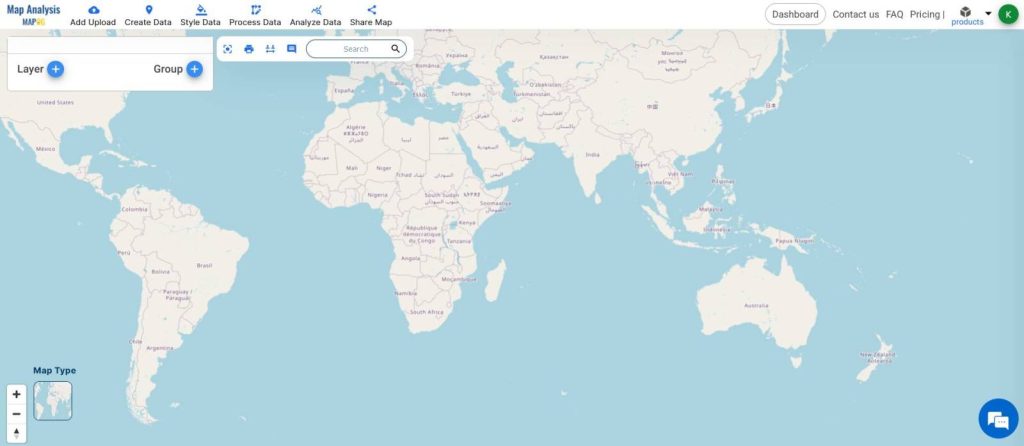
- Open Map Analysis
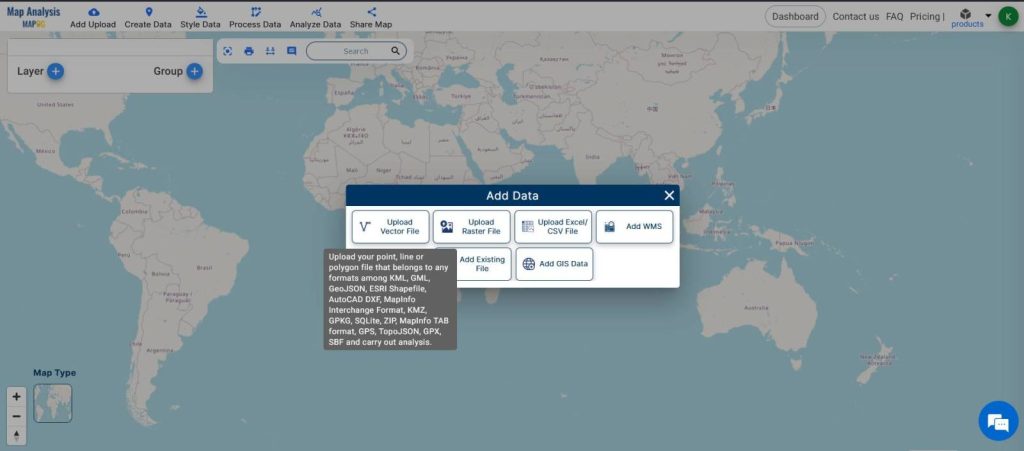
- From Add Upload, Add Vector Data
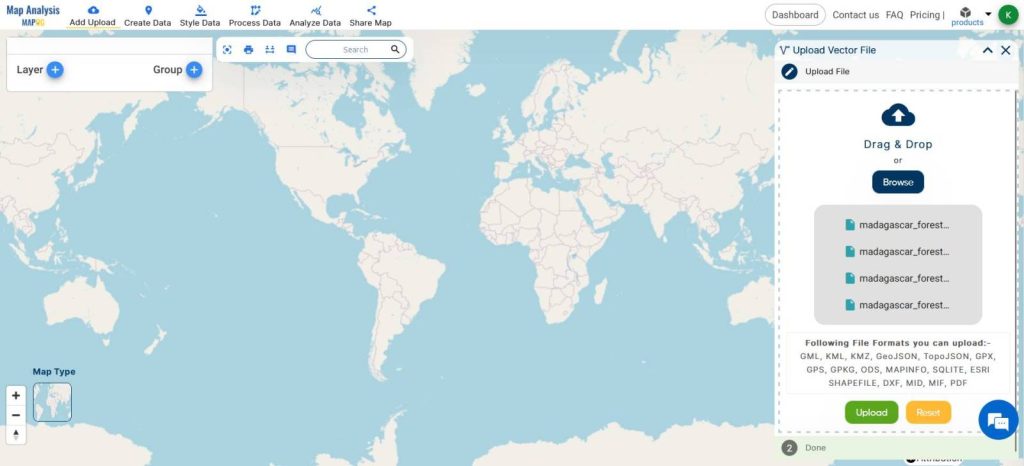
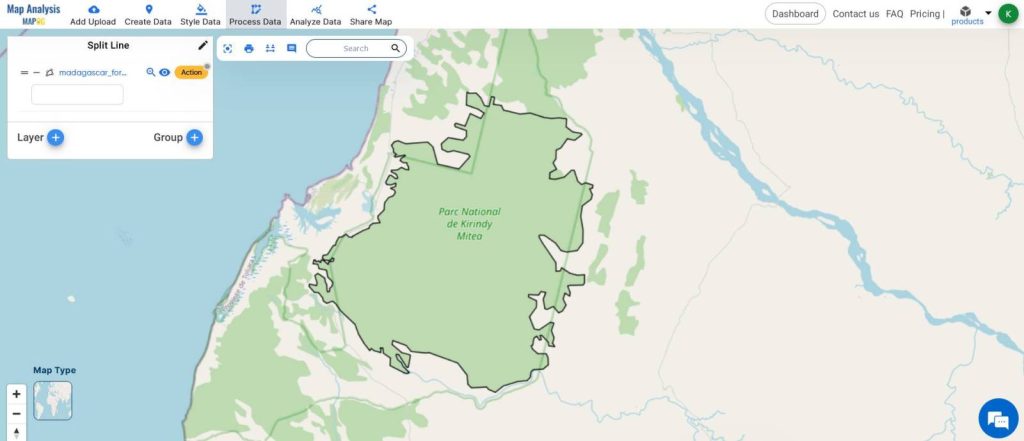
- Browse for the polygon layer
- Click Upload
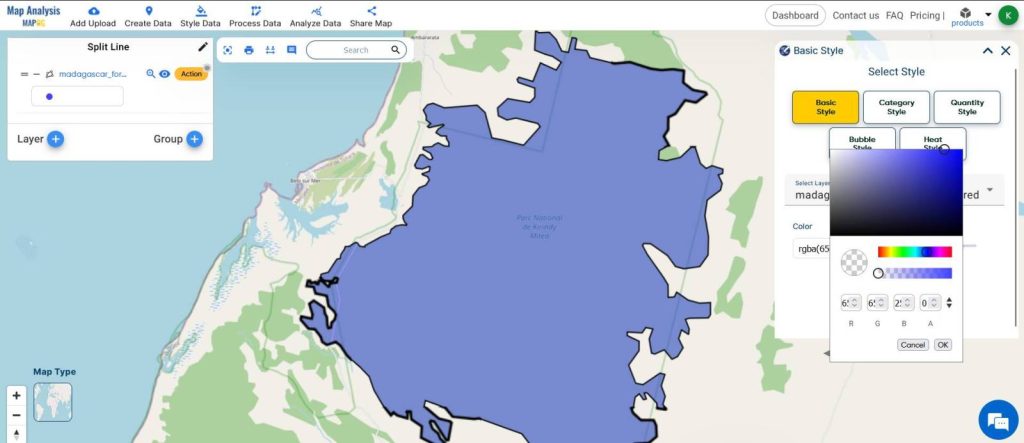
- Adjust the styling according to your preference using Style Data tools.
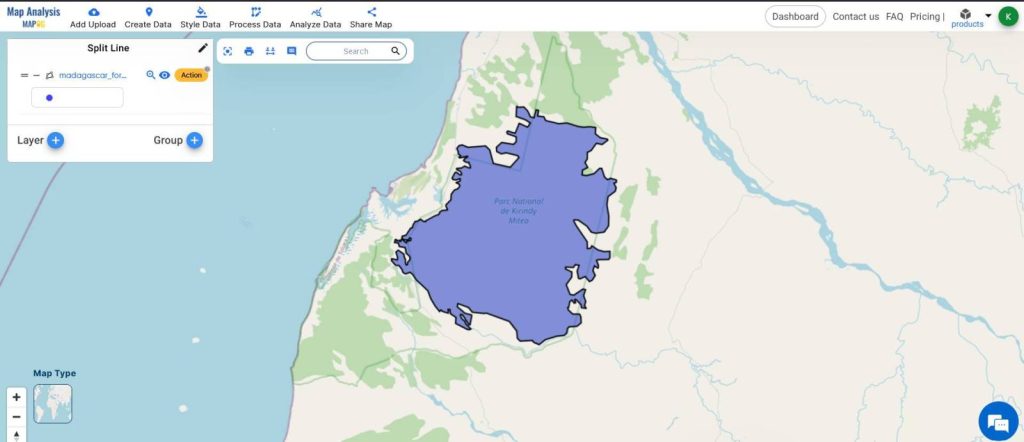
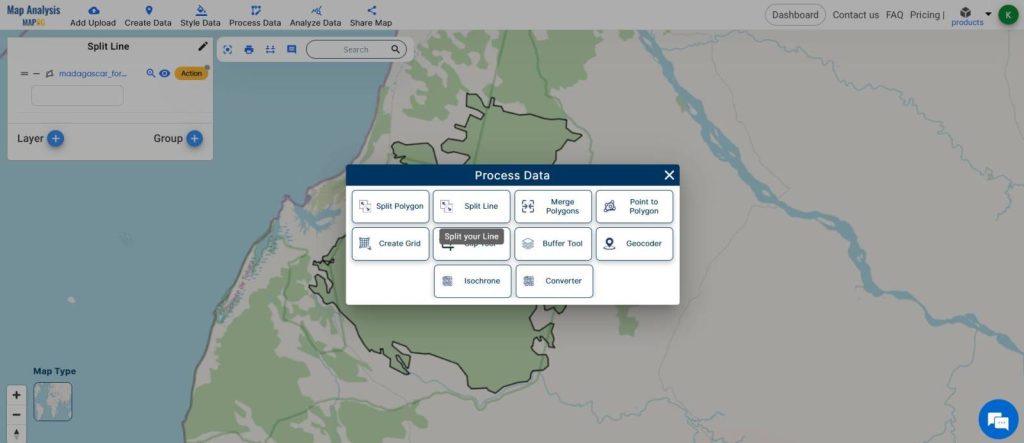
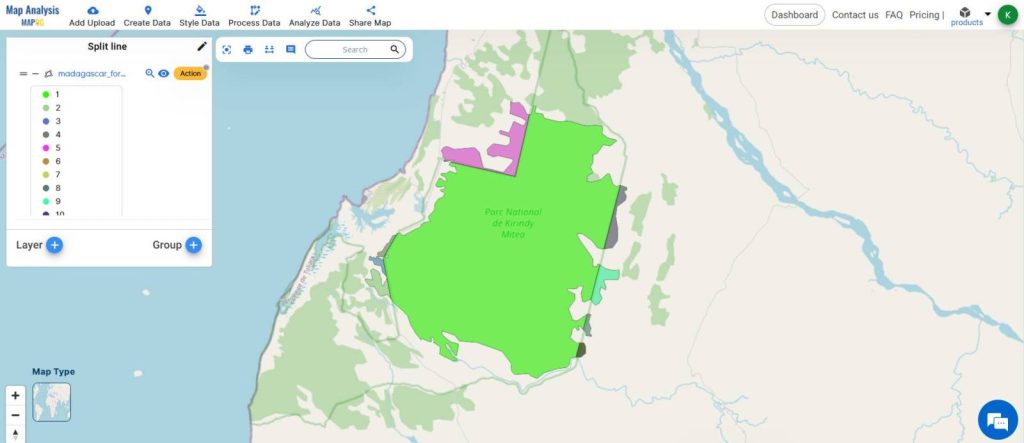
- From Process Data, select Split Line
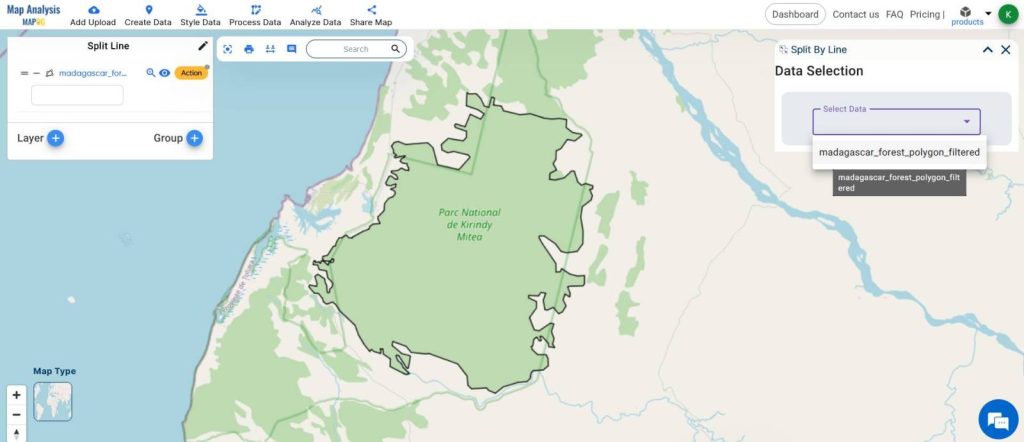
- Select the forest polygon layer
- Enable the Draw line icon
- Start drawing the line, referring to the corridor boundaries.
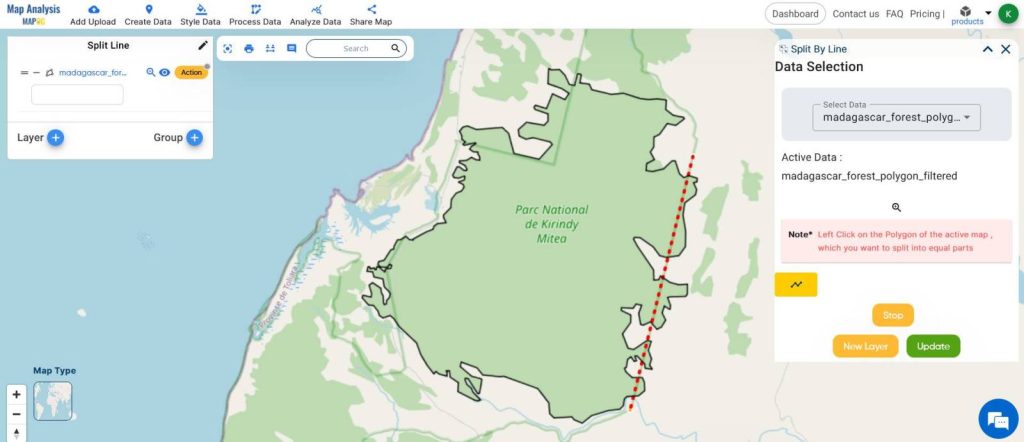
- Once done, click on UPDATE for the split to occur in the same layer and click on NEW LAYER to display the split in a new layer.
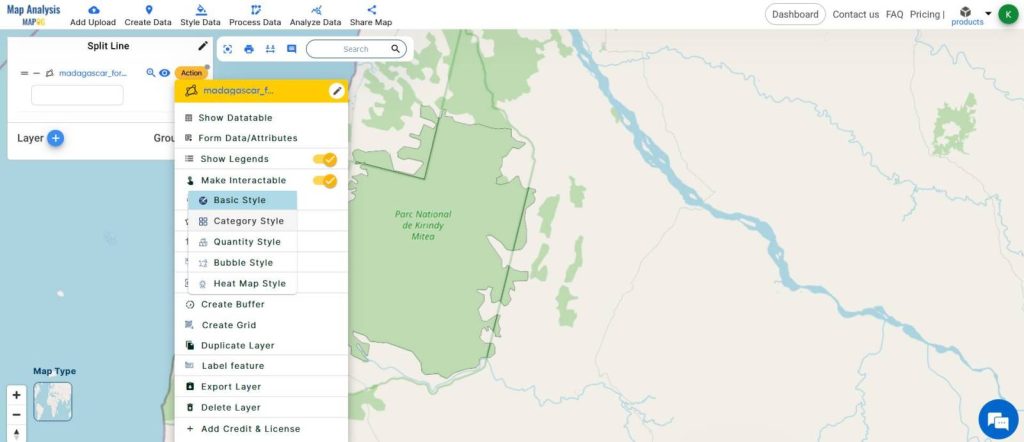
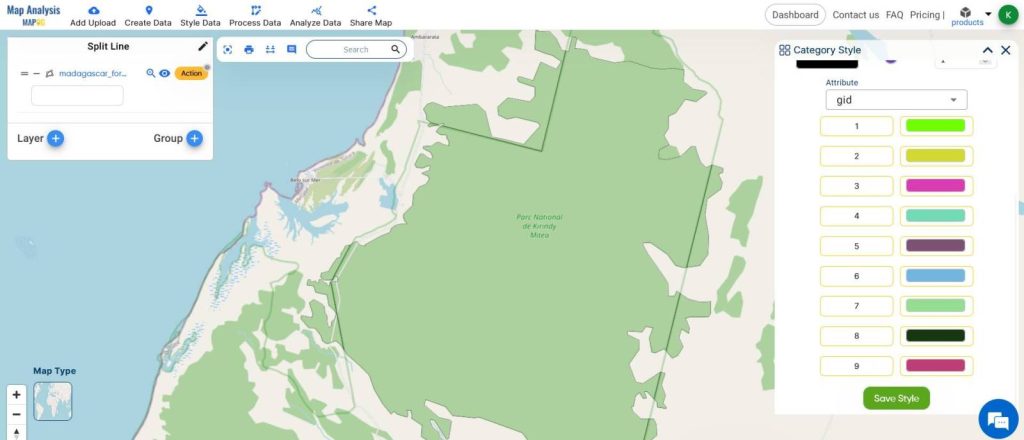
- Using the Category style, differentiate the split layer.
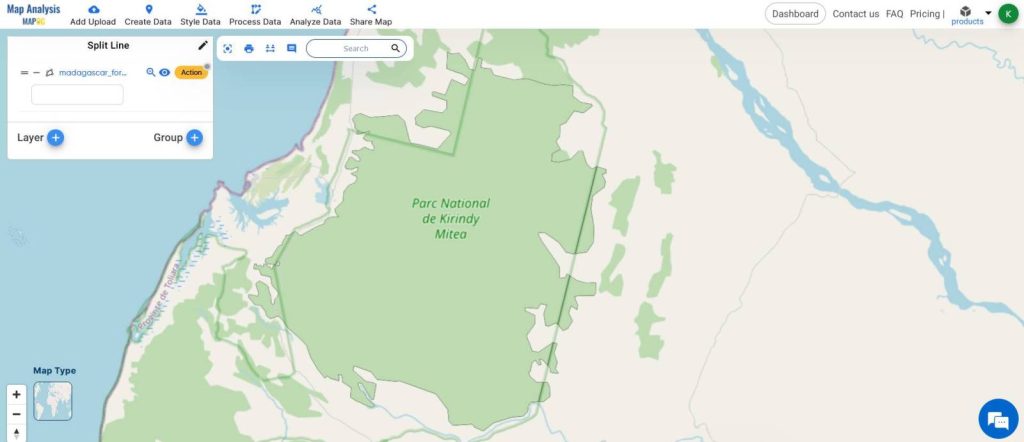
This is the Final Map
This demonstration of splitting the forest boundaries will allow people to understand the area of forest falling within and outside the corridor and plan actions accordingly.
MAJOR FINDINGS
- Optimized Corridor Design: The analysis revealed opportunities to refine national corridor routes, minimizing their impact on vital forest ecosystems while still meeting infrastructure needs.
- Ecosystem Fragmentation: It highlighted areas where forest boundaries were significantly disrupted by corridor construction, shedding light on potential ecological fragmentation and habitat loss.
- Strategic Conservation Targets: By identifying areas of high ecological value within the forest boundaries, the analysis provided insights for prioritizing conservation efforts and mitigating the environmental impact of development projects.
BENEFICIAL DOMAIN: Environment Conservation and Infrastructure Planning and Development
- Environmental Conservation: MAPOG Map Analysis identifies and preserves ecologically sensitive areas within forest boundaries, aiding strategic conservation efforts to protect biodiversity and maintain ecosystem integrity.
- Infrastructure Planning and Development: MAPOG Map Analysis provides insights into the impact of national corridors on forest ecosystems, supporting more sustainable infrastructure planning by minimizing disruption to natural habitats while meeting societal needs for transportation and connectivity.
.
For any inquiries or support needs, feel free to contact us at support@mapog.com.
CONCLUSION
So MAPOG Map Analysis proves to be an invaluable tool for understanding and managing the intricate relationship between human development and forest ecosystems.
With its precision and insights, we can navigate towards a future where sustainable infrastructure coexists harmoniously with nature’s bounty.
Let’s continue harnessing the power of GIS to foster a better world guided by the capabilities of MAPOG Map Analysis.
GIS DATA USED
Madagascar Forest Boundary Polygon
VIEW OUR PREVIOUS BLOGS
Grid Mapping for Accurate Spatial Analysis: Divide and Conquer with GRID Map Tool
Create a Map: Spatial Join Analysis of ATM Points within District Boundaries