In the ever-evolving realm of real estate development, leveraging the capabilities of Geographic Information System (GIS) mapping has become indispensable. This article explores the particular domain of power station analysis and site selection, highlighting the significant role that GIS tools, particularly the MAPOG, play in offering vital insights for well-informed decision-making. The examination centers on a dataset encompassing the United States, with a specific emphasis on the state of California.
Understanding the Concept: GIS mapping goes beyond traditional maps, offering a spatial perspective that is invaluable for real estate developers. Power station analysis involves assessing the spatial distribution and characteristics of power infrastructure. Site selection, on the other hand, revolves around identifying optimal locations for new developments based on various criteria, including proximity to key amenities.
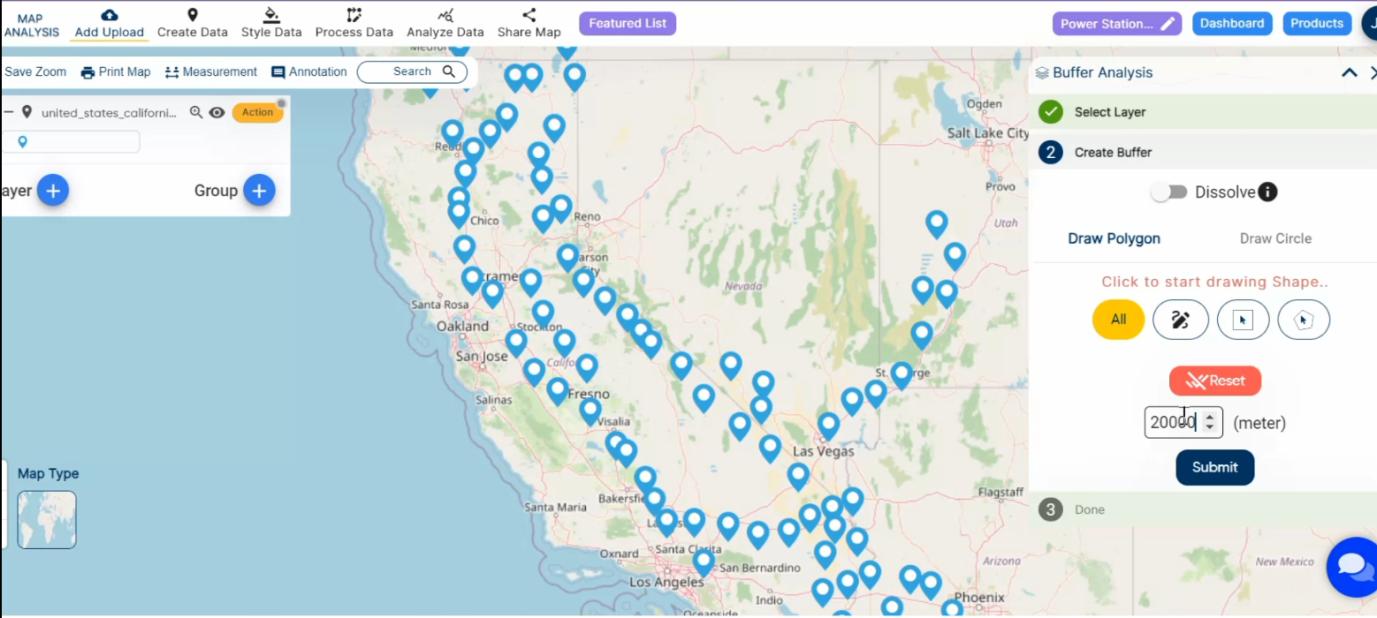
Buffer: A buffer is a zone created around a point, line, or polygon. In our context, we’ll use buffers to represent the potential impact area around each power station.
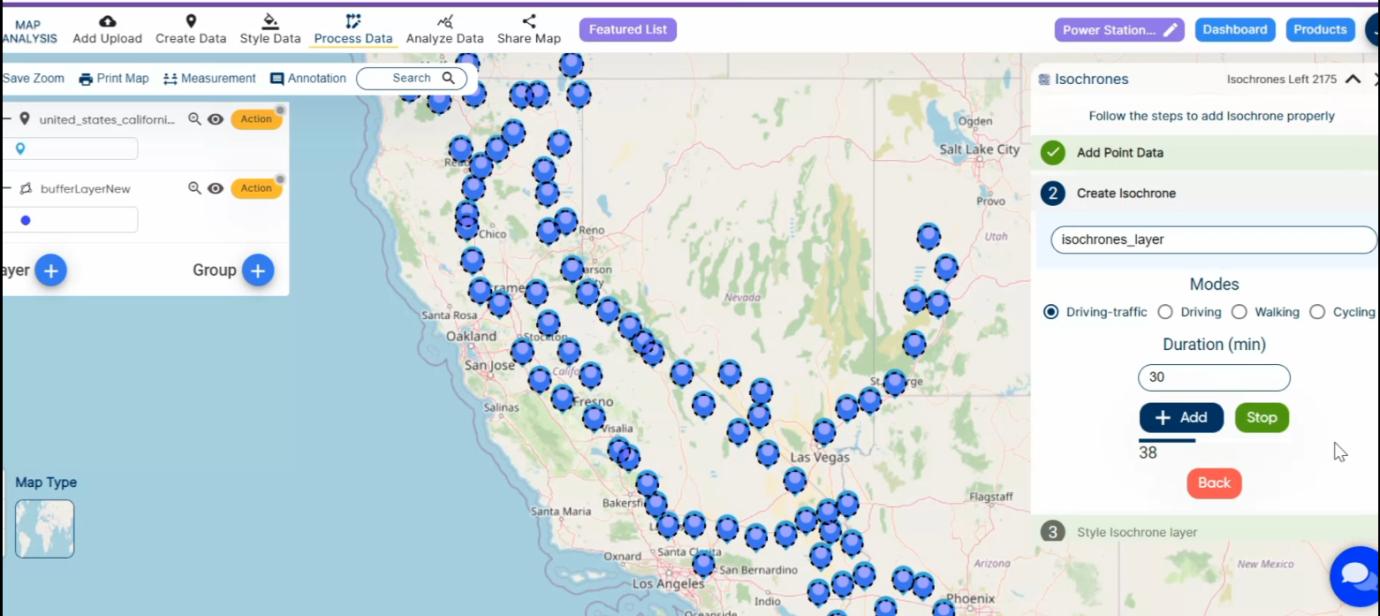
Isochrones: Isochrones are areas that can be reached within a specified travel time from a point. For power stations, we’ll use isochrones to visualise the areas reachable within a certain time, helping us understand accessibility.
Process:
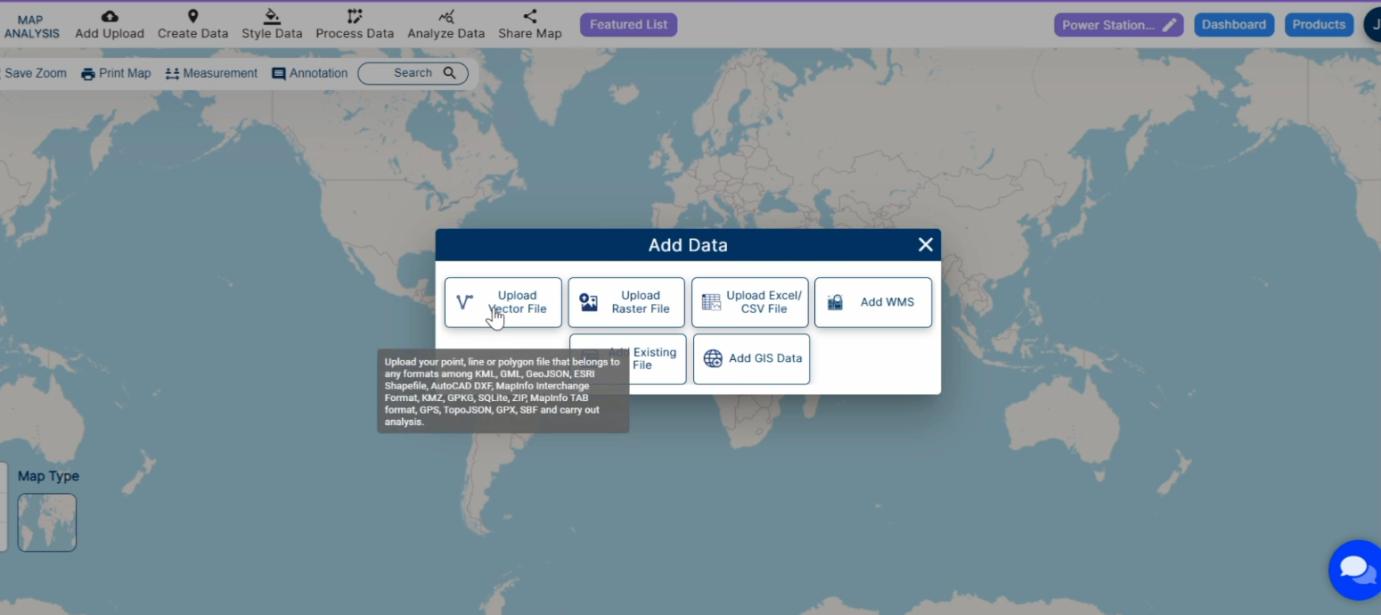
Step1. Add Power Station Points: Use the add points for each power station.
Step2. Create Buffers: Apply the ‘Buffer’ tool to create zones around each power station, representing their impact areas.
Step3. Generate Isochrones: Utilise the ‘Isochrones’ tool to visualise areas reachable within specific travel times from each power station.
Step4. Style Data: Apply styles to differentiate power stations, buffers, and isochrones. Use colours and labels for clarity and easy interpretation.
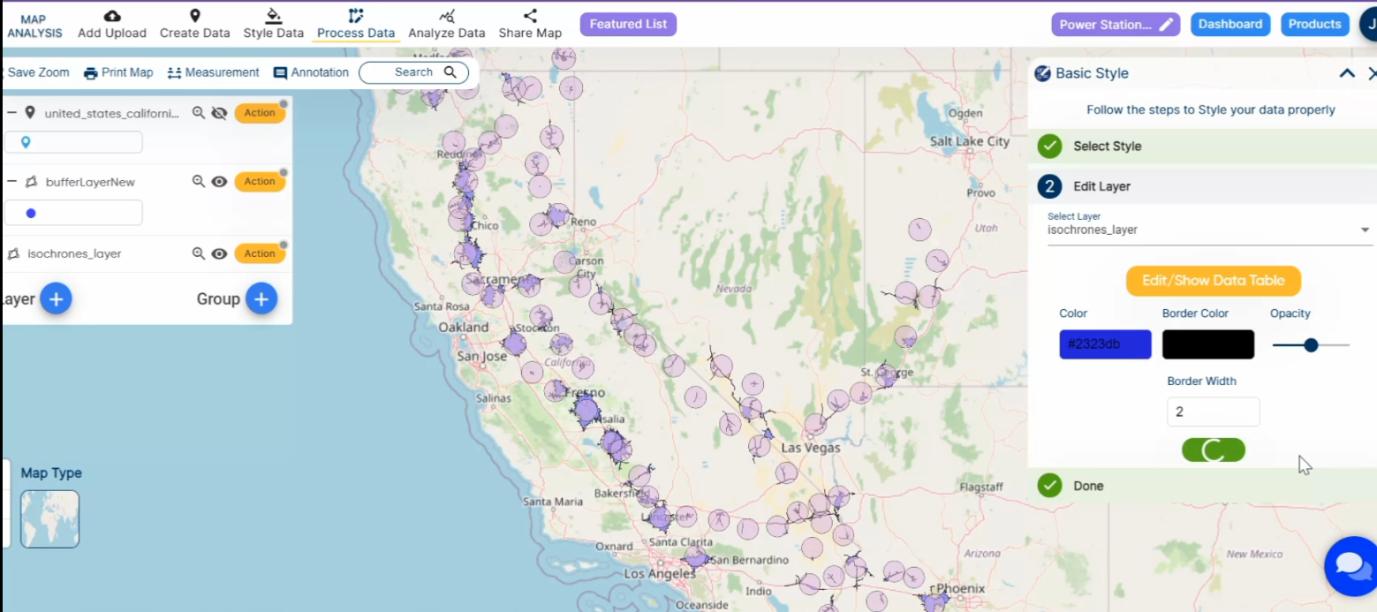
Step5. Finalize Visualization: Adjust transparency and add legends to enhance the final map’s visual appeal and readability.
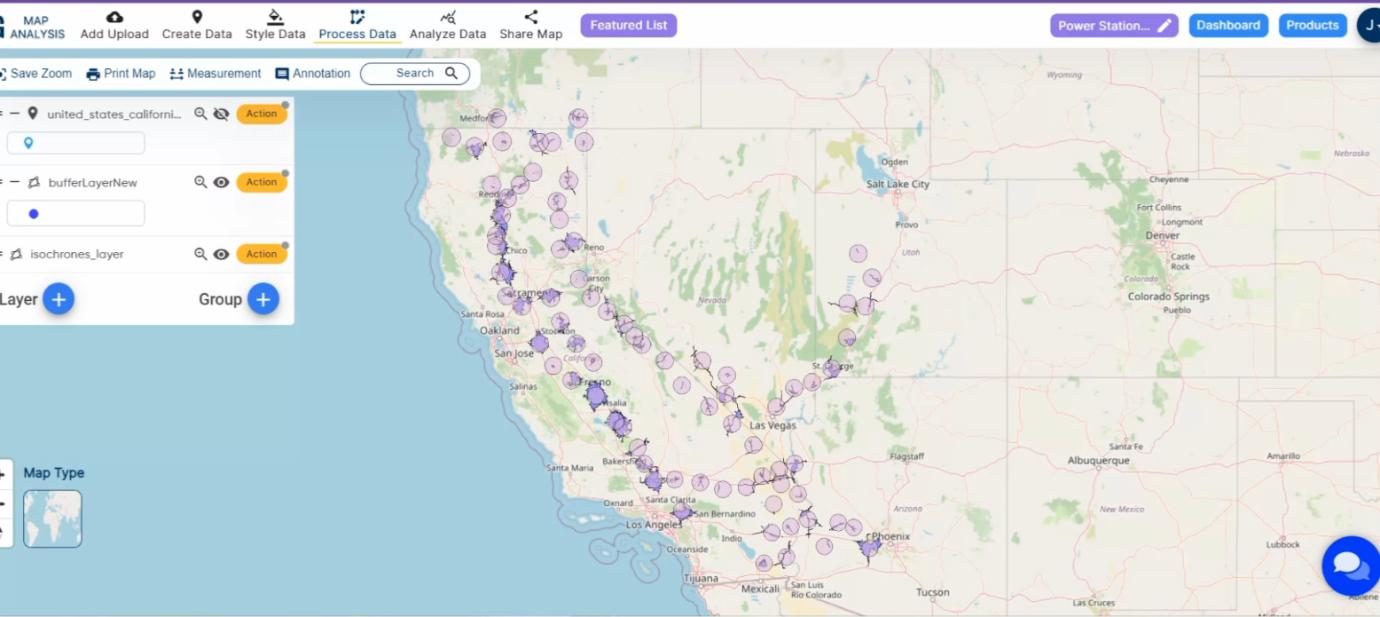
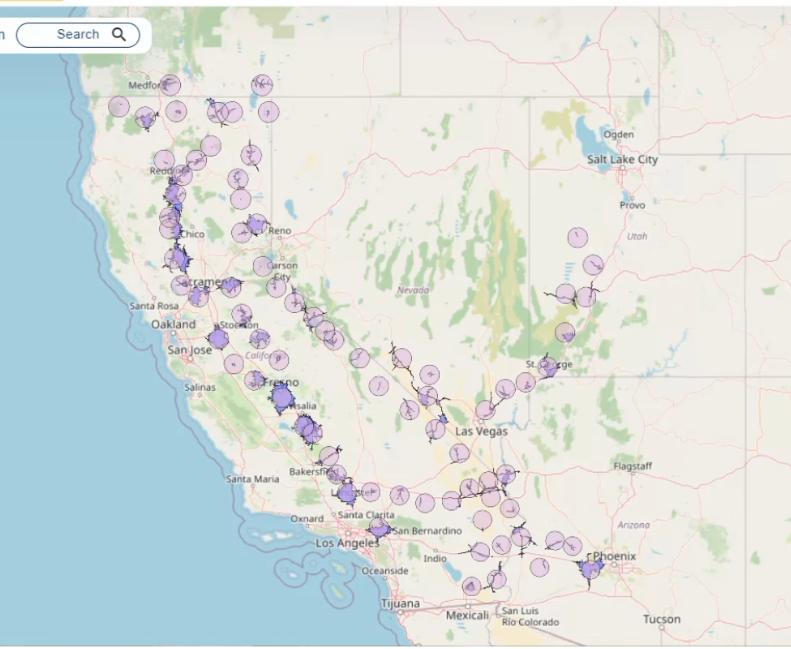
Result and Analysis: The result is a meticulously crafted map that vividly displays the spatial distribution of power stations, their impact zones, and accessible areas within defined timeframes. This visual representation facilitates a deeper understanding of the existing power infrastructure in the United States, with a granular focus on California, laying the foundation for strategic decision-making in real estate development.
Finding with Points:
Optimal Site Identification: GIS mapping facilitates the identification of optimal development sites in California based on their proximity to existing power stations in the United States. Developers can pinpoint locations that align with their project goals and benefit from reliable power infrastructure.
Quantitative Analysis: Through GIS tools, developers access quantitative data on travel times to and from power stations, enhancing the precision of site selection. The analysis goes beyond visual representation, providing numerical insights crucial for decision-making.
Impact Area Assessment: Buffers around power stations visually represent their impact areas in California, allowing developers to assess the reach and influence of each station. This assessment aids in understanding the potential scope and scale of development projects in relation to power infrastructure.
Accessibility Metrics: Isochrones depict areas reachable within specific travel times, offering developers a comprehensive view of accessibility in California. Metrics such as the size and shape of isochrones contribute to evaluating the convenience and connectivity of potential development sites.
Strategic Decision-Making: Armed with detailed findings, developers can make strategic decisions regarding the placement of residential, commercial, or industrial developments. GIS mapping ensures that decisions are not only visually informed but backed by data-driven insights, reducing risks and enhancing project success.
Infrastructure Integration: Developers can seamlessly integrate power stations into their project plans in California, considering the impact areas and accessibility metrics provided by GIS mapping. This integration ensures that developments align with existing infrastructure, contributing to a more cohesive and sustainable urban environment.
Risk Mitigation Strategies: GIS mapping aids in identifying potential risks by visualizing environmental features and impact areas around power stations. This insight allows developers to implement effective risk mitigation strategies, ensuring the safety and resilience of their projects.
Community-Centric Development: The analysis of power station locations and accessibility metrics supports community engagement initiatives in California. Developers can communicate transparently with local communities, addressing concerns and ensuring that development projects enhance the overall quality of life.
Conclusion: the findings derived from GIS mapping in power station analysis and site selection, focusing on a dataset covering the United States, with emphasis on California, empower real estate developers with a wealth of insights. From optimal site identification to risk mitigation and community-centric development, the points above underscore the multifaceted benefits of leveraging GIS tools in the dynamic realm of real estate development.