GIS for Heat Island Reduction enables smart mapping to analyze temperature variations identify heat-prone areas, and optimize green spaces. It supports strategic tree planting, reflective surfaces, and heat-resistant materials. GIS-driven data aids urban planners in designing cooler, sustainable cities with improved land use, reducing heat retention and energy consumption.
Key Concept: GIS for heat island reduction
Smart mapping helps reduce urban heat islands by identifying heat-prone areas, optimizing green space distribution, and guiding reflective material placement. It enables data-driven decisions for tree planting, cool roofs, and urban planning. GIS analysis supports sustainable development, lowering temperatures, reducing energy consumption, and improving urban resilience against climate change.
Use of GIS in Reducing Urban Heat Islands using smart mapping
- Heat Mapping & Analysis – GIS identifies urban heat islands by analyzing temperature patterns, land cover, and surface materials, enabling targeted cooling strategies.
Optimized Green Space Planning – Smart mapping helps in strategically placing parks, trees, and green roofs to enhance cooling and reduce heat absorption. - Infrastructure & Material Planning – GIS guides the placement of reflective roofs, cool pavements, and water bodies to lower surface temperatures.
- Monitoring & Policy Making – GIS supports data analysis for adaptive urban planning, ensuring sustainable, heat-resilient city development.
Process for using smart mapping to create urban heat islands
1. Start by collecting Information
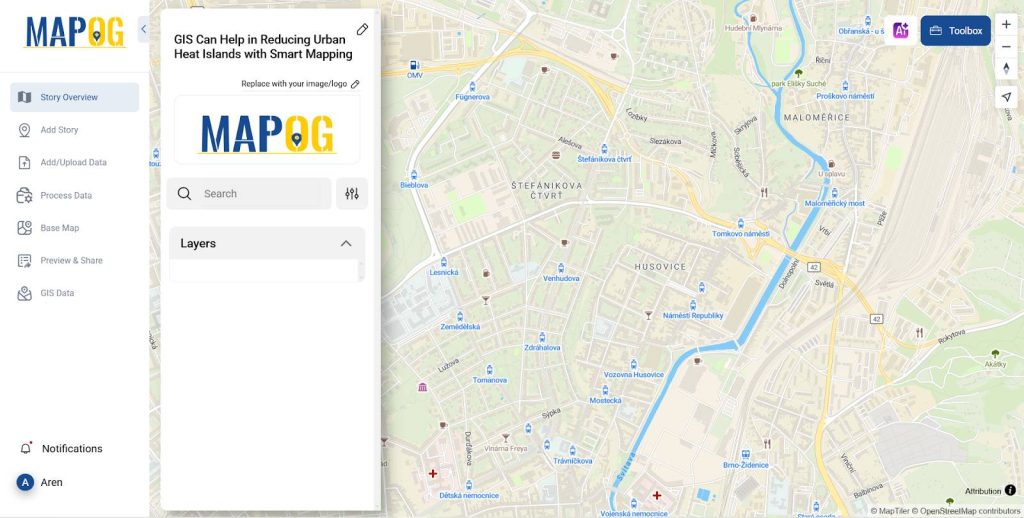
- Start by compiling all required information from the MAPOG website.
- Additionally, you can utilize pre-existing data sources like GIS data library in MAPOG for collecting the information.
2. Upload Boundary Layer
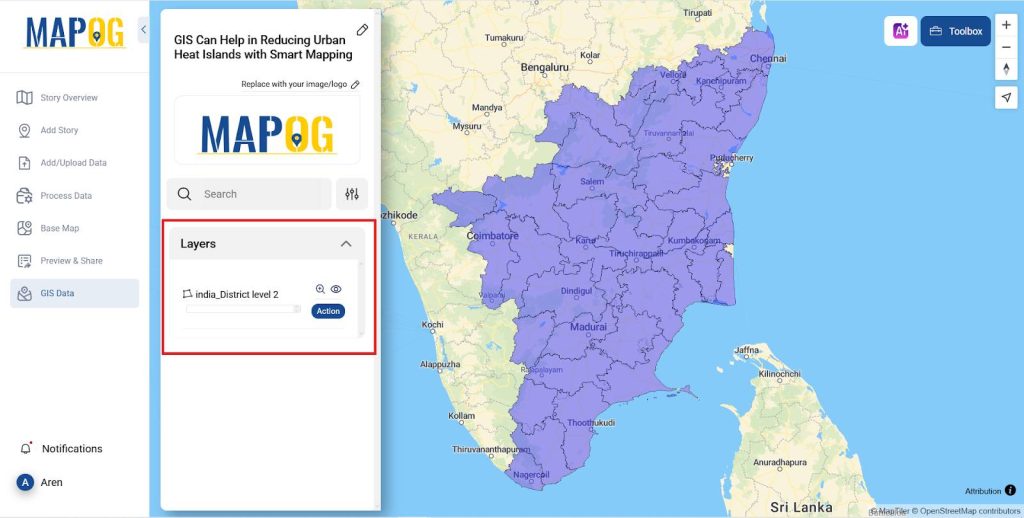
- For improved mapping, upload the district border file from GIS data to the map and change its opacity in style layer.
- By selecting GIS data >> Select the Country >> Select the State >> District Level 2 >> click on add to map to add the layer to the map.
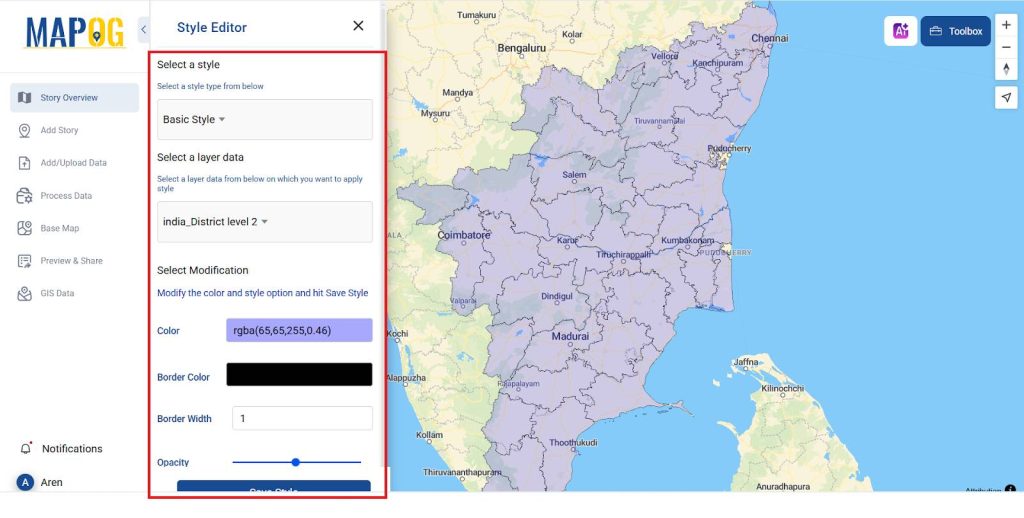
- After adding the map to decrease its opacity go to Action >> Style Editor
What is an urban heat island?
Urban heat islands (UHIs) occur when cities experience higher temperatures than surrounding rural areas due to concrete, asphalt, and reduced vegetation, which absorb and retain heat, exacerbating energy consumption and climate effects.
3. Upload Population and Temperature Attribute
- To upload the temperature and population details upload the district border file from GIS data and in attributes add the details.
- By selecting GIS data >> Select the Country >> Select the State >> District Level 2 >> click on add to map to add the layer to the map.
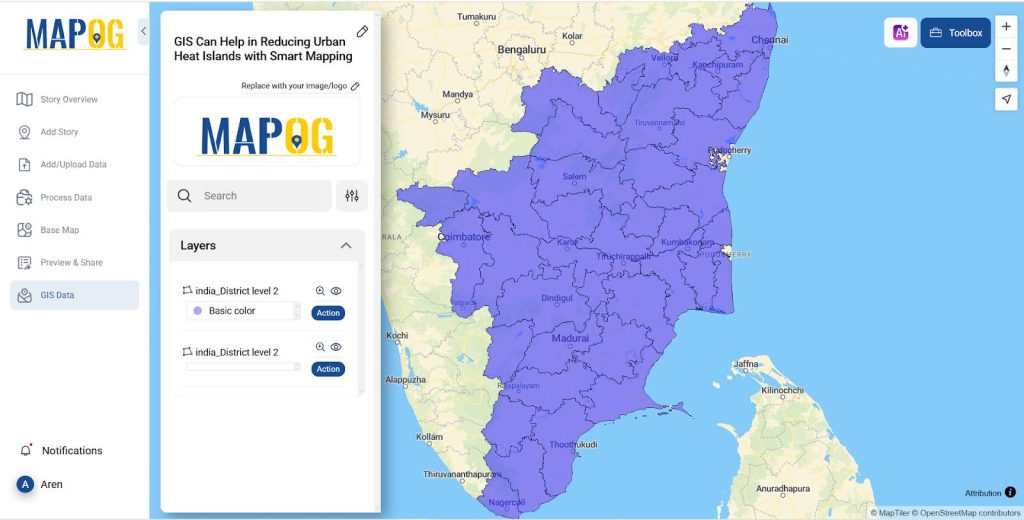
- To add population and temperature data click on Action >> Edit attribute table.
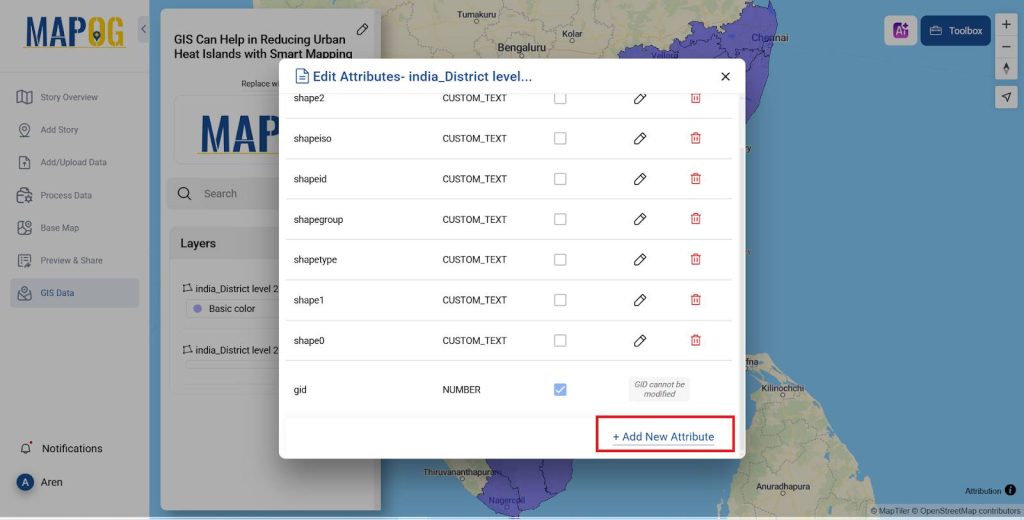
- Add two attributes named Population Density and temperature and their type as Number.
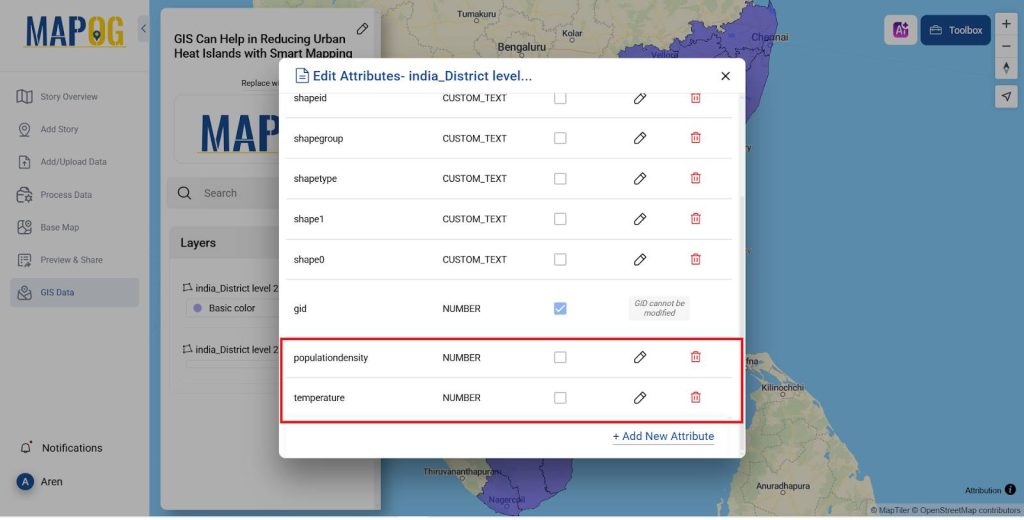
4. Upload Temperature and population Details
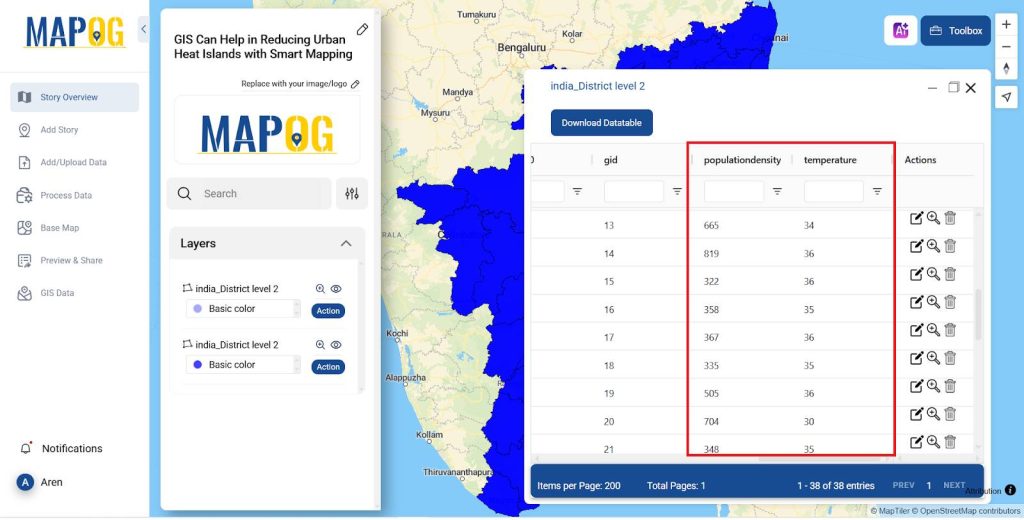
- To add population and temperature data click on Action >> Show attribute Layer.
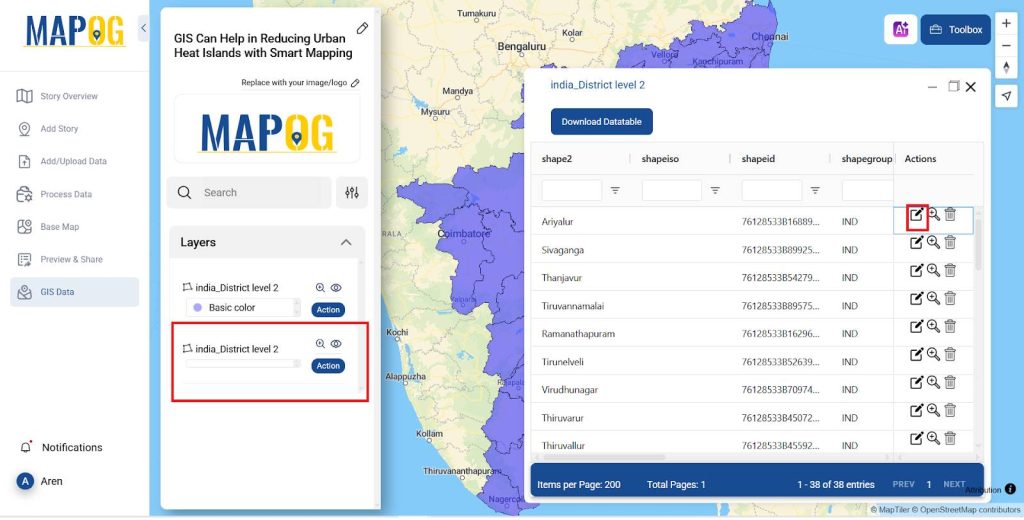
- Edit it for each district and add the details like Population Density and the temperature as shown in the image below.
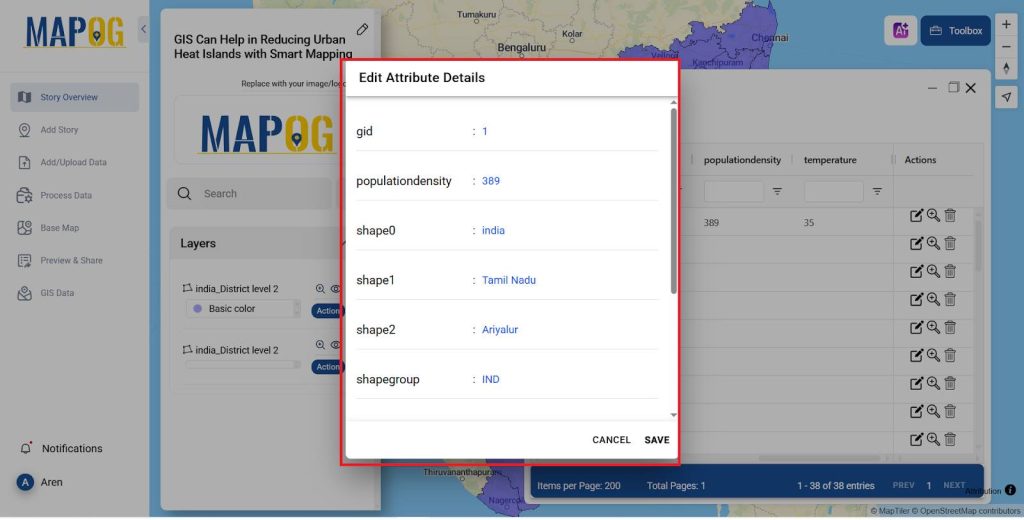
- Similarly add the details for all the districts in the attribute table.
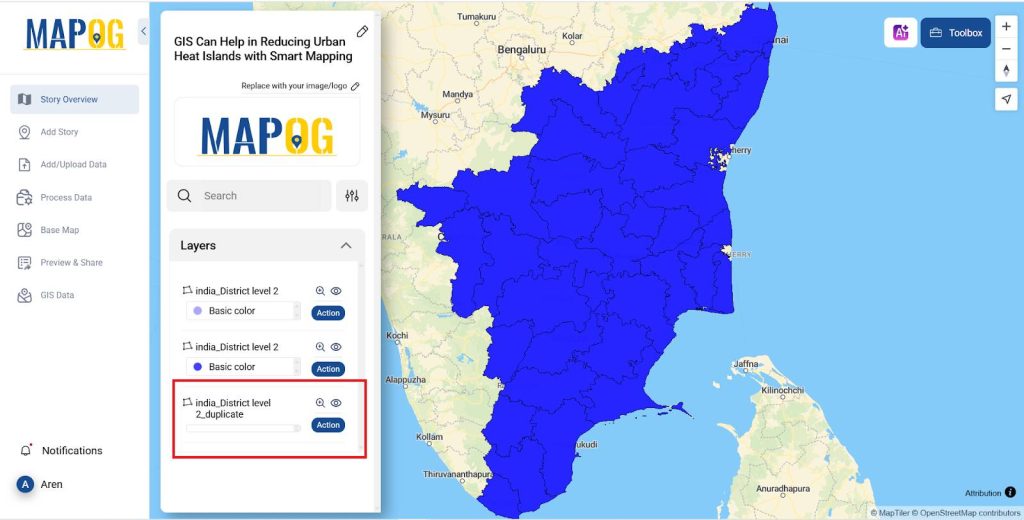
- And once all the data is added you can duplicate the layer by Action >> Duplicate Layer.
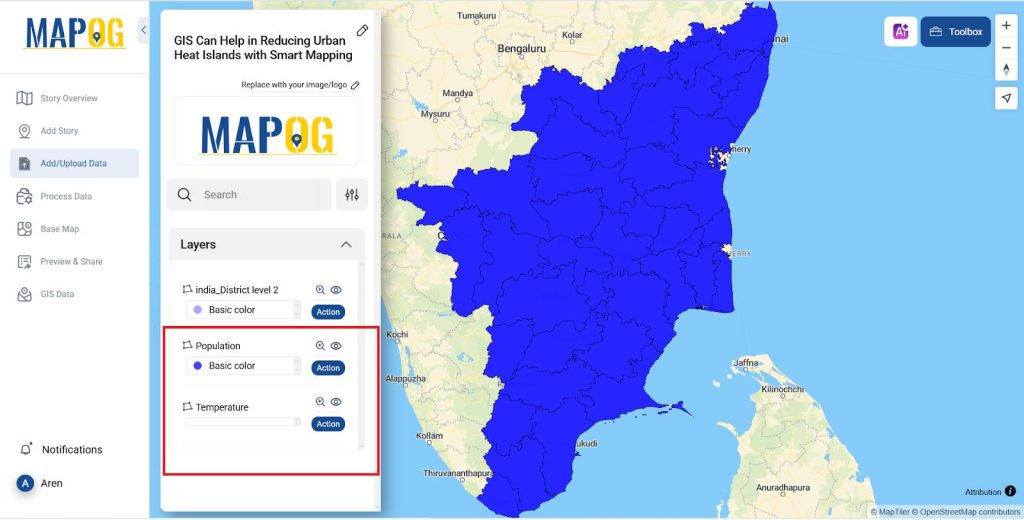
- Now change the name for both the layer one as Temperature and the other one as Population by clicking the Action >> Rename layer.
5. Mapping Population and Temperature
- Now Style the map for the temperature and Population individually.
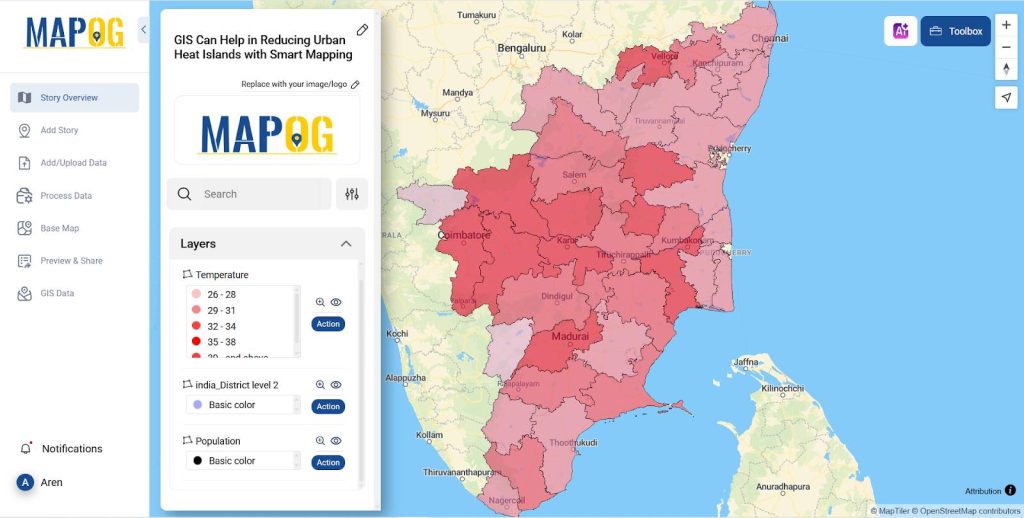
- For temperature in Action >> Style layer give the style as quantity and the layer as temperature and attribute as temperature and 5 parts and select save style.
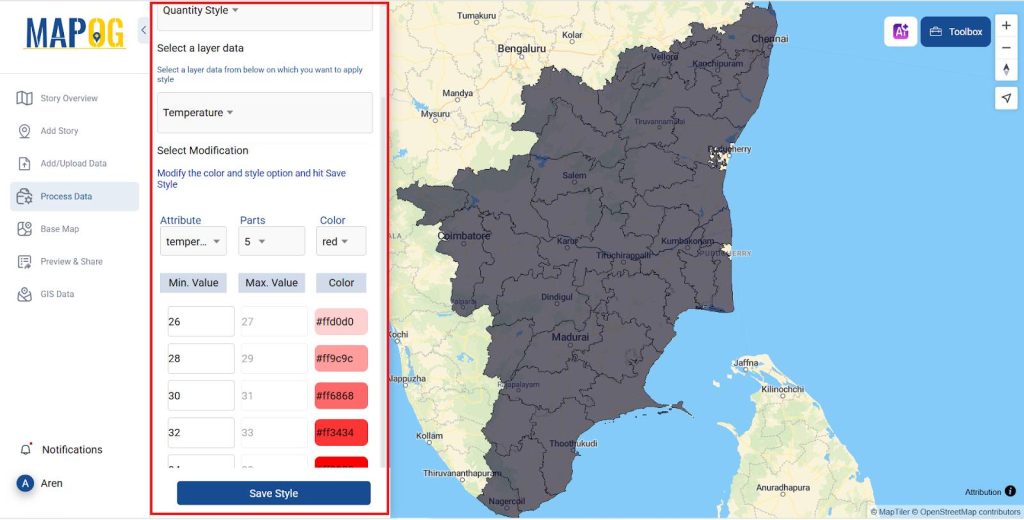
- The generated map has been displayed below.
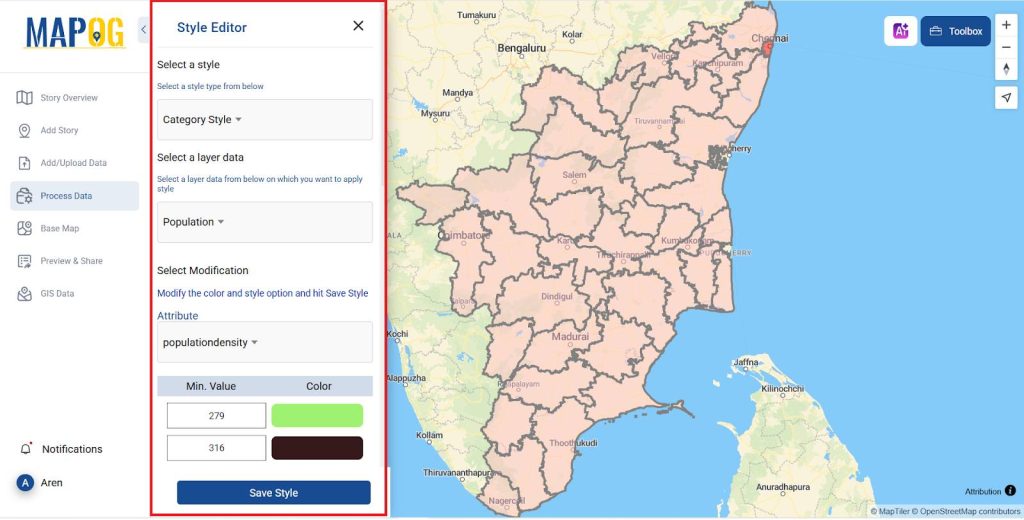
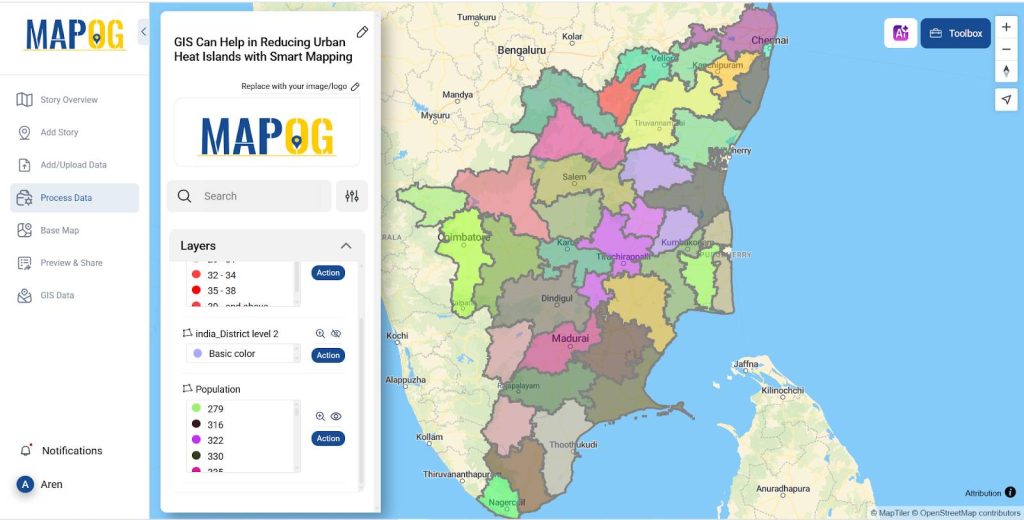
- For population in Action >> Style layer give the style as category and the layer as population and attribute as population and select save style.
- The generated map has been displayed below.
6. Analyze and Disseminate
- Once your map is constructed, just overlay all the layers created.
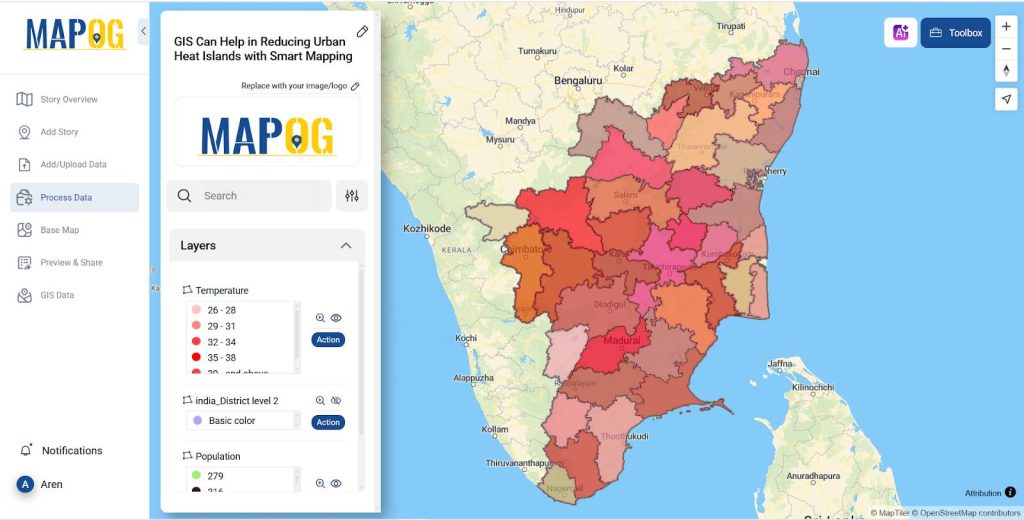
- GIS-based comparison of temperature and population density reveals a strong correlation between urban heat islands (UHIs) and highly populated areas.
- Darker the district is the higher population densities often correspond to increased land surface temperatures due to urbanization, reduced vegetation, and heat-retaining materials.
- GIS enables spatial analysis for targeted mitigation strategies and sustainable urban planning.
Principal Results in Site Selection
Smart mapping in GIS helps mitigate urban heat islands by identifying heat-prone areas, optimizing green space distribution, and guiding the use of reflective materials. It enables monitoring, supporting data-driven decisions to reduce heat retention, lower energy consumption, and improve air quality. GIS also aids in sustainable urban planning by integrating cooling strategies like green roofs and tree planting. This approach enhances urban resilience, mitigates health risks, and creates more livable, climate-adaptive cities.
Industry and Domain
- Urban Planning & Environmental Management
- GIS helps city planners and environmental agencies identify heat-prone areas, optimize green spaces.
- And implement cooling strategies like tree planting and reflective surfaces to reduce urban heat islands.
- Energy & Infrastructure Development
- GIS supports sustainable infrastructure planning by guiding the placement of energy-efficient buildings.
- It also cools pavement, and smart transportation systems, reducing heat retention and improving overall urban resilience.
GIS data Used
Conclusion
GIS with smart mapping helps reduce urban heat islands by identifying heat-prone areas, optimizing green spaces, and guiding cooling strategies. It supports sustainable urban planning, reducing heat retention, energy consumption, and environmental impacts.
An open-source online map-making tool
A flexible, open-source program called MAPOG was created to make it simple for users to build interactive maps. And particularly for Smart Mapping Helps in Reducing Urban Heat Islands. Smart mapping identifies heat-prone areas, optimizes green spaces, and guides cooling strategies, reducing urban heat islands and promoting sustainable, livable cities. Many of the articles listed below were created with MAPOG.
- How to Use Convex Hull for Contagious Disease Mapping & Outbreak Control.
- Isochrone Analysis in GIS: Optimize Travel Times for Faster Delivery & Urban Planning.
- How to Geocode Excel Data and Create an Interactive Map (Step-by-Step Guide).
- Creating Point Data for Urban Planning: Digitizing Settlement Features & Infrastructure Mapping.
Final thoughts
MAPOG is a simple tool for smart mapping that identifies hotspots, optimizes green spaces, and guides cooling solutions such as reflective surfaces and tree planting. Thereby minimizing urban heat islands, lowering temperatures, improving air quality, and increasing urban sustainability.