Natural resources are the cornerstone of a nation’s wealth and prosperity, but their exploration is a complex process. One crucial aspect of successful exploration is the systematic collection of geological and geochemical data across target areas. Grid sampling is one of such sampling processes. This article explores how MAPOG can be leveraged for mapping strategies for effective grid sampling, offering a structured approach to mineral exploration, enabling efficient data collection, analysis, and decision-making.
Key Concept
The Grid tool in MAPOG helps to create a grid or lattice of evenly spaced cells with customised size over a geographical area. Leveraging this tool, we can create grid cells over our target area having required size which aids in grid sampling. A map thus created in MAPOG can be used as a guide during a sampling survey, which ensures systematic coverage and uniform distribution of sampling points across the entire area and helps to allocate sampling points within each grid cell.
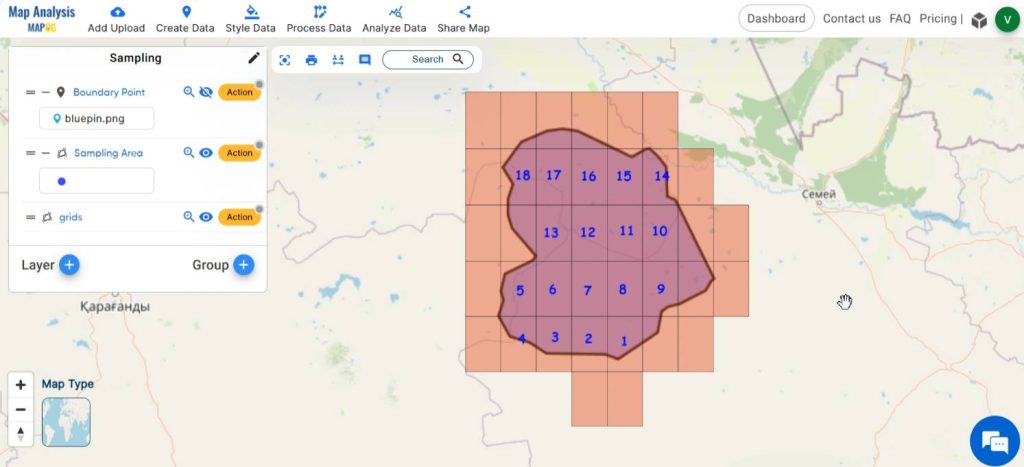
Follow the below process Step-by-step for creating map for grid sampling
Step 1:Open Map Analysis
Open Map Analysis interface from MAPOG platform.
Step 2: Define boundary points
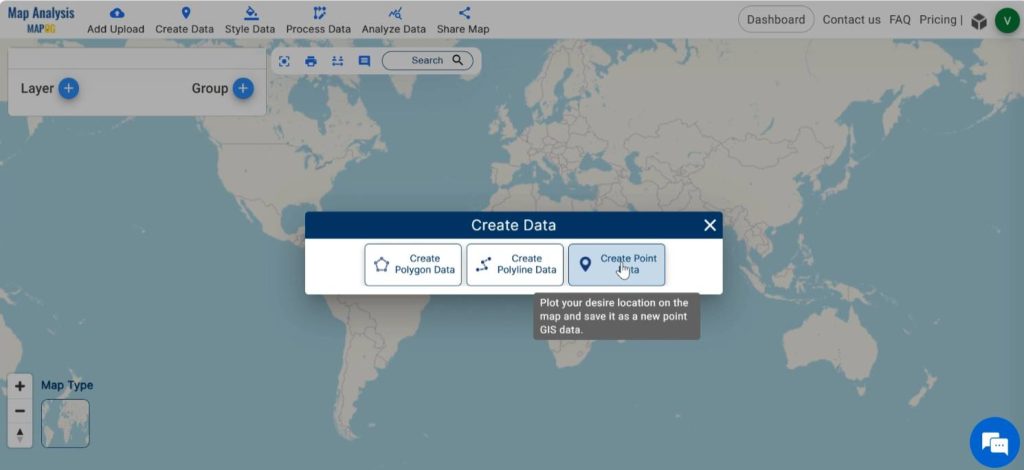
At first step we have to define the boundary of our survey region. For keeping the precision of our survey, we can do this by plotting the boundary points of the region using the latitude and longitude of the boundary area of the survey region. Click on Create data and then select Create Point Data.
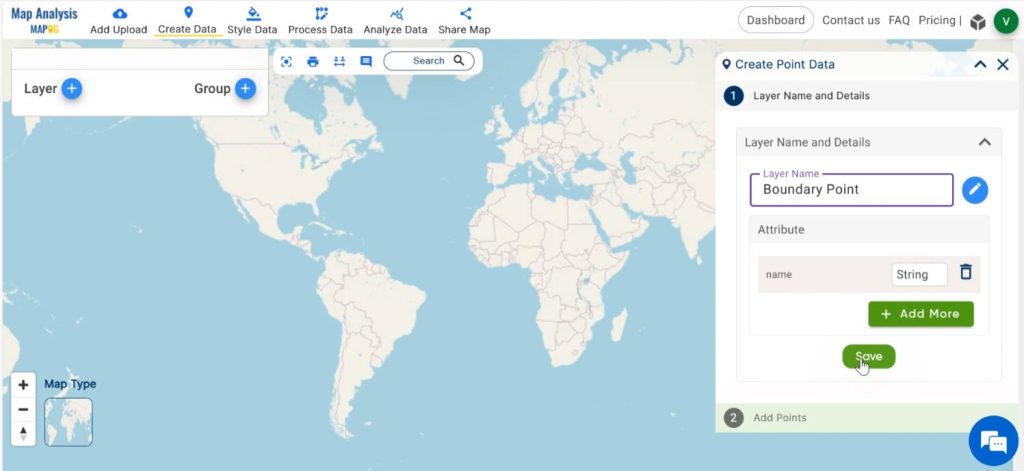
Save the point layer with a suitable name and add necessary attributes for the point layer.
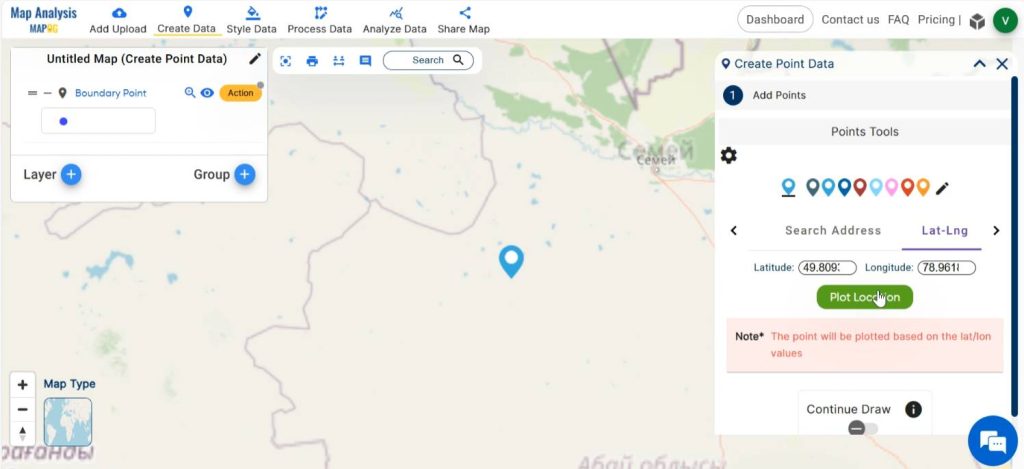
We have three options for adding points in MAPOG. They are dropping a point on the map, add points using the address of a location and add points using latitude-longitude of the location. In this case, we are adding points using the latitude and longitude of the boundary points. Enter the latitude and longitude data and click on “Plot Location”. The point is plotted in the map.
Do the same for all boundary points. Now, all the boundary points are plotted in the map.
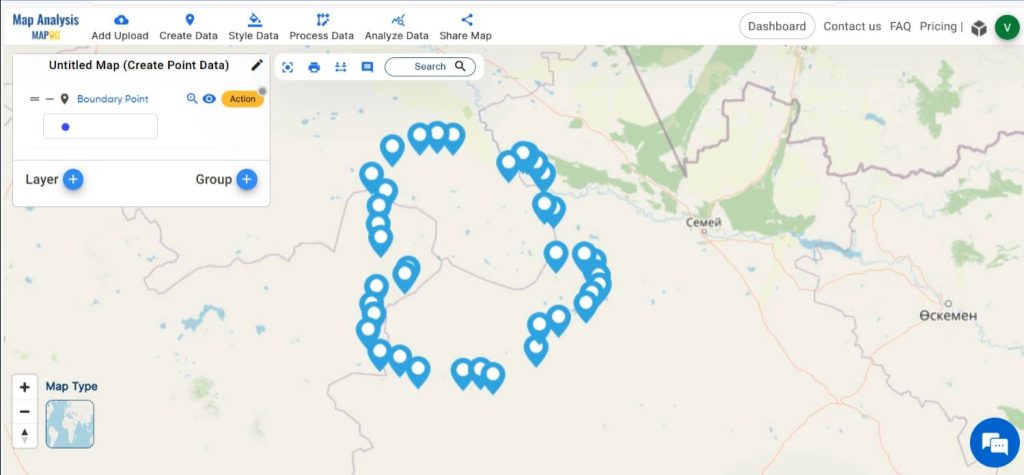
Step 3: Save your Map
Save your map with a suitable name by clicking on the pencil icon seen near the “Untitled Map” text.
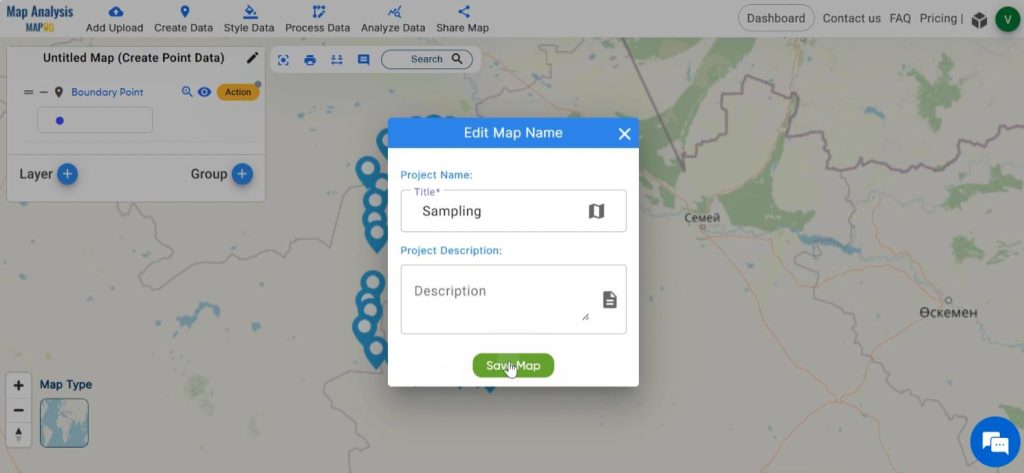
Step 4: Delineate Survey area
Next, we can trace out our survey area precisely from the boundary points. For doing this, click on Create data and select Create Polygon Data.
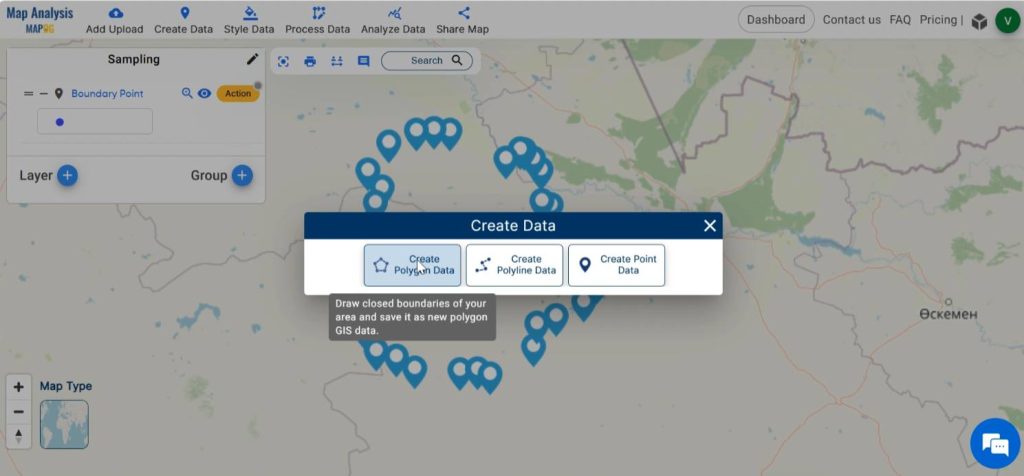
Give a suitable name and add attributes for the polygon layer and save it.
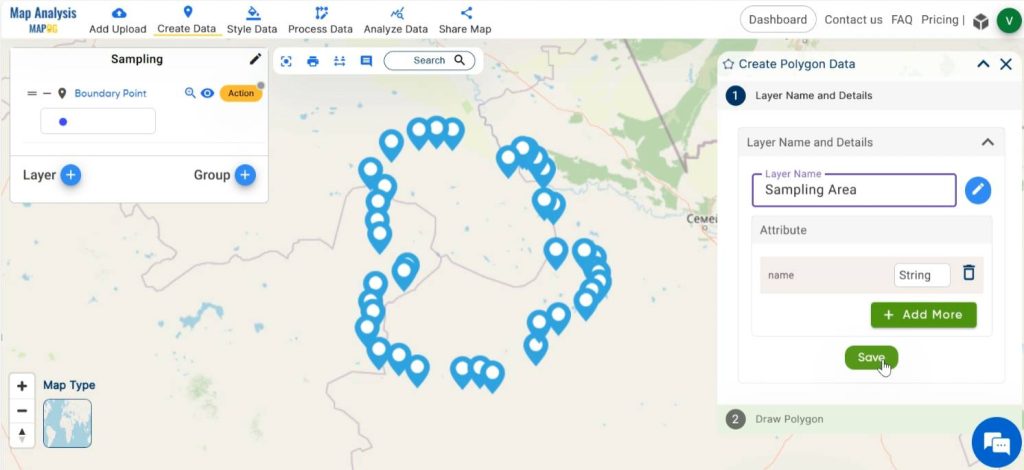
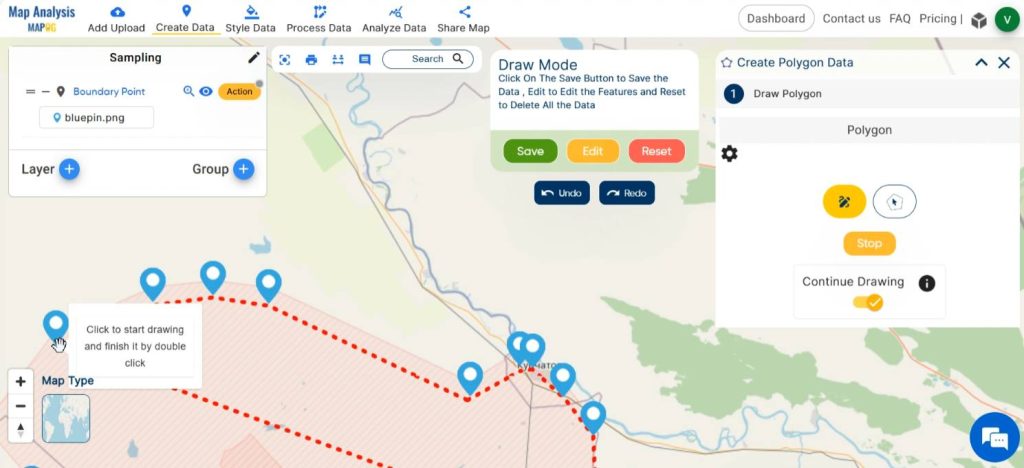
By enabling any of the icons in the dialogue box, draw a polygon by joining all the boundary points to delineate our region. Now, we have traced out our survey region.
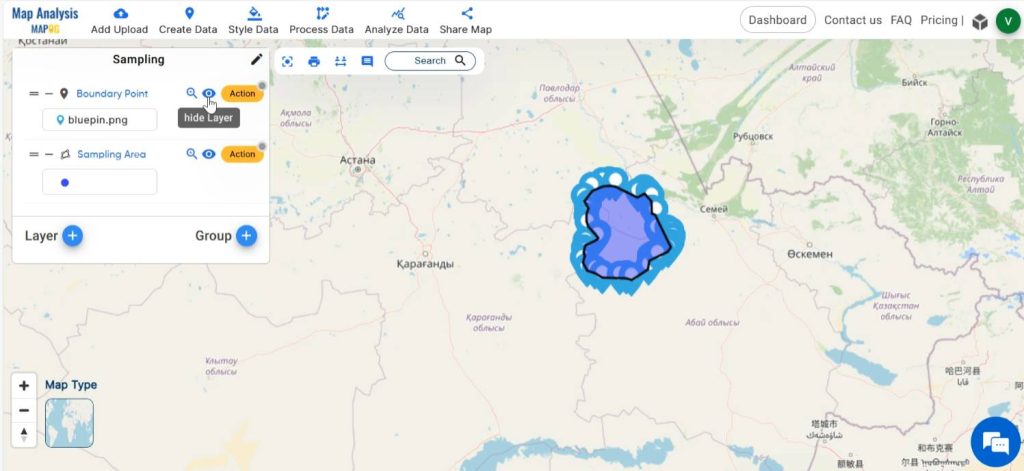
For a better visual presentation, hide the boundary point layer.
Step 5: Create grid
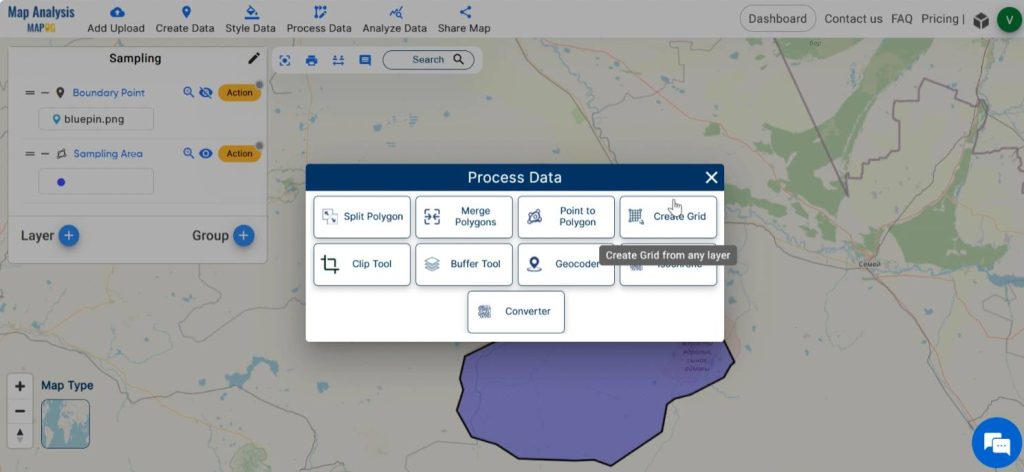
Now, we can divide our region into grids of definite size for creating the guide map for grid sampling. For this, click on Process Data and select Create Grid.
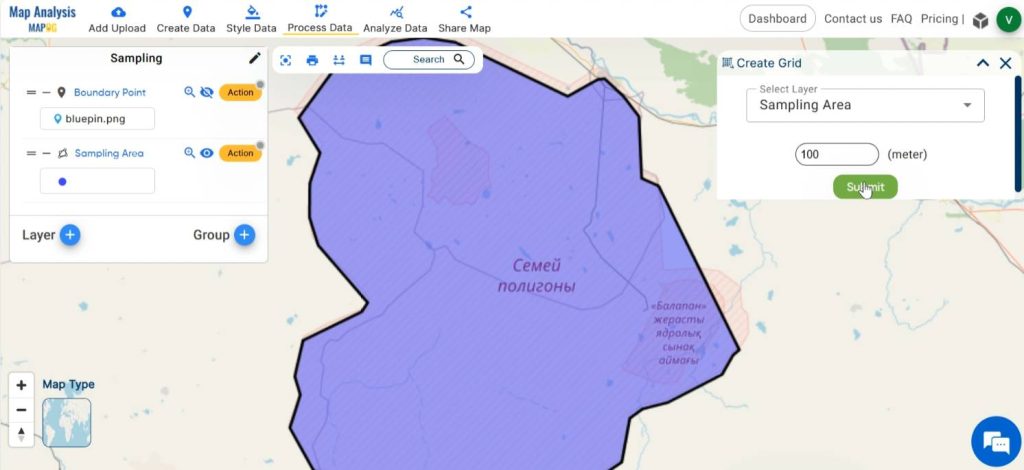
Select the polygon layer and enter the appropriate range defining the size of each cell in the grid. Click on submit.
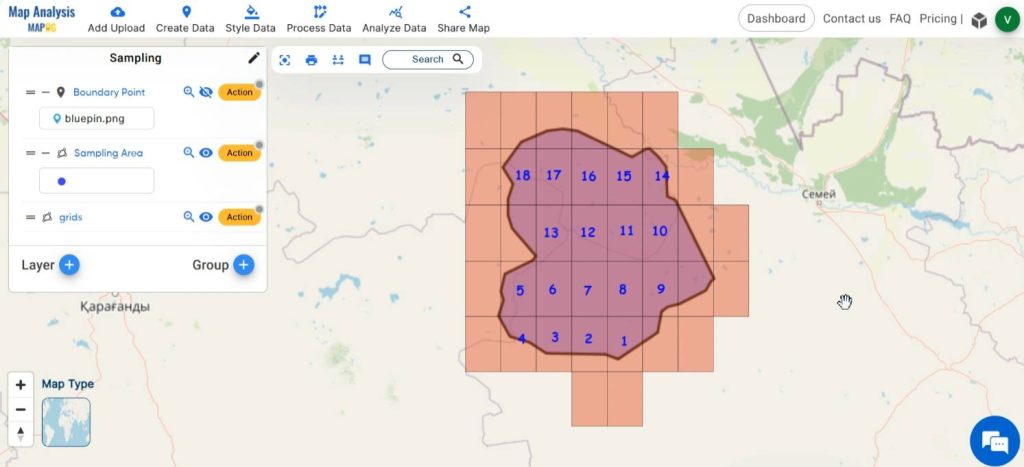
Now the grid is created.
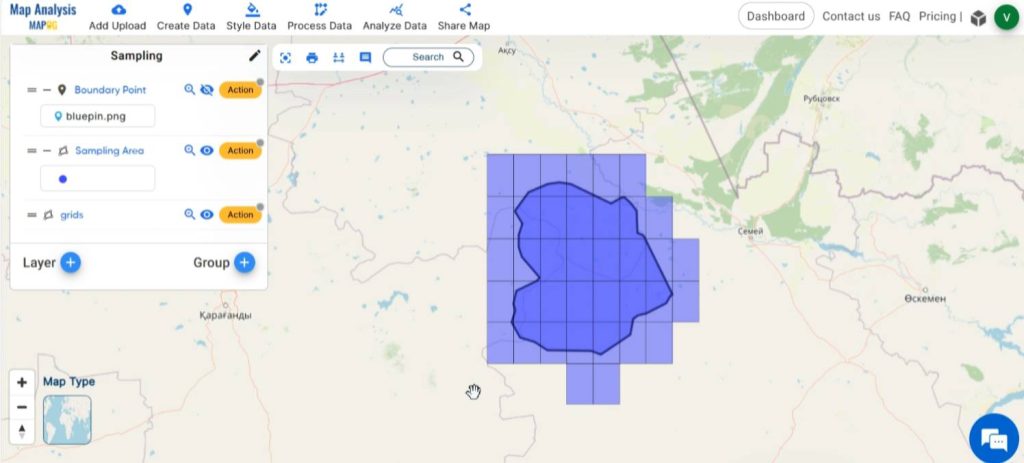
Step 6: Annotate grid cells
Select Annotation tool, followed by Text. Click on a cell and enter the number of the cell. Now the cell is annotated with a number.
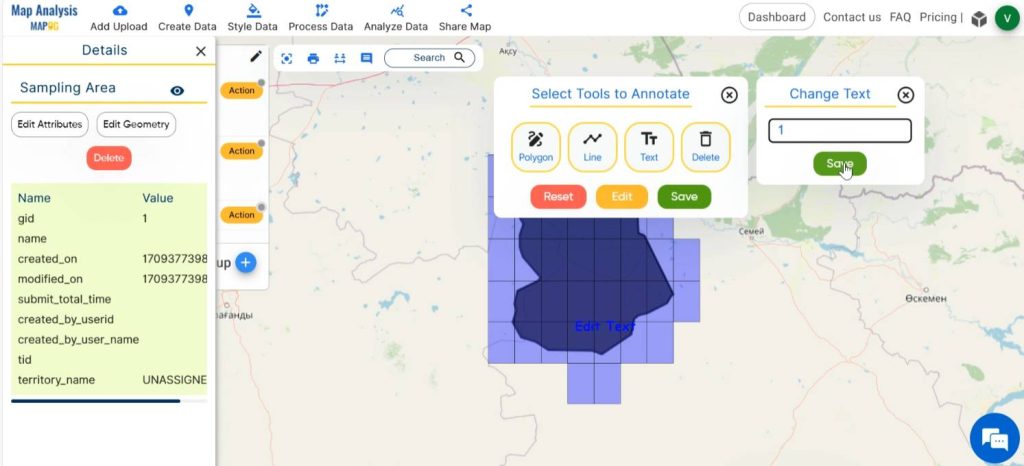
Repeat the same for all the cells in the grid.
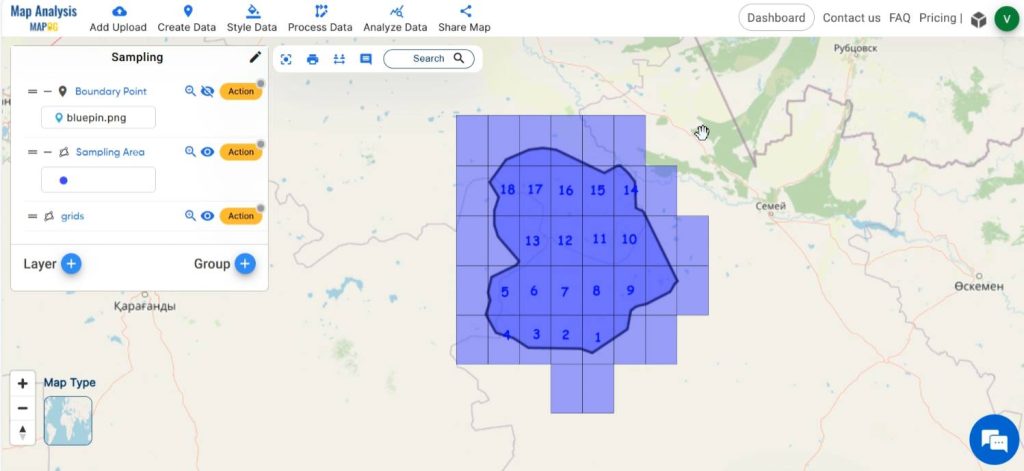
Step 7: Style the grid
Select the Basic style option from the Action or click on Process Data, then select Basic Style and select the grid layer. Customize the cell with suitable colors for enhancing visual clarity and understanding.
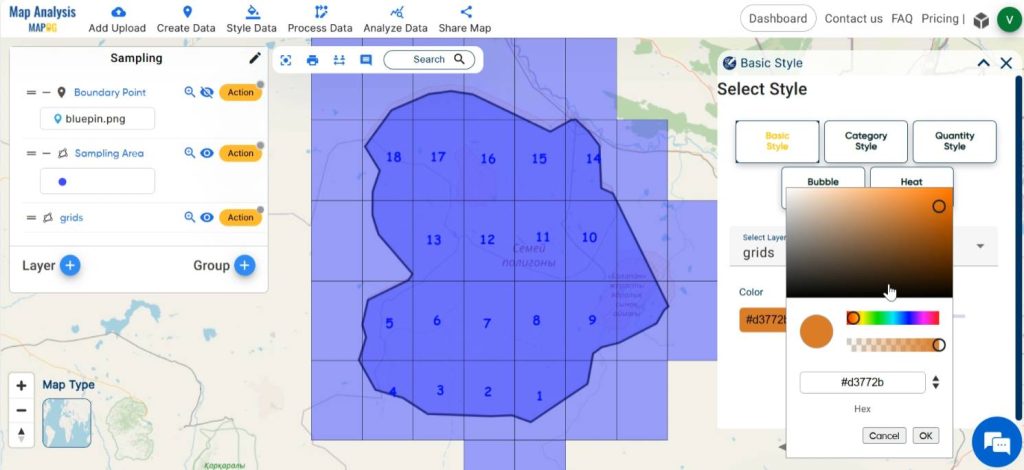
Finally, we have got a map in which our survey area has been divided into grids of required cell sizes.
Step 8: Share Map
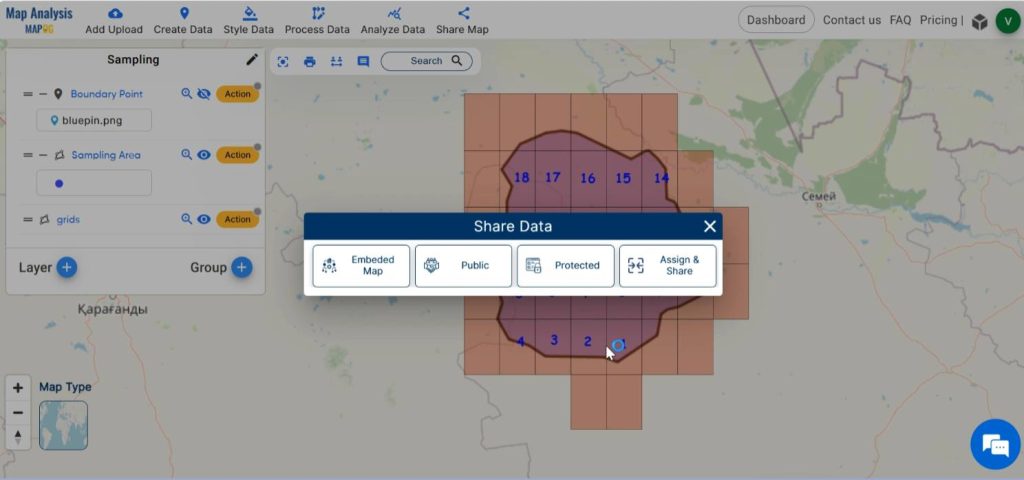
Using the Share tool, share the map or post it on social media.
Major Findings
The grid sampling map created using MAPOG offer numerous benefits for various applications, including:
- Systematic coverage: This map ensures the sampling points are evenly distributed across the area, providing a representative sample.
- Sampling Point allocation: Maps can be utilized to allocate sampling points within each grid cell. Researchers can visually identify suitable locations for sampling.
- Navigation: Maps serve as navigation aids during fieldwork, guiding surveyors to designated sampling points.
- Monitoring and management: Grid sampling maps serve as valuable tools for monitoring changes in environmental conditions over time and assessing the effectiveness of management practices.
- Communication: Maps are often more accessible and easier to understand than raw data tables, making them an effective communication tool.
Domain and Industry
- Farmers and Agricultural professionals: Grid sampling allows farmers to precisely target areas for fertilization and irrigation, thus improving crop yield.
- Environmental organizations: Helps to identify areas with high ecological value or vulnerability, facilitating targeted conservation efforts.
- Infrastructure Developers: Grid sampling assists in evaluating the suitability of land for various urban development projects.
- Policy makers: This map provides policymakers with accurate spatial data on soil properties, land use, and environmental conditions, facilitating evidence-based policy formulation.
- Research Institutions: Aids researchers a systematic approach to collecting spatial data for scientific studies.
Conclusion
Grid sampling, coupled with MAPOG, offers a powerful approach to exploration enabling systematic data collection, analysis, and decision-making. By leveraging the spatial capabilities of MAPOG, exploration companies and various organisations can streamline exploration workflows, improve target identification, and enhance the efficiency and sustainability of resource development.