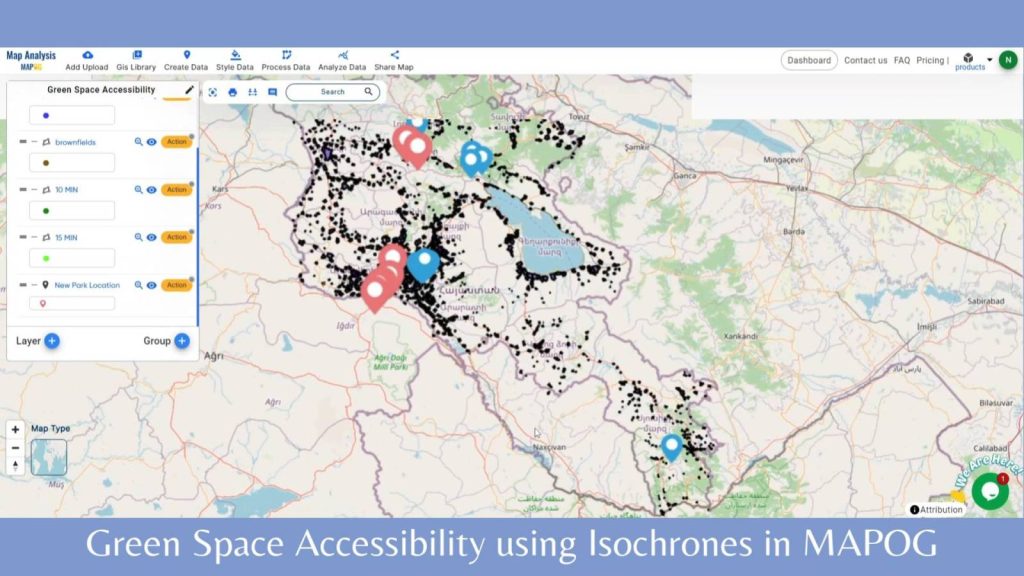
In “Green Space Accessibility using Isochrones in MAPOG, we utilize isochrone maps to evaluate and improve access to green spaces. This approach helps identify areas with limited accessibility and guides urban planning efforts to enhance community well-being.
Key Concepts
By using isochrones in MAPOG, we can analyze and optimize the accessibility of these green spaces, ensuring that urban planning efforts promote equitable access for all community members.
Steps to create Green Space Accessibility using Isochrones
Step 1: Add Data
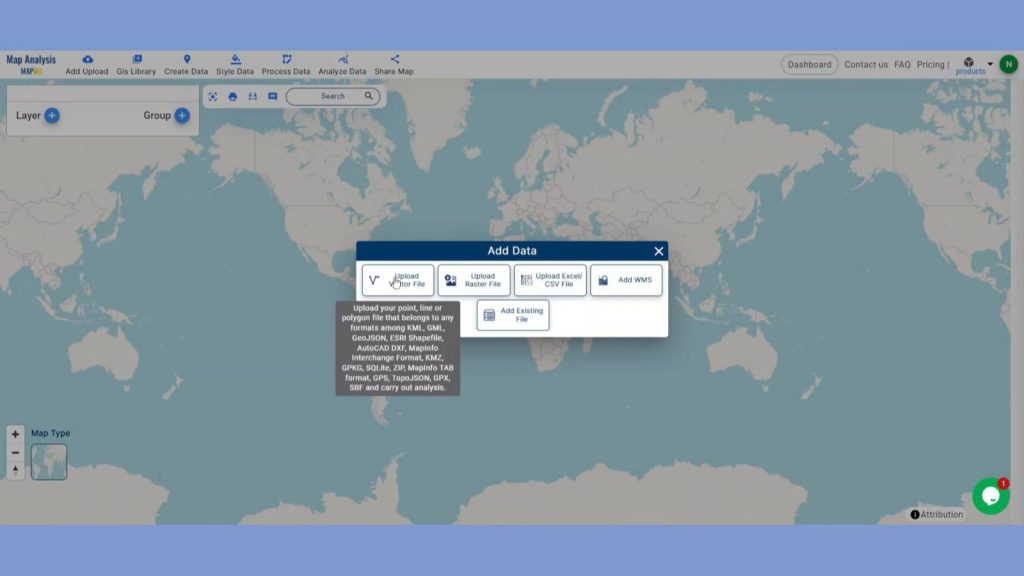
First, navigate to the Map Analysis interface. Then click on the “Add upload” button in the upper left corner. A dialogue box will open. Click on “Upload Vector File” to add data.
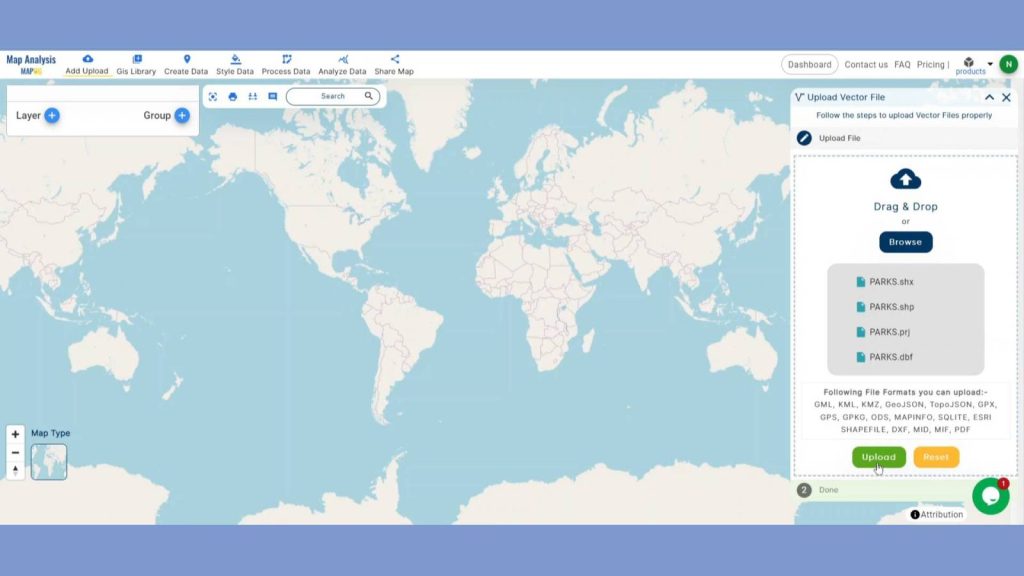
A box will open on the right side of the screen, select Browse option to browse the existing park locations data & click Upload to upload the data.
Then click on the GIS Library button in the upper left corner. A dialogue box will open. Their search for your desired country and add the residential land use data & brownfields data.
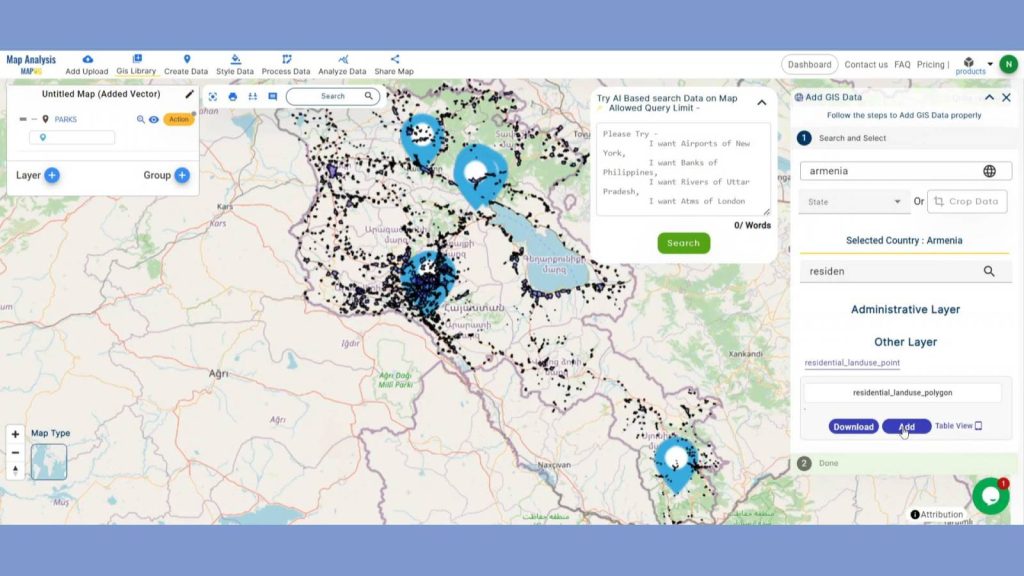
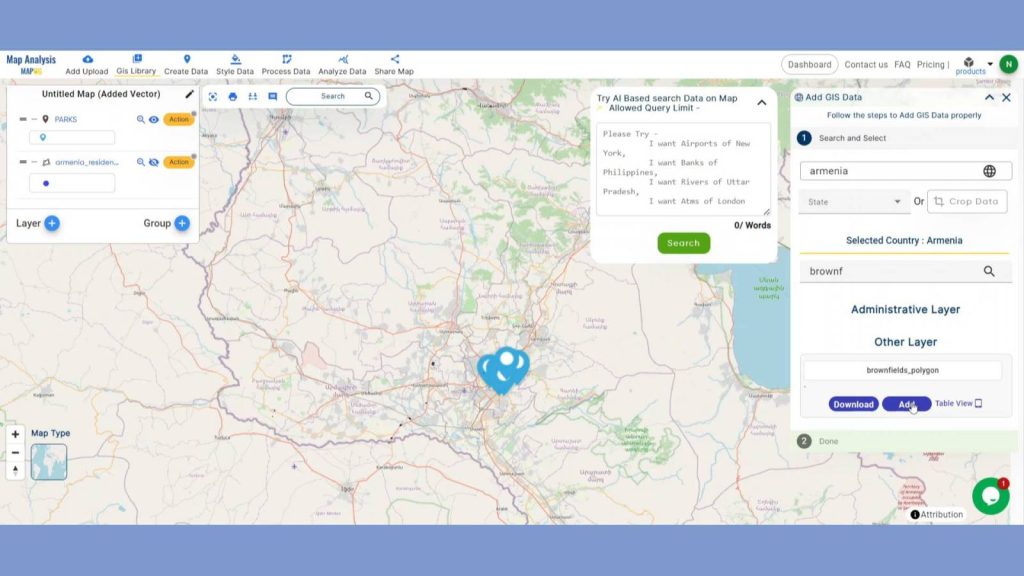
After adding those layers, rename them.
Step 2: Save Project
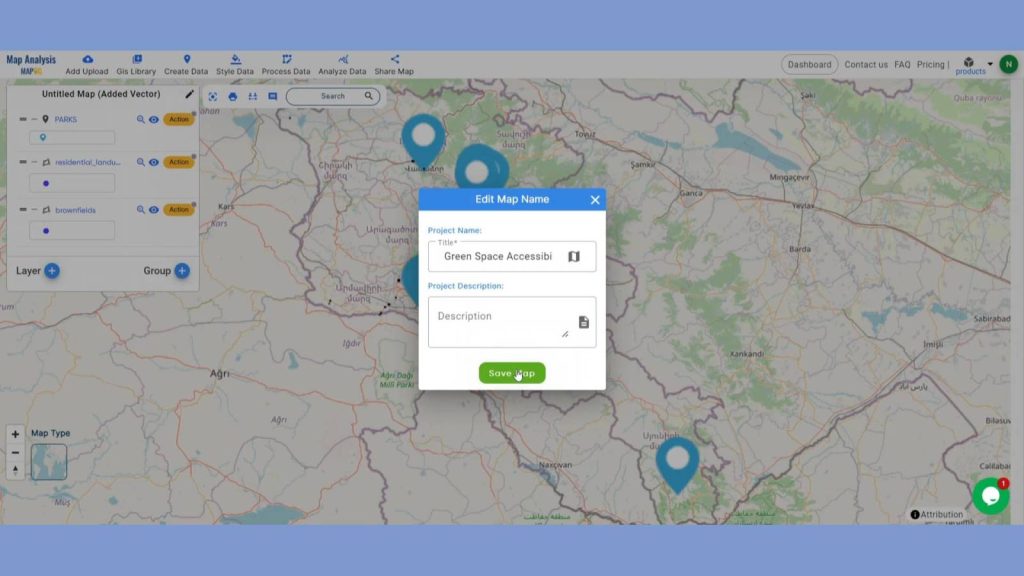
Now, click on the pencil icon situated right after the “Untitled Map” text to save the project. In the dialogue box write proper name and description that describe the project accurately. And click on save map option. Your project will be saved.
Step 3: Isochrones Generation
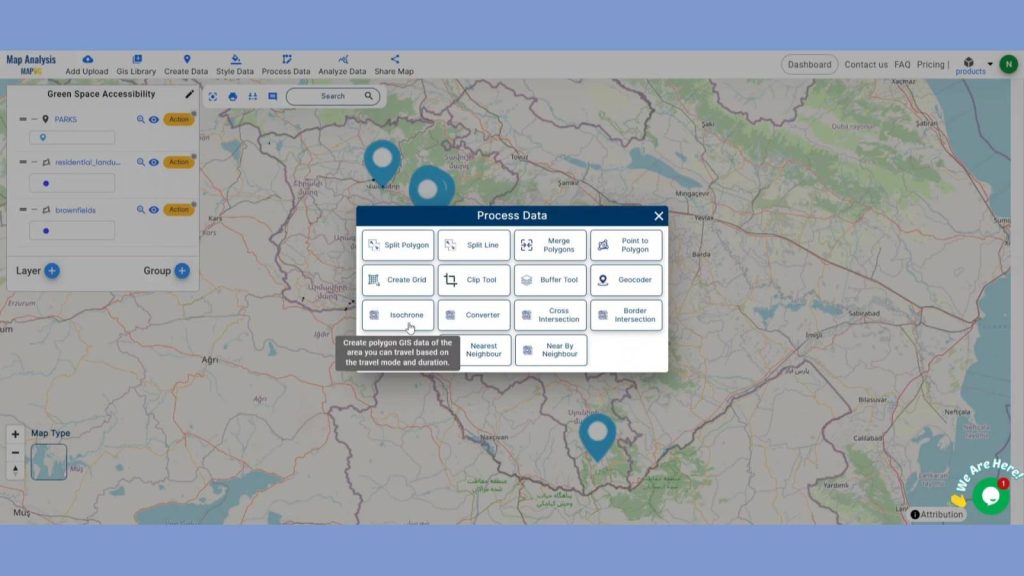
We will now evaluate the current reach of existing green spaces in terms of travel time for residents. Click on the isochrones option using the Process data option in the header.
Learn how isochrones and proximity analysis are used in “Mapping Village Coverage within 60 Minutes of Each Hospital” to improve healthcare accessibility and guarantee timely medical aid for rural communities.
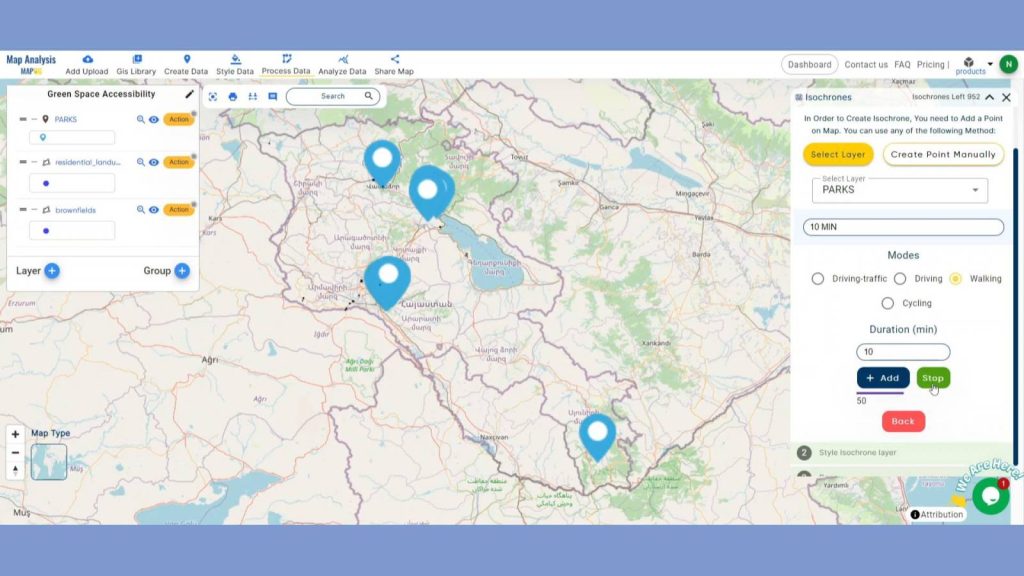
Next in select layer option select the existing park and after that select the duration time as 10 minutes and mode as walking and your isochrones will be prepared.
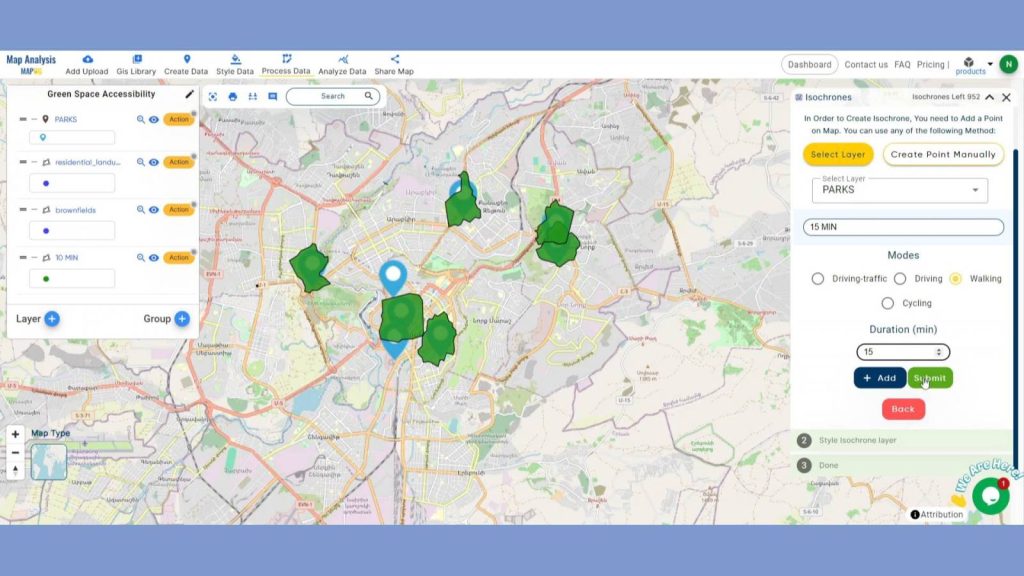
Next in the same way I’ll be creating second isochrone of 15 minutes. Provide suitable colors to them.
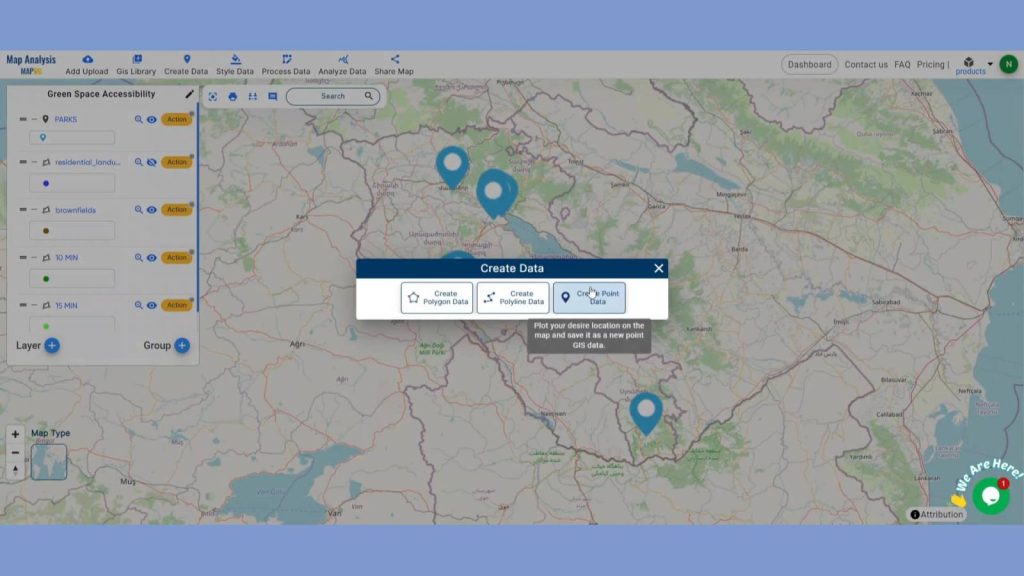
Step 4: Recommendations of New Locations
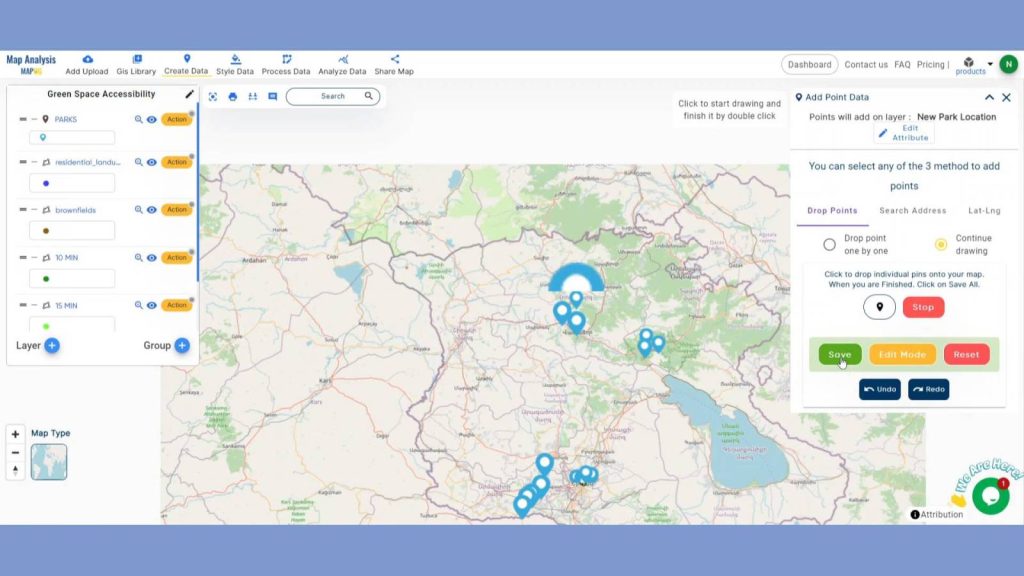
Now to Propose locations for new parks based on underserved areas we will be using the brownfields areas as our reference. Recommend some new park location using the create point data tool from create data option. After providing a suitable name click save.
We will be selecting such areas that are within the brownfields near the residential areas but don’t come under the previously created isochrones. So that the newly created park location could be use of neighborhoods needing additional green space access. After finding the suitable location drop points there. Finishing up with save option.
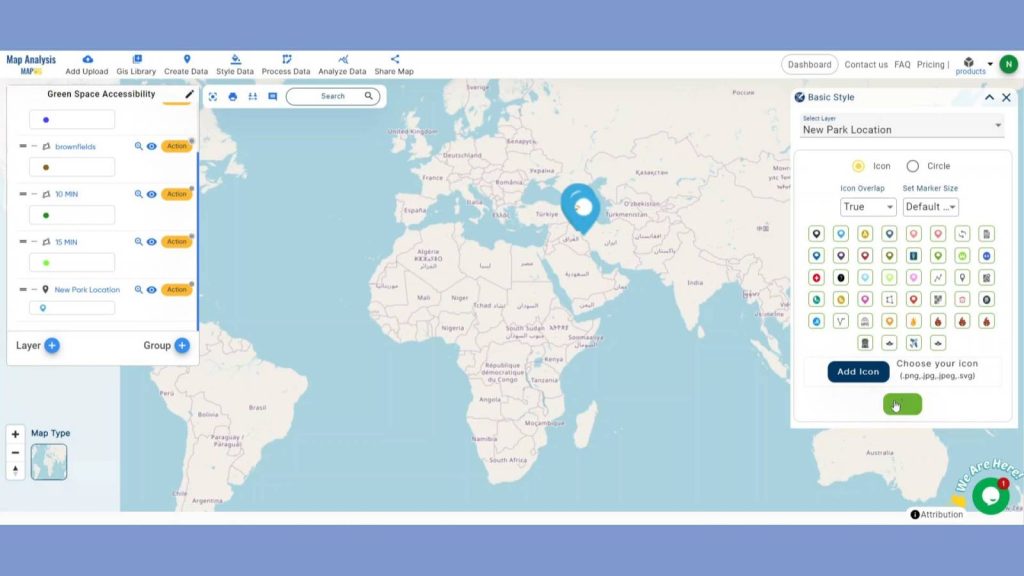
Step 4: Enhance Visualization
Using the Basic style from Style Data, we can allot different color to the newly created points for better understanding purpose.
Step 4: Results & Analysis
Using isochrones in MAPOG for green space accessibility analysis provides urban planners with critical insights into the distribution and accessibility of parks and recreational areas. This approach ensures that all residents have fair access to green spaces, promoting healthier and more livable urban environments.
Enhance your EV infrastructure planning with “Mapping EV Charging Station Accessibility with Isochrone Analysis” to identify optimal locations and ensure coverage. Isochrone analysis benefits include improved accessibility, increased user satisfaction, and efficient resource allocation.
Major Findings
1. Uneven Accessibility: Analysis reveals significant disparities in green space accessibility across different urban neighborhoods, highlighting areas with limited access within a walkable distance.
2. Identification of Underserved Areas: Isochrone mapping identifies specific zones where residents lack convenient access to green spaces, pinpointing regions that require new parks or improved access routes.
3. Impact on Public Health: Findings indicate a correlation between limited green space accessibility and lower levels of physical activity and well-being among residents in underserved areas, emphasizing the need for targeted urban planning interventions.
Domain and Industry
This map is a powerful tool for Improved Urban Planning, Equitable Access, Community Engagement and beyond.
Conclusion
Green Space Accessibility using Isochrones in MAPOG provides a clear visualization of access to urban green spaces within specified travel times. This helps identify underserved areas and informs urban planning to enhance equitable green space distribution. Ultimately, it supports healthier and more livable communities.
LINKS FOR THE DATA 👍
Here are some other blogs you might be interested in
- Create a Map for Pipeline Impact Zones: A Step-by-Step Guide
- Revolutionizing EIAs: The Role of GIS Maps, Bearing Angle, Route Compass, and Distance in Civil Engineering
- Creating an Online Interactive Map for Residential Land Use and Buffer Analysis with Thematic Visualization
- Grid Mapping for Accurate Spatial Analysis: Divide and Conquer with GRID Map Tool