Hospital Accessibility Analysis in MAPOG assesses the geographic reach of healthcare facilities. This vital tool aids in optimizing medical services, ensuring efficient access to hospitals for improved public health. It empowers decision-makers to strategize healthcare infrastructure and enhance overall accessibility for diverse communities. As the narrative unfolds, venture into the realm of urgent response with “Fast Emergency Response: Using GIS and Isochrone Maps for 10-Minute Ambulance Arrival“.
Key Concepts to create Hospital Accessibility Analysis with MAPOG
Our goal is to project identify villages lacking hospital facilities. This map’s thematic structure is undoubtedly what gives it it’s fascinating details. Join us as we walk you through the process of making this effective map on the MAPOG. Let’s get started!
Steps to create Hospital Accessibility Analysis with MAPOG
Step 1: Add GIS Data
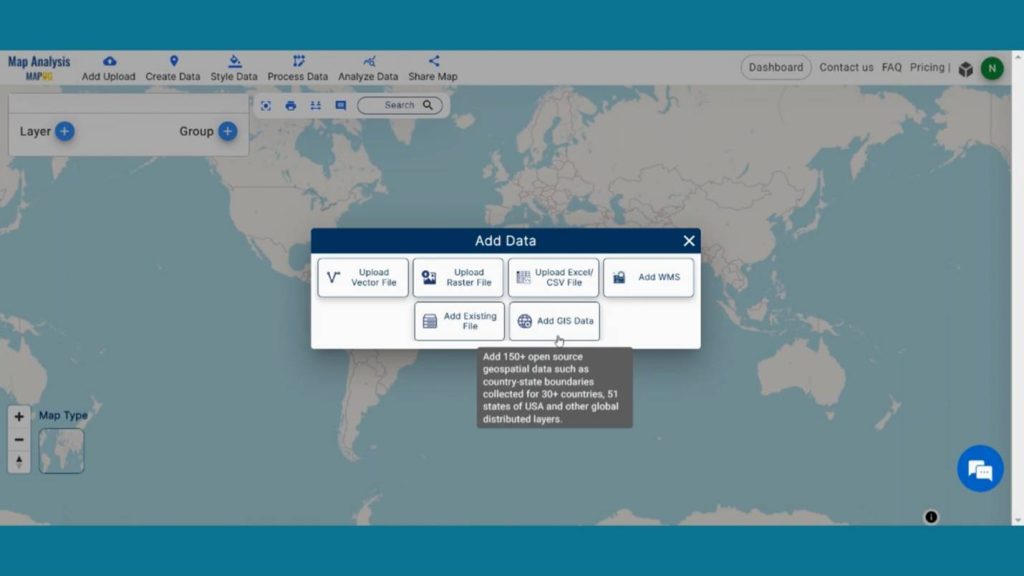
First, navigate to the Map Analysis interface. Then click on the “Add upload” button in the upper left corner. A dialogue box will open. Click on “Add GIS Data” to add data.
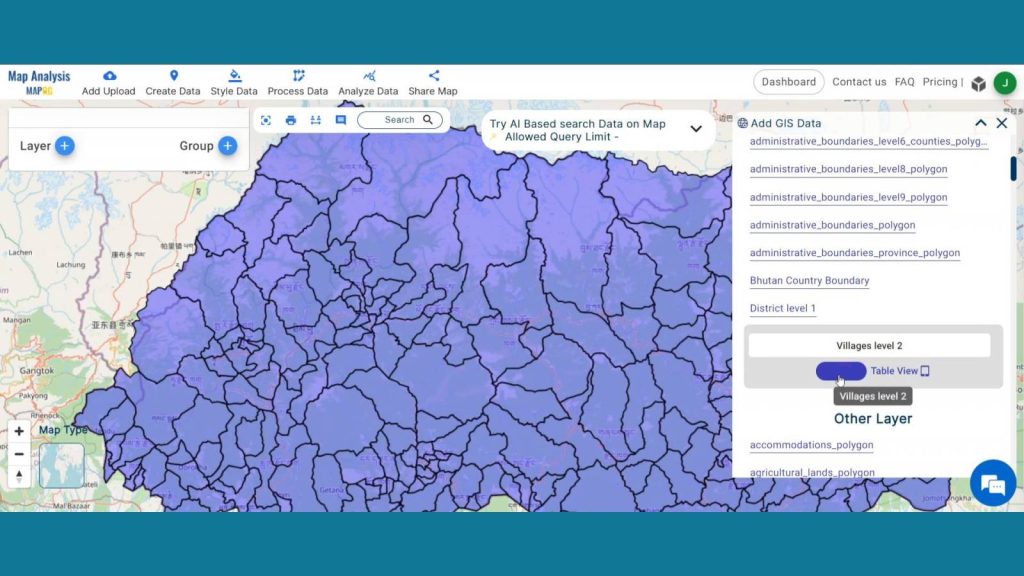
In the right corner box Provide the country name. Now, in the other layer option search for Village layer and by clicking Add option add this layer to map canvas.
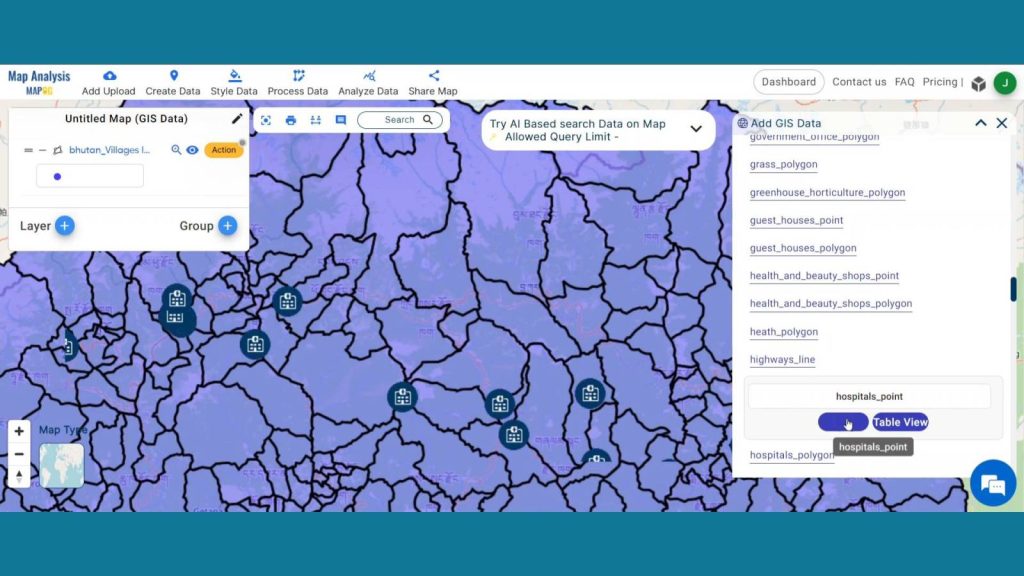
Now add another layer called Hospital Point by using the same method.
Step 2: Upload Excel/CSV File
In another way you can also upload your Excel or CSV file and do your personal analysis. To do that first go to Add upload section then press Upload Excel/CSV Files.
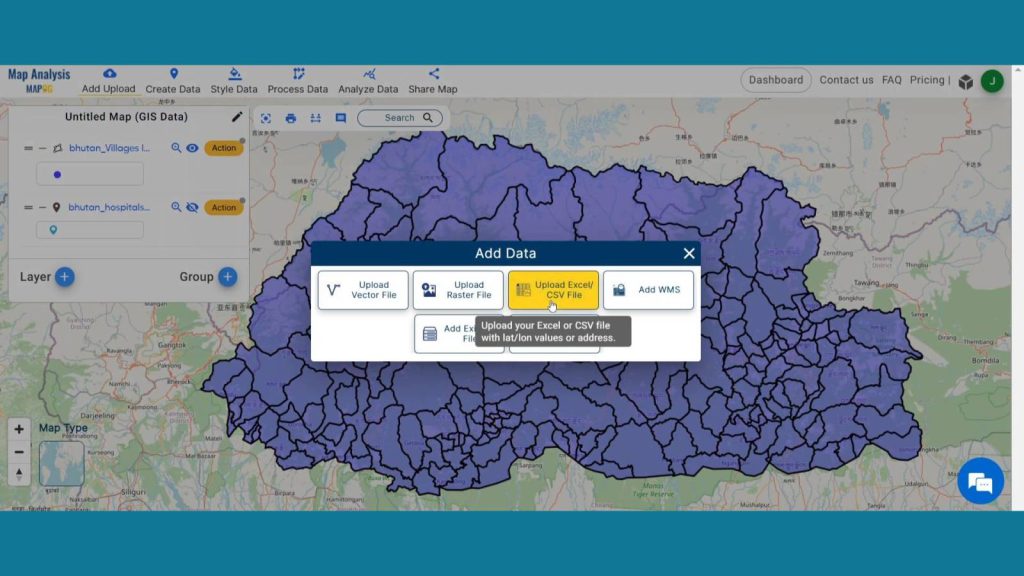
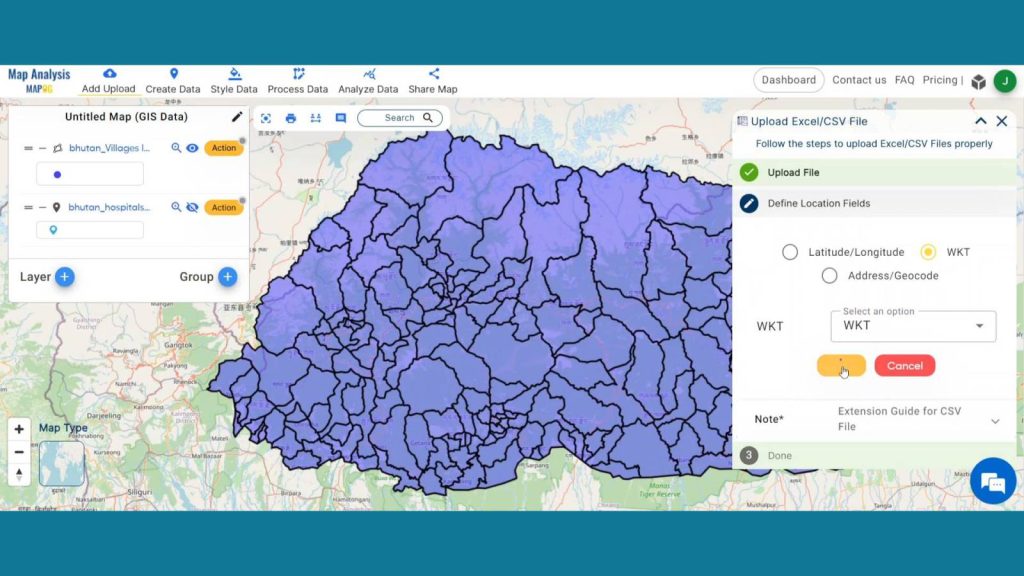
Now, Browse and upload your Hospital Data. Then Select the locational attribute provided in excel. Here In excel file WKT attribute is used, so select WKT and choose WKT from drop down section and publish the layer.
Step 3: Rename Layer
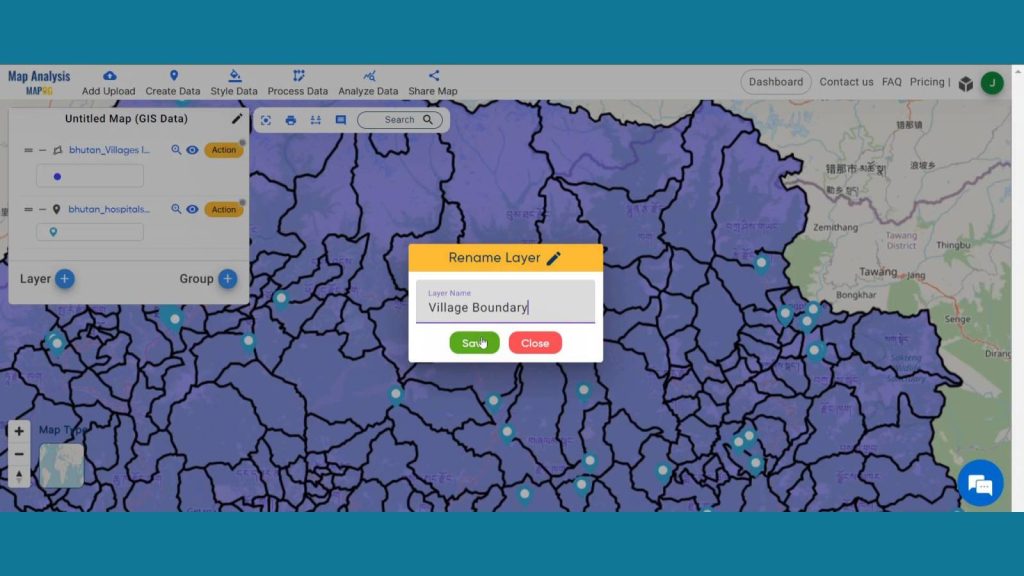
Now, click on the action button of Village layer and click on the pencil icon to Rename the layer to “Village Boundary”. The same way renames the Hospital point layer as Hospital.
Step 4: Save Project
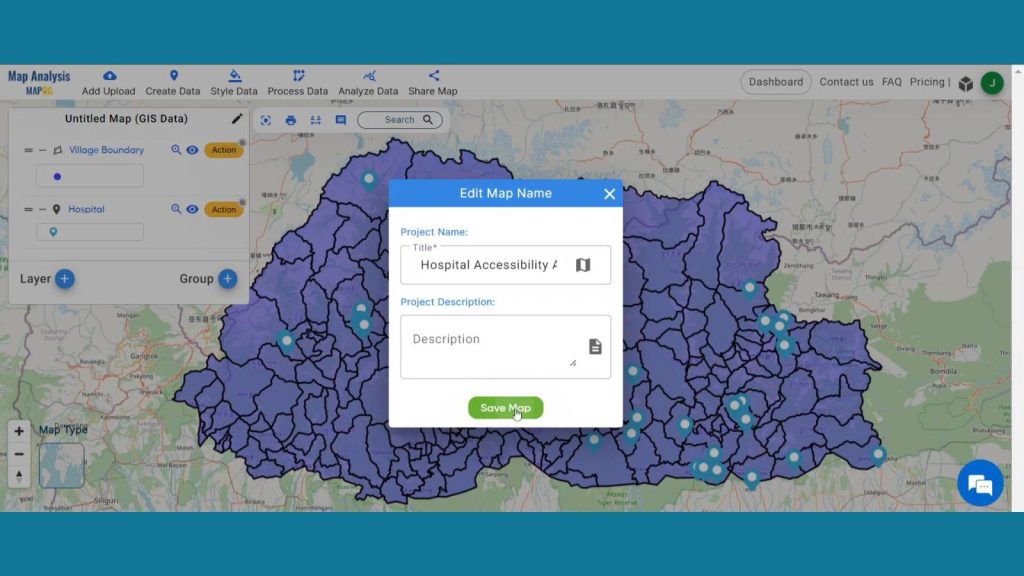
Now, click on the pencil icon situated right after the “Untitled Map” text to save the project. In the dialogue box write proper name and description that describe the project accurately. And click on save map option. Your project will be saved.
Step 5: Add Thematic Style
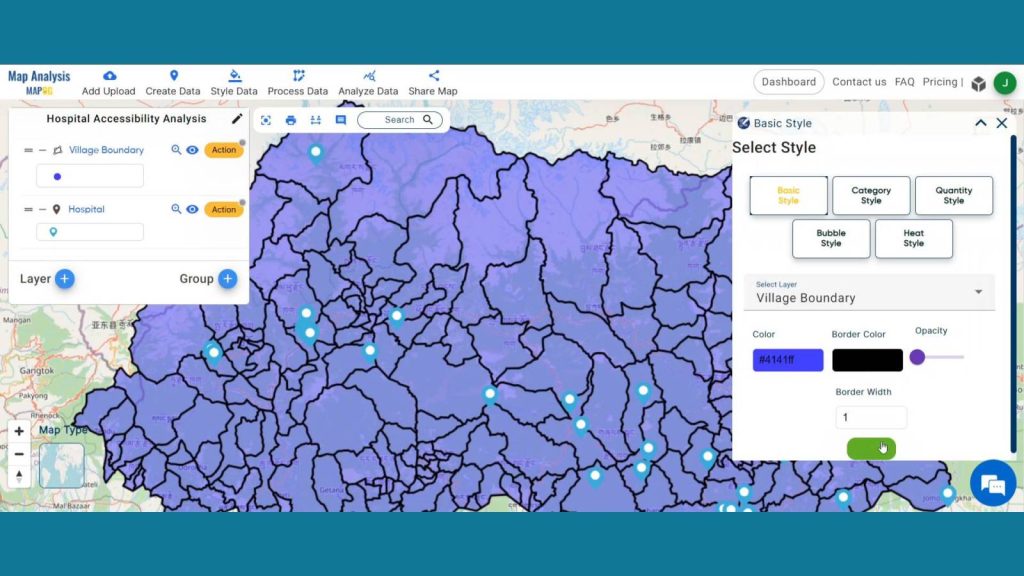
Enhance the visualization of the layer using Basic style data option. Select the Village boundary from select layer drop down menu. Then come to the opacity section and set the opacity as zero and save style. By doing this layer will become transparent, and we will be able to see the land use layers underneath it.
Now, select the Hospital layer provide suitable icon and size then save the style
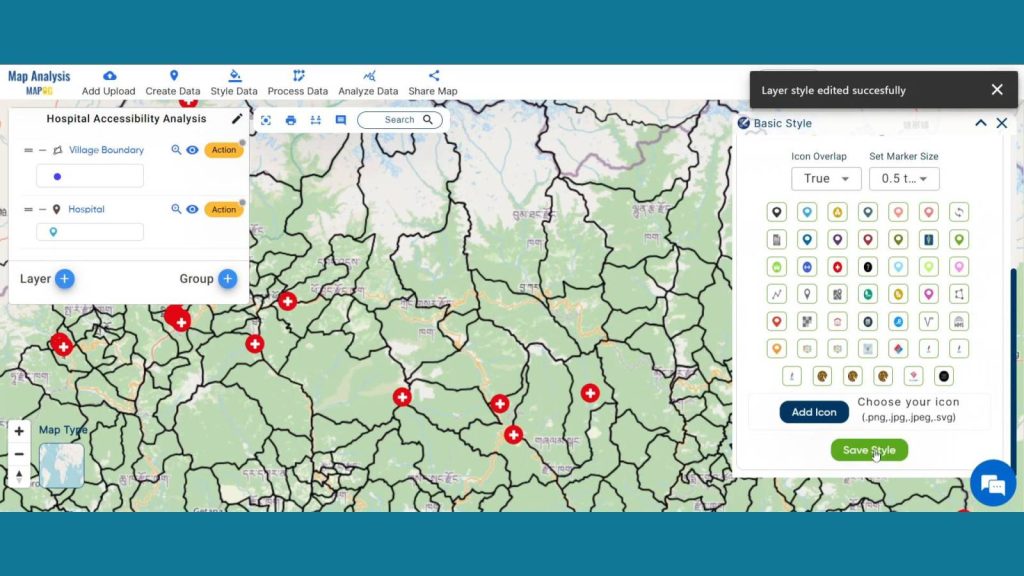
Step 6: Create Isochrones
We will now use isochrones to visualize the areas that are reachable within 60 minutes from hospitals. Click Process Data from the header and select Isochrones to accomplish that.
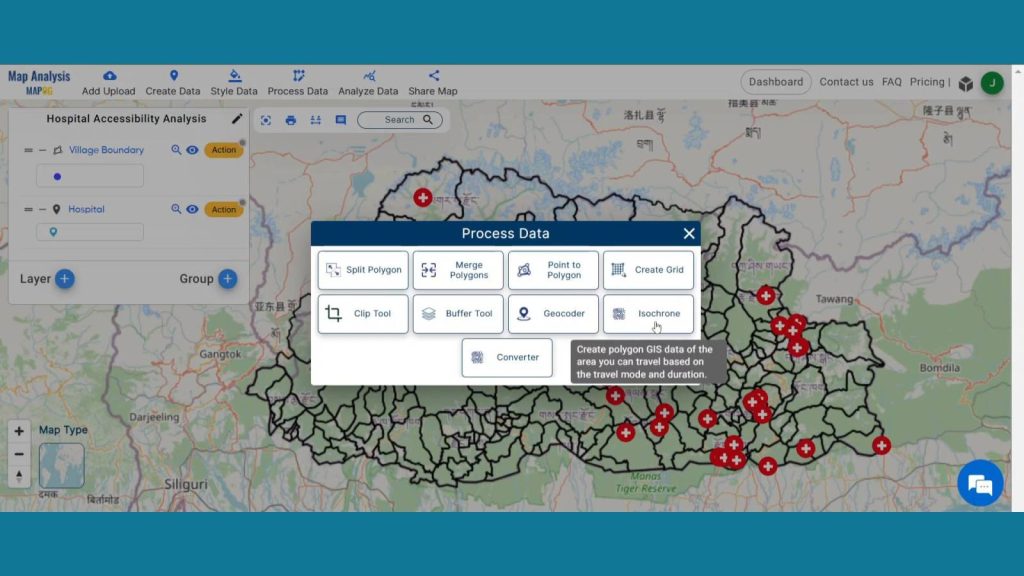
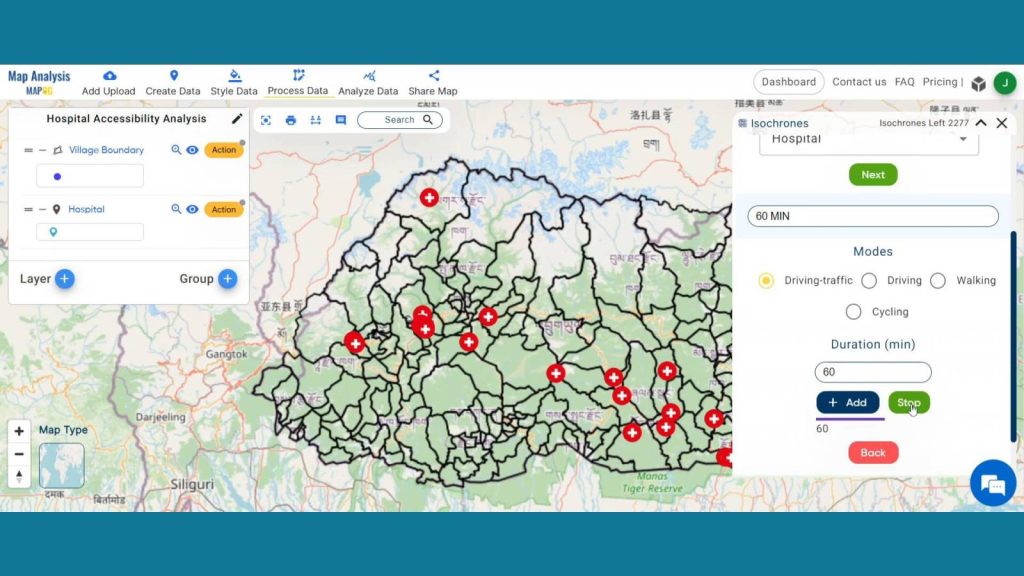
Next in select layer option select the Hospital layer and after that select the duration time as 60 minutes and mode as drive-traffic and your isochrones will be prepared.
Then, add Basic style to these isochrones for better visualization.
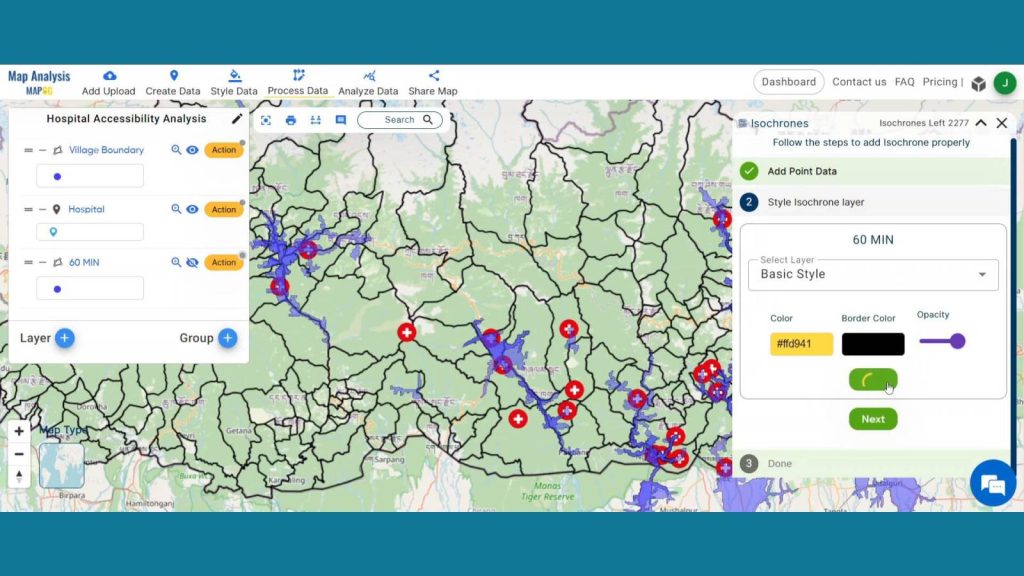
Step 7: Add Label Feature
Then click on label feature from action button of Village Boundary layer and select the layer, feature, color and font size. Then click on save label.
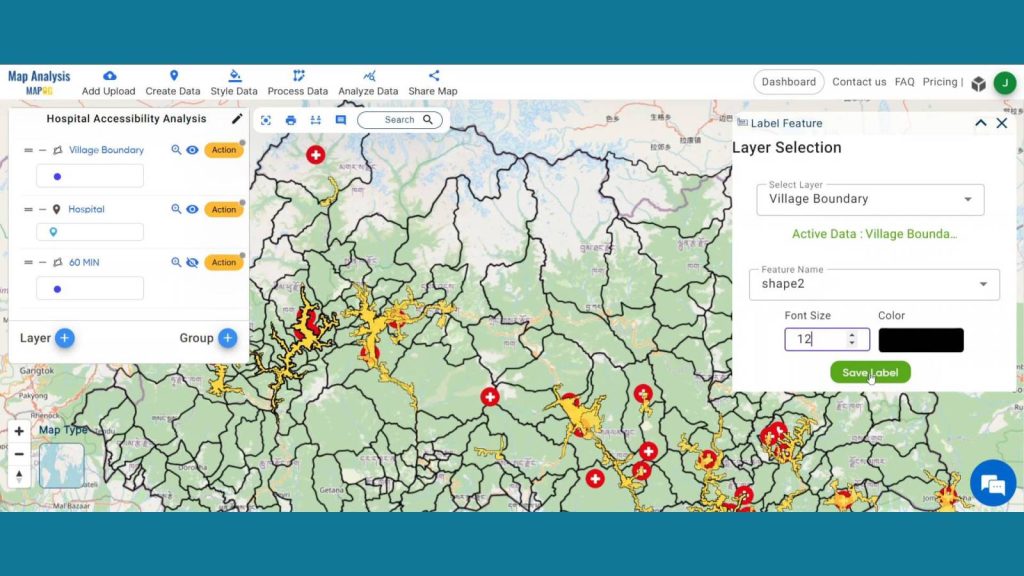
Step 8: Proximity analysis
Now to visualize villages that aren’t within 60 minutes reach of hospitals select Analyze data. Select two layers. The find features from village boundary that are further than hospitals. In length section write 0. click next.
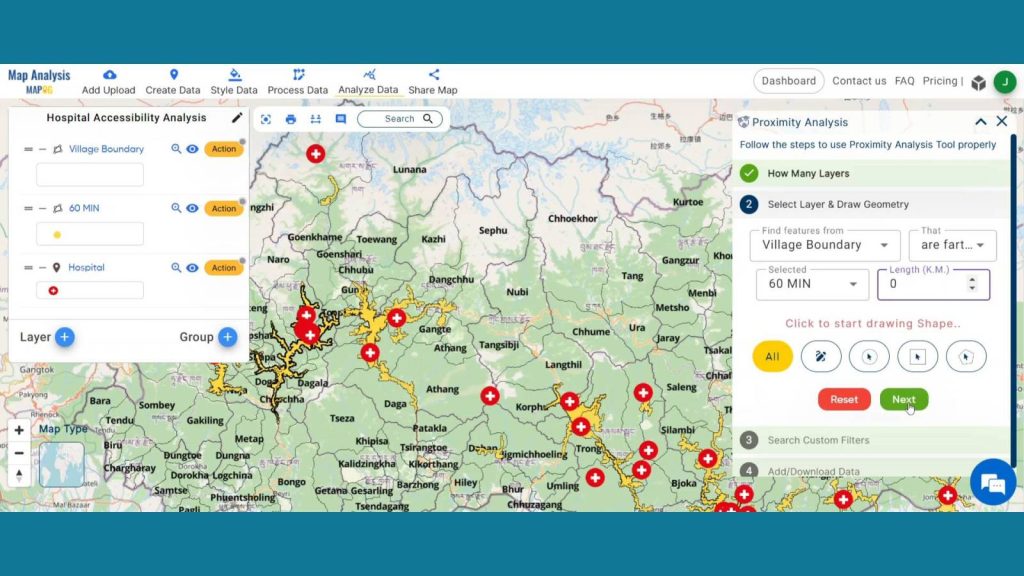
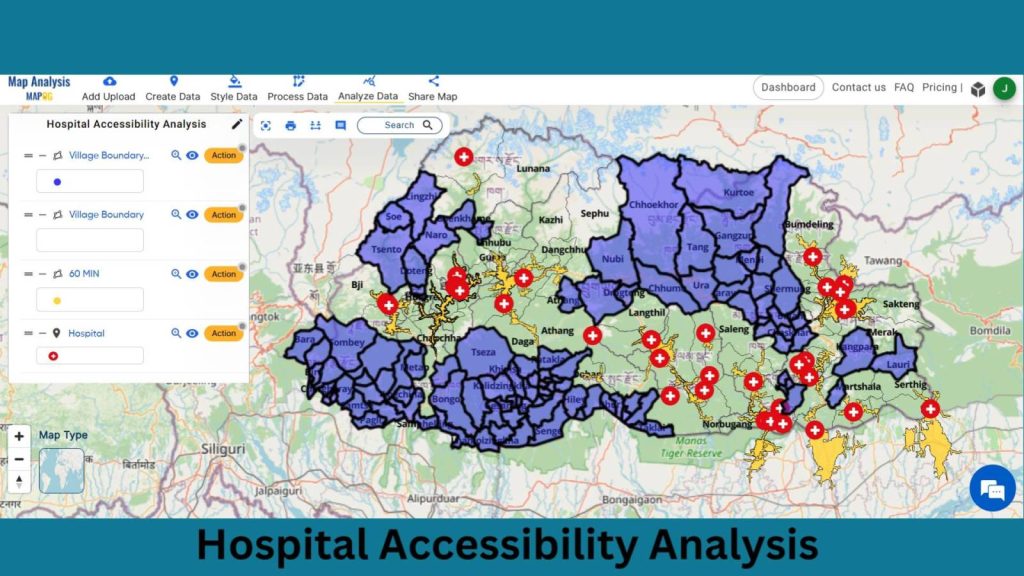
After doing that simply click on get results, then publish the layer. Rename the published layer for better understanding.
Step 8: Results & Analysis
With our map now enriched with details, let’s make those final adjustments. Via Hospital Accessibility Analysis, MAPOG tries to identify health care-deprived areas that may be targeted for improving healthcare access specifically to those areas. It works in favor of data-intensive decision-making at the level of infrastructure improvements, thus providing an opportunity for critical service point positioning and quicker response times to emergencies.
Begin your journey by uncovering the secrets of “Protecting Wetlands: Guide to Create GIS Map for Nature” where GIS emerges as a stalwart defender of fragile wetland ecosystems.
Major Findings
Identify Underserved Areas: Pinpoint regions lacking adequate healthcare access for targeted resource allocation.
Strategic Infrastructure Planning: Inform the development and placement of healthcare facilities for optimized accessibility.
Enhance Emergency Response: Improve response times and critical medical assistance through strategically positioned facilities.
Domain and Industry
This map is an effective tool for managing public health management, urban planning, and other related fields. Immerse yourself in the dynamic landscapes of urban planning through “GIS Analysis in Urban Planning: Reshaping Transportation Future Insights of state/city” discovering the transformative role of GIS in optimizing transportation for a sustainable and interconnected future.
Conclusion
In conclusion, Hospital Accessibility Analysis in MAPOG is pivotal for equitable healthcare distribution. By identifying underserved areas and strategically planning healthcare infrastructure, it ensures optimized accessibility. This tool empowers decision-makers to enhance emergency response, fostering a resilient healthcare system for the benefit of diverse communities.
LINKS FOR THE DATA 👍
Here are some other blogs you might be interested in
- Protecting Wetlands: Guide to Create GIS Map for Nature
- GIS Analysis in Urban Planning: Reshaping Transportation Future Insights of state/city
- Fast Emergency Response: Using GIS and Isochrone Maps for 10-Minute Ambulance Arrival
- Mapping Tiger Attack Hotspots – Create an Online Map and Share
- Make Routes for Military Aerial Planning- Through Bearing angle and Distance calculation – Online Route Compass
- Mapping Healthcare Efficiency: GIS Buffer Analysis of Hospital Locations
- Add WMS- Two step online view of WMS layer on a map
- Plot ATM locations on a map and embed on your website
- Map habitat locations of endangered animals & keep track of their living