In an era where energy plays a pivotal role in shaping the economic and social landscapes, equitable distribution of power is paramount. “Creating Energy Maps: Unpowered Settlements”, This article delves into the realm of MAPOG Map Analysis to identify potential energy deserts—areas where settlements lack the crucial infrastructure of energy power lines or towers. By cross-referencing settlement and power line data through MAPOG, this analysis sheds light on regions that may be overlooked in terms of energy access
Key Concept to Creating Energy Maps: Unpowered Settlements
The central focus of this MAPOG analysis is to pinpoint areas lacking critical energy infrastructure. Through a meticulous process, we aim to create a comprehensive map highlighting settlements distant from essential power lines. Explore deeper insights into the realm of advanced navigation tools by diving into our recent blog, “GIS Analysis in Urban Planning: Reshaping Transportation Future Insights of State/City”. To enhance transparency and accessibility, we provide the data link at the end of this article.
Unlocking the potential of our advanced navigation tool for powerline analysis is a straightforward process that empowers energy planners and infrastructure developers.
Let’s explore a step-by-step example where we analyse Energy Maps:
Step1: Data Upload:
Begin by uploading relevant powerline and settlement data into our GIS platform, laying the foundation for a comprehensive analysis.
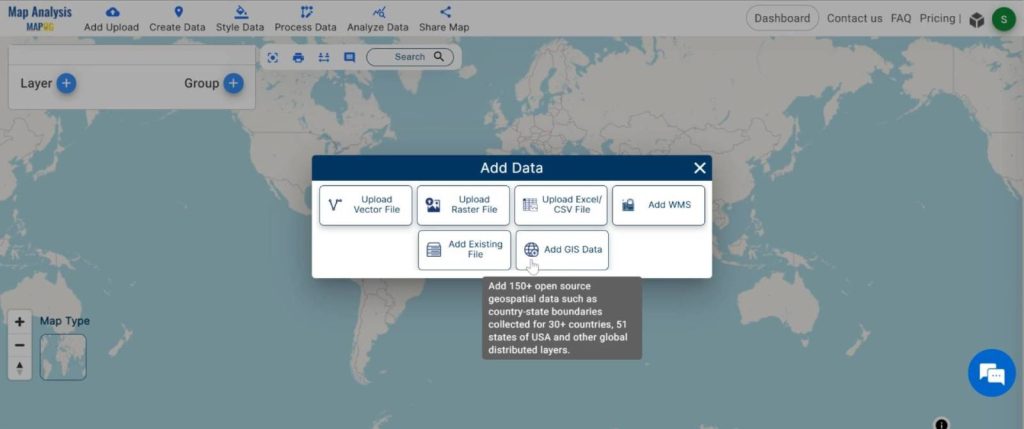
- Click On the “Add Upload” button and choose “Add GIS Data” option.
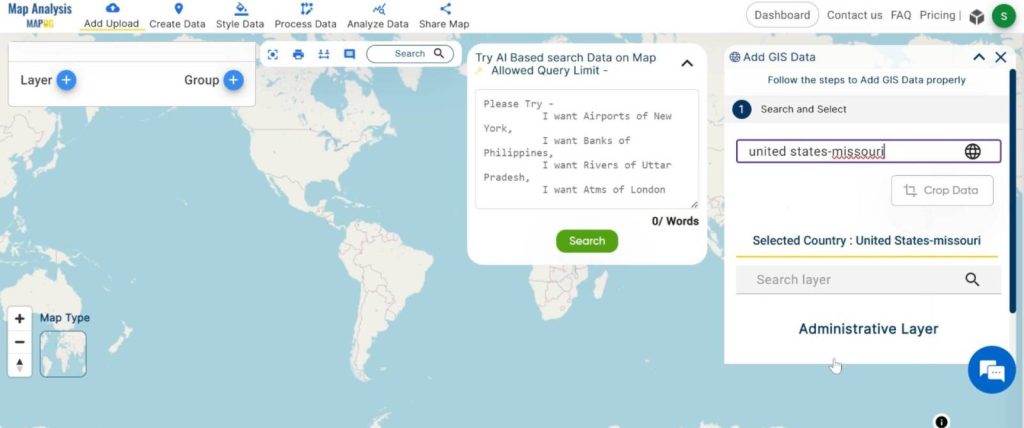
2. Search the country name
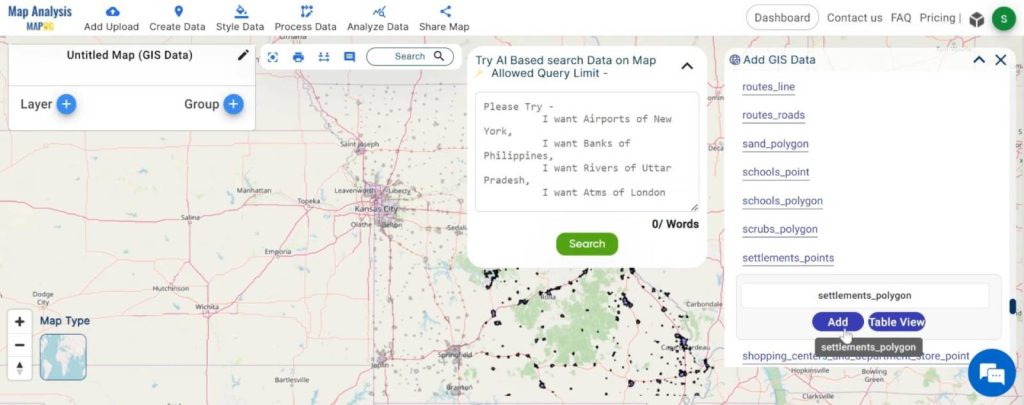
3. Add the Settlement and Powerline Tower point Data. Click on the “Add” Option.
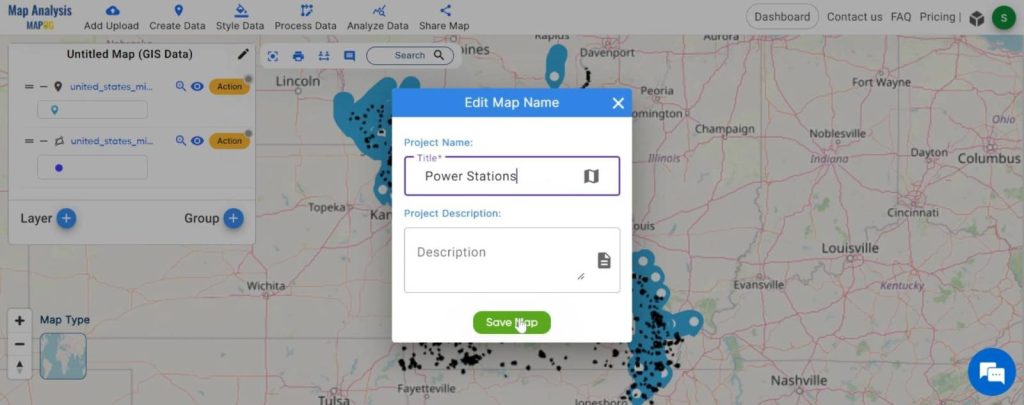
Step2: Name the untitled map and Rename the layer:
Here you have to name the untitled map
Rename the layer
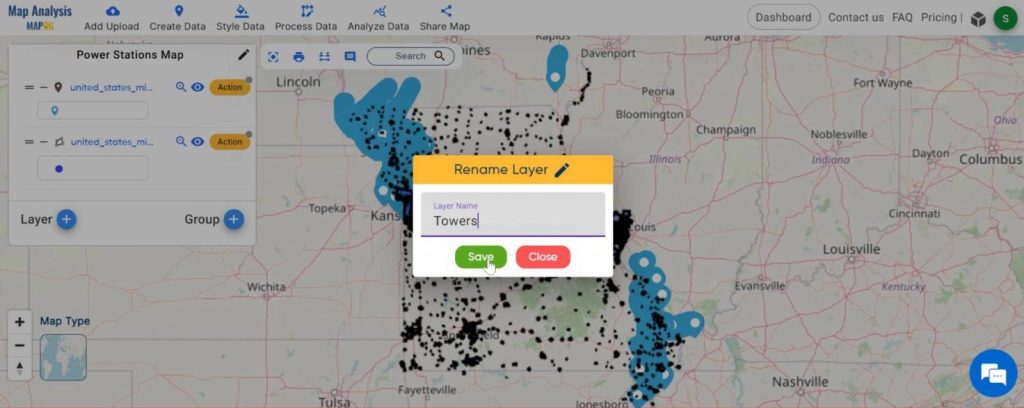
Step3: Styling Powerline Data:
Enhance the visualisation of powerline data by employing colour codes or symbols to represent different types or capacities. This step ensures a clear representation of the existing energy infrastructure.
- Click on the ‘Style Data‘ button and choose the “Basic Style” option.
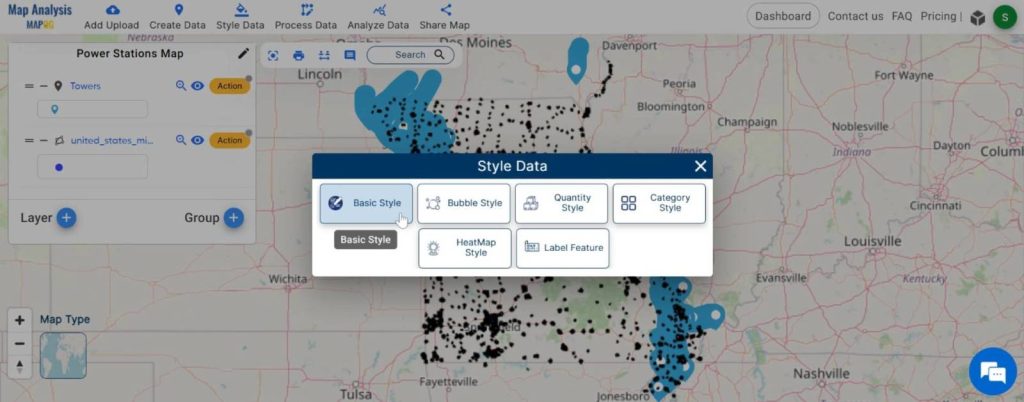
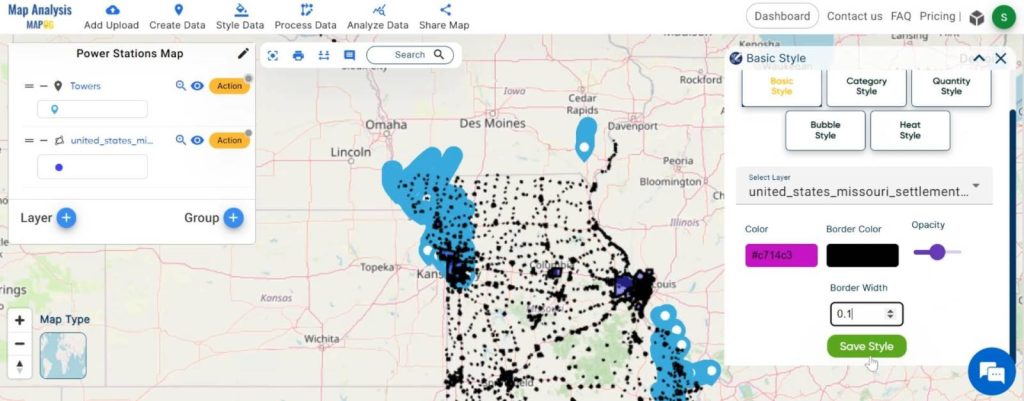
2. You can see the “Basic Style” Tool successfully opened on the right side of the screen.
Here, select the layer. then change the color and click on the “Save Style”.
Step3 :Settlement Data Styling:
Similarly, style settlement data for better visualisation, utilising distinct visuals to differentiate between various settlement types. This provides context for the proximity analysis.
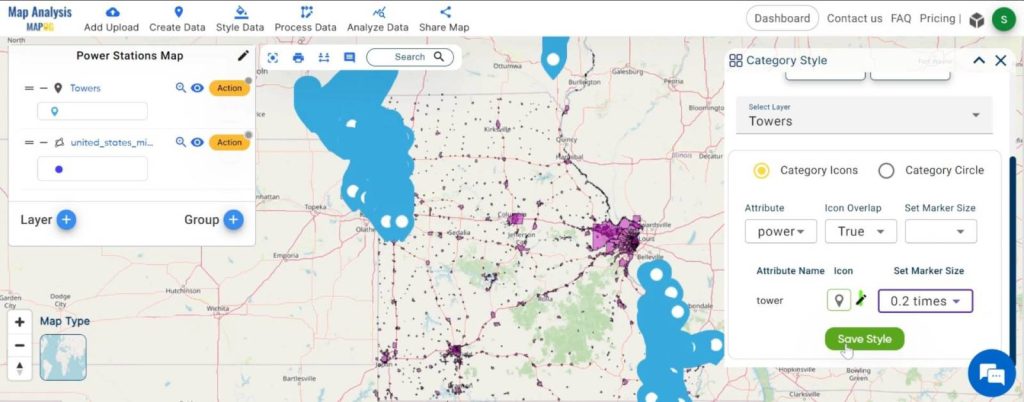
- Click on the “Style Data” button and choose the “Category Style”
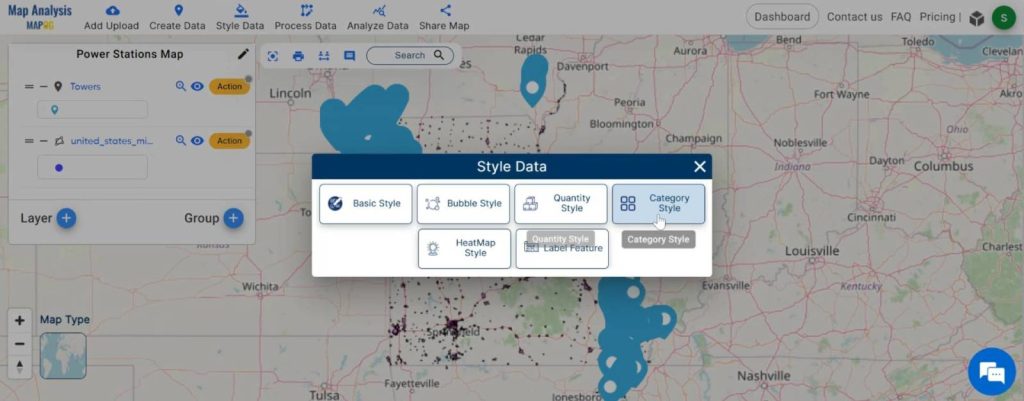
2.You can see the “Category Style” Tool successfully opened on the right side of the screen.
Select the Tower point data. Then change the icon and click on the “Save Style”.
Step4 :Proximity Analysis:
Utilise GIS tools to perform a proximity analysis, identifying areas where settlements are distant from existing power lines. This step quantifies the spatial relationship between settlements and energy infrastructure.
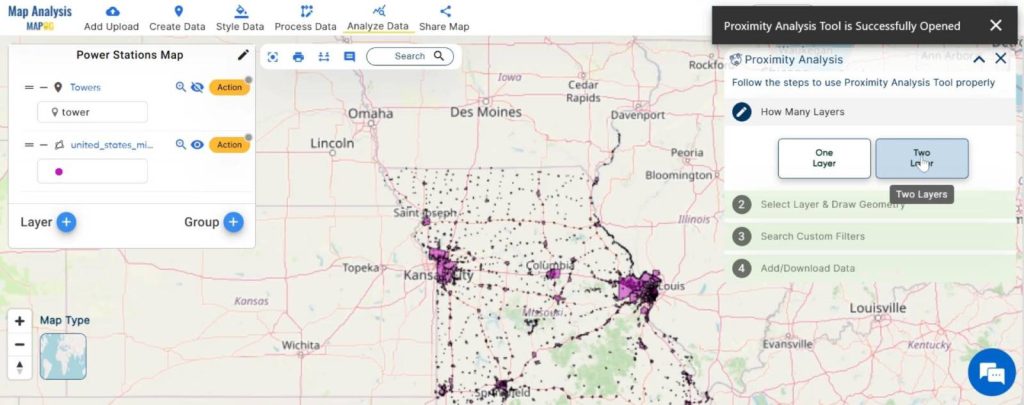
- Click on the “Analyze Data” button and choose “Two Layer”.
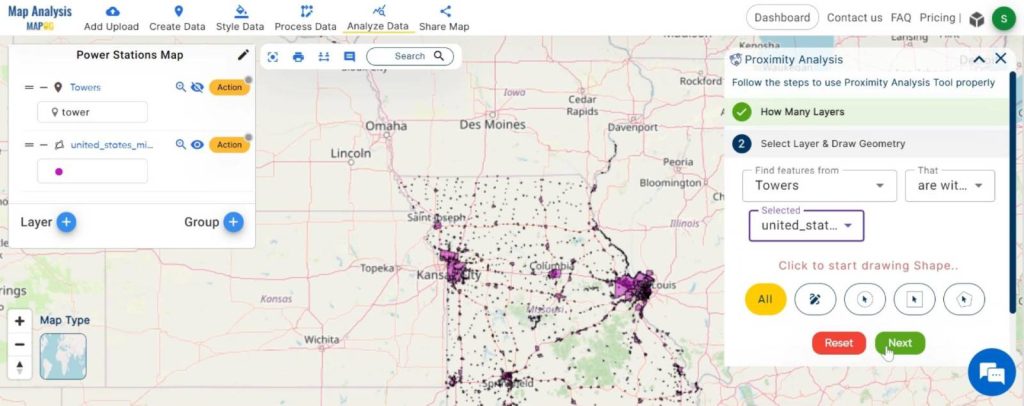
2. Here, select the finding feature and selected layer and click on the “Next” button.
3. Choose the field and write the option and click on the “Get Result” option.
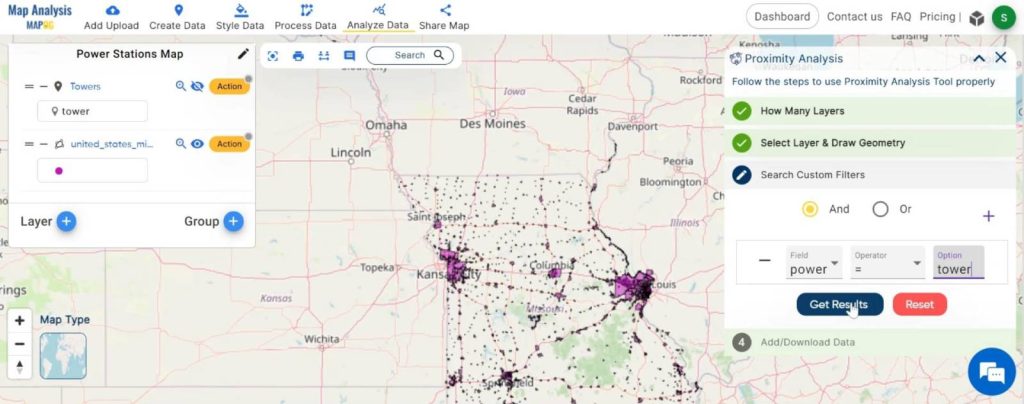
We can see the finding features.
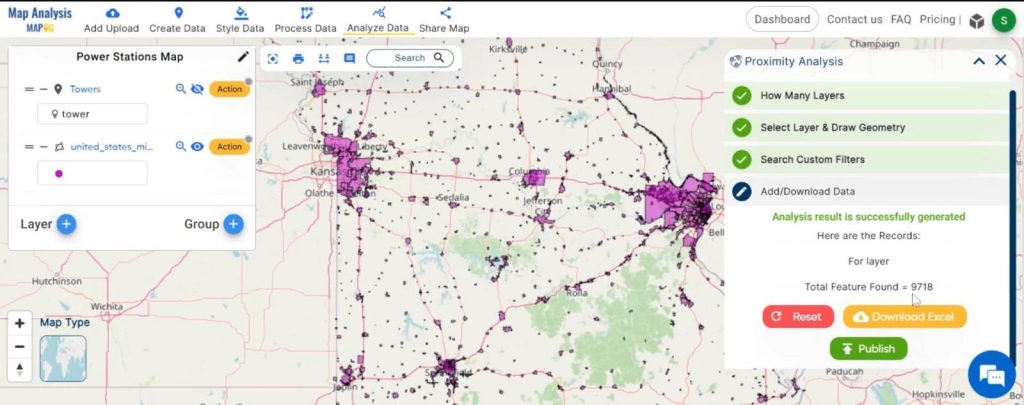
Step5 :Visualise Data:
Create a detailed map visualising the analysis results, effectively illustrating areas lacking in proximity to powerlines. This visual representation serves as a powerful tool for decision-makers and planners.
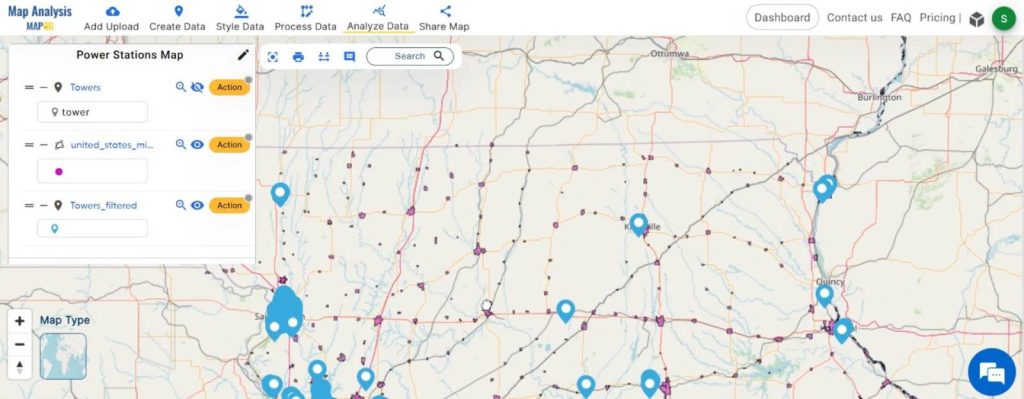
Step6 : Share and Collaborate:
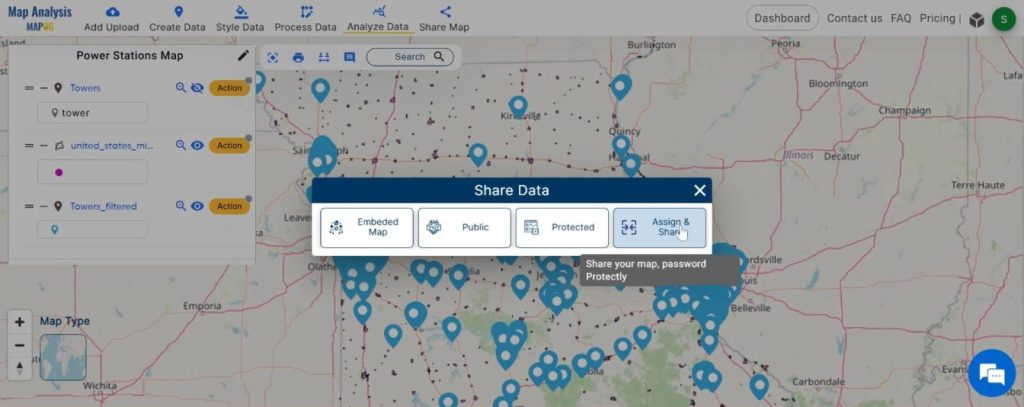
Facilitate collaboration by sharing the map with stakeholders, including energy providers, policymakers, and community representatives. This step fosters informed decision-making and ensures a collective understanding of the analysis.
Click on the “Share” option to share the map.
Major Findings:
The MAPOG analysis reveals specific regions where settlement areas are devoid of nearby power lines or towers. These findings serve as a call to action, guiding targeted investment and development efforts to ensure that energy resources are distributed more equitably.
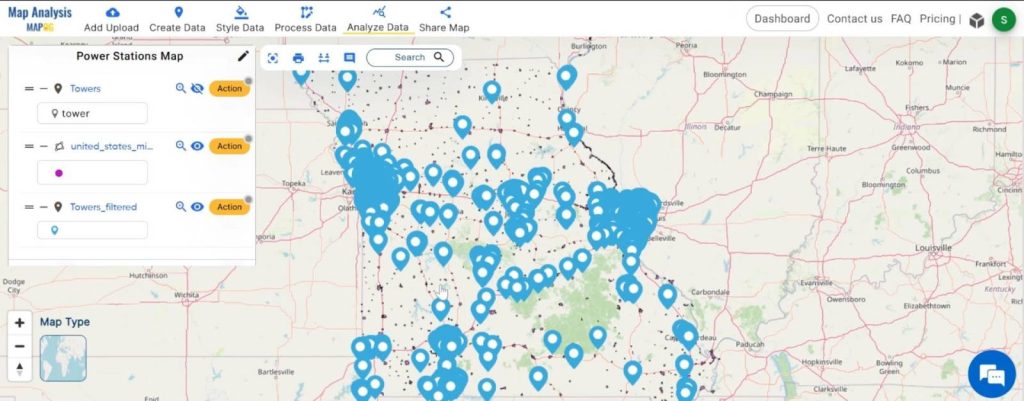
In conclusion, the MAPOG analysis proves to be an invaluable asset for the energy sector, providing a nuanced understanding of potential energy deserts. By identifying and addressing these gaps in infrastructure, we can collectively strive towards a future where energy access is a reality for all. This article invites stakeholders to join hands in bridging the energy gap and fostering a more sustainable and inclusive energy landscape.
Link of the Data:
Explore the data further through our GIS Data product, uncovering valuable information for in-depth analysis and understanding.