Grid maps are essential for analysing spatial data, helping to break down complex information into smaller, manageable sections. Whether you’re working in urban planning, environmental studies, or business analytics, a well-structured grid map enhances data visualisation and decision-making. In this guide, we’ll explore how to create grid maps effectively and introduce MAPOG’s Create Grid Tool, a powerful feature designed to streamline the process.
Key Concept
Creating grid maps for analysis involves dividing a geographic area into equal-sized grid cells and assigning data values to each cell. This helps in spatial analysis by standardizing data representation and enabling comparisons across locations. MAPOG can generate grid maps using vector data. The choice of grid size and data aggregation method depends on the analysis goals, such as population density, climate trends, or economic activity.
What is a Grid Map?
A grid map divides a geographic area into uniform cells, making it easier to analyze trends and patterns. These grids help in:
- Urban Planning: Identifying high-density areas for infrastructure development.
- Environmental Analysis: Monitoring deforestation, climate changes, or pollution levels.
- Market Research: Visualizing customer distribution and sales trends.
Steps to Create a Grid Map for Analysis
1. Define Your Area of Interest
Start by selecting the geographic area you want to analyze. Whether it’s a city block or an entire country, defining the scope ensures accurate data segmentation.
2. Choose the Grid Size
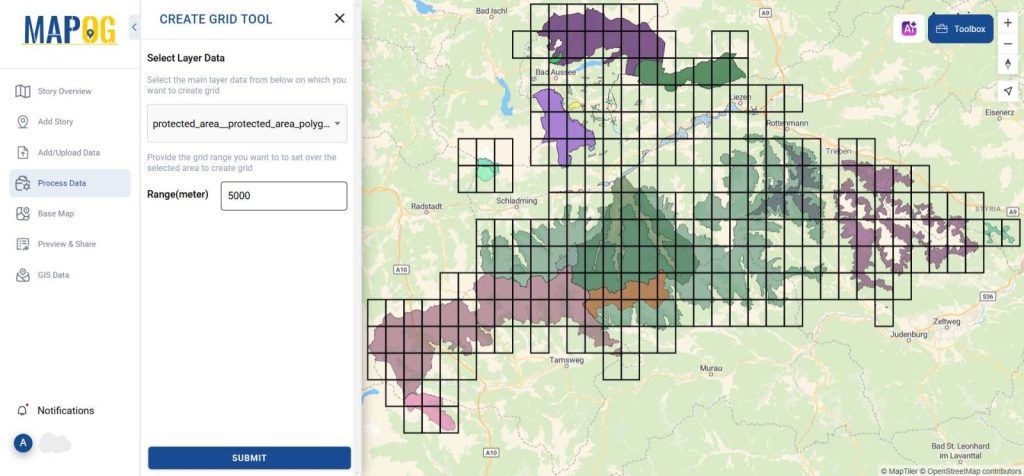
Grid size plays a crucial role in data accuracy. A smaller grid provides more details but may increase processing time, while a larger grid simplifies analysis but can overlook minor variations. MAPOG’s Create Grid Tool allows users to customize grid cell sizes based on their analysis needs.
3. Overlay the Grid on a Base Map
Using tools like MAPOG, you can Just upload the data or overlay the grid on MAPOG’s built-in maps like land uses or agriculture maps. This step ensures that your grid aligns perfectly with real-world locations, making analysis more meaningful.
4. Analyze Patterns and Trends
With the grid map in place, use heatmaps, color coding, or statistical tools to identify significant patterns. MAPOG’s interactive mapping features help visualize these trends dynamically, making it easier to interpret results.
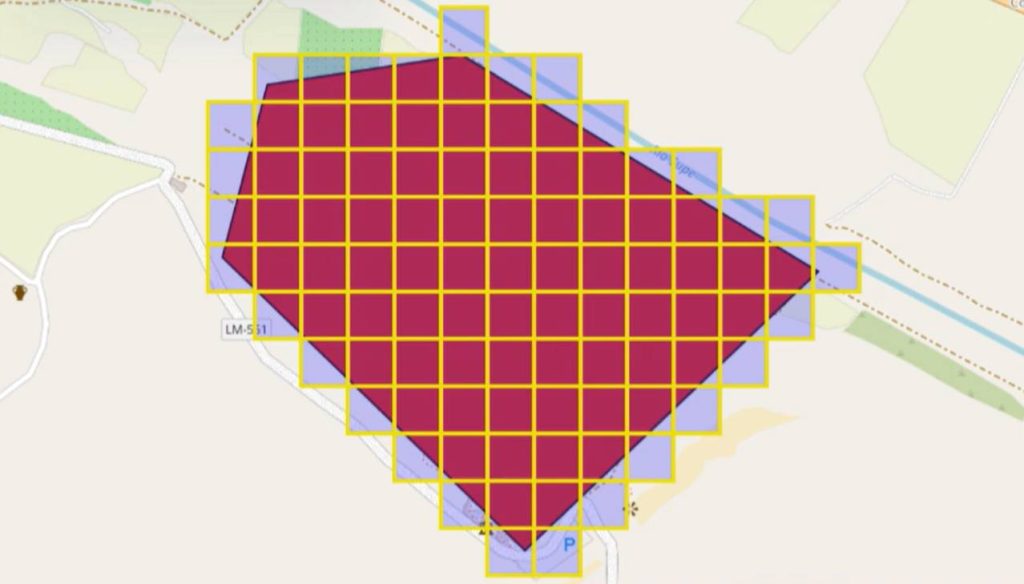
Example: Using a Grid Map for Archaeological Sites exploration
Imagine you are documenting an ancient archaeological site. By overlaying a grid onto the site map, you can systematically divide the area into manageable units, streamlining excavation and data collection. This method helps archaeologists analyze spatial distributions and preserve historical records. MAPOG’s Create Grid Tool simplifies this process by allowing researchers to customize grid overlays, ensuring precise documentation and analysis of ancient civilizations.
GIS DATA USED
Conclusion
Grid maps are a powerful tool for spatial analysis, making complex data easier to interpret. Whether you’re an urban planner, a researcher, or a business analyst, using a structured grid approach enhances your ability to derive meaningful insights. Explore MAPOG’s Create Grid Tool today and take your data visualization to the next level!
Have you used grid maps in your projects? Share your experiences in the comments below!
Here are some other blogs you might be interested in
- Protecting Wetlands: Guide to Create GIS Map for Nature
- Mapping Tiger Attack Hotspots – Create an Online Map and Share
- Make Routes for Military Aerial Planning- Through Bearing angle and Distance calculation – Online Route Compass
- Mapping Healthcare Efficiency: GIS Buffer Analysis of Hospital Locations
- Add WMS- Two step online view of WMS layer on a map
- Plot ATM locations on a map and embed on your website
- Map habitat locations of endangered animals & keep track of their living