- What is quantity style?
The quantity style is a method used for visualizing data, particularly in geographical information systems (GIS), where the representation of data is based on volume rather than intensity.
- What is the purpose of the style?
The purpose of the quantity style is to accurately represent quantitative data, such as vegetation cover percentages, across geographical areas. It allows for precise measurement and visualization of data, enabling better analysis and decision-making.
- What is the benefit of this?
The benefit of the quantity style is its ability to provide a clear and comprehensive understanding of vegetation distribution, allowing users to identify patterns, trends, and variations in the data with precision. This article ‘Unveiling Quantity Style: Vegetation Cover Mapping’.
Key Concept Unveiling Quantity Style: vegetation cover mapping:
Quantity Style maps depict data based on quantity, making it ideal for analyzing geographical information systems (GIS) data such as vegetation cover percentages.
Process Unveiling Quantity Style: vegetation cover mapping:
Step 1:
Open MAPOG Map Analysis Interface, Add your vector file, go to Add Upload, then click Upload Vector File. After that, browse and select your desired data, and lastly Upload.
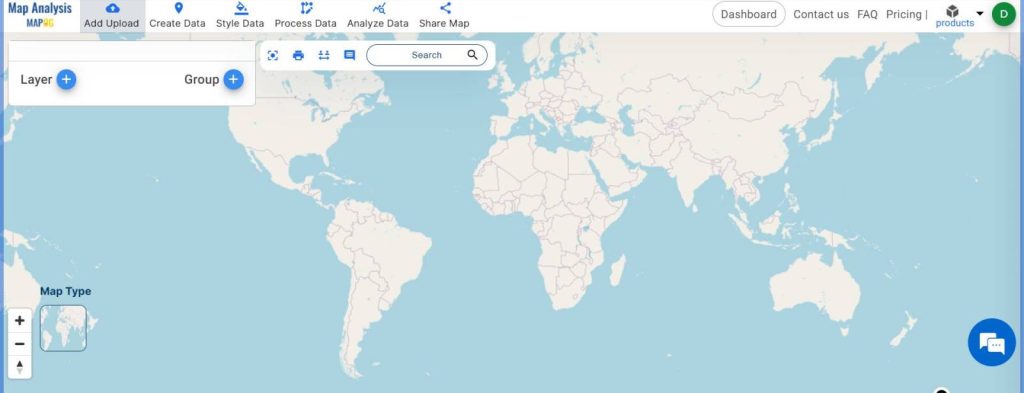
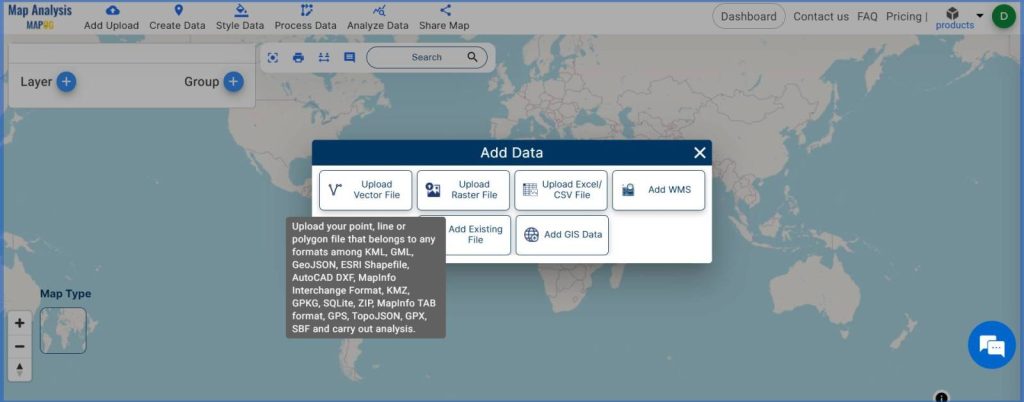
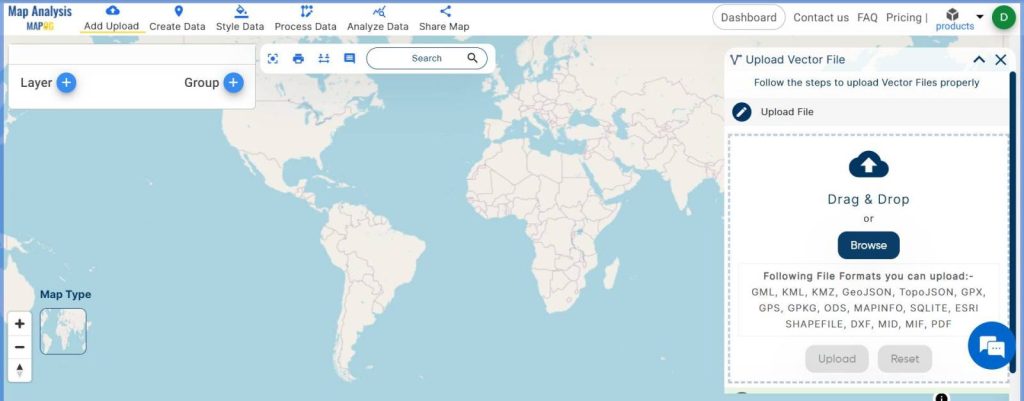
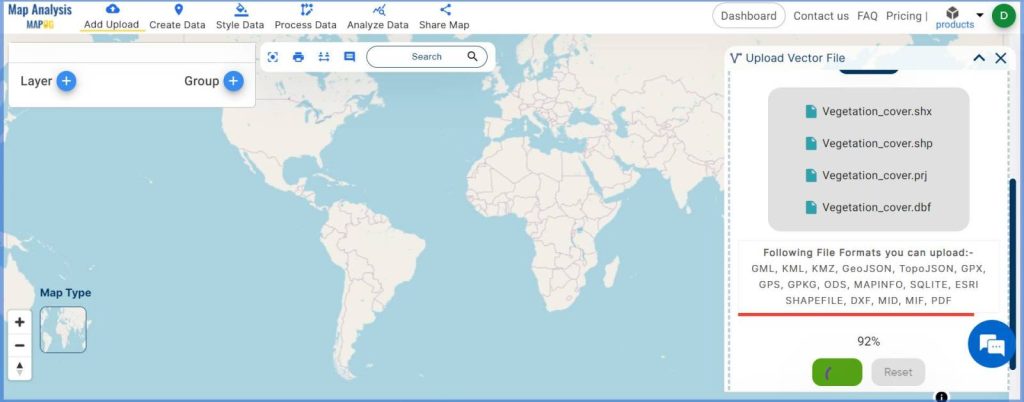
Step 2:
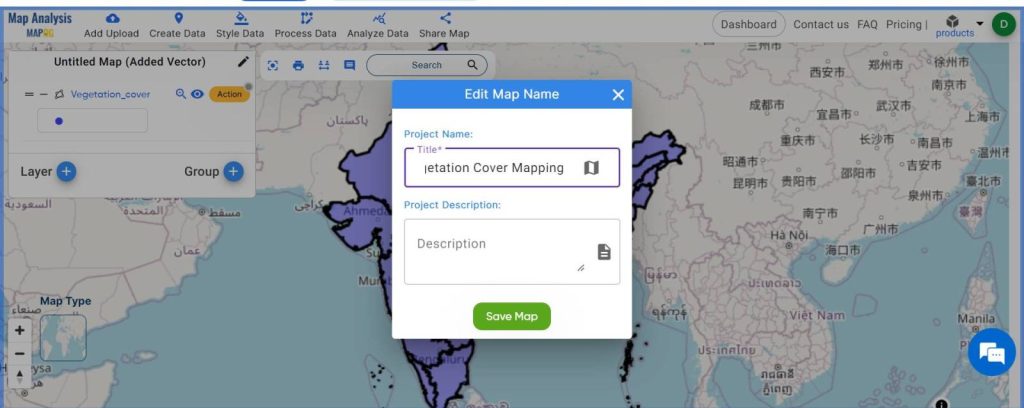
Then Provide a name to the untitled map for easy reference and click, save map.
Step 3:
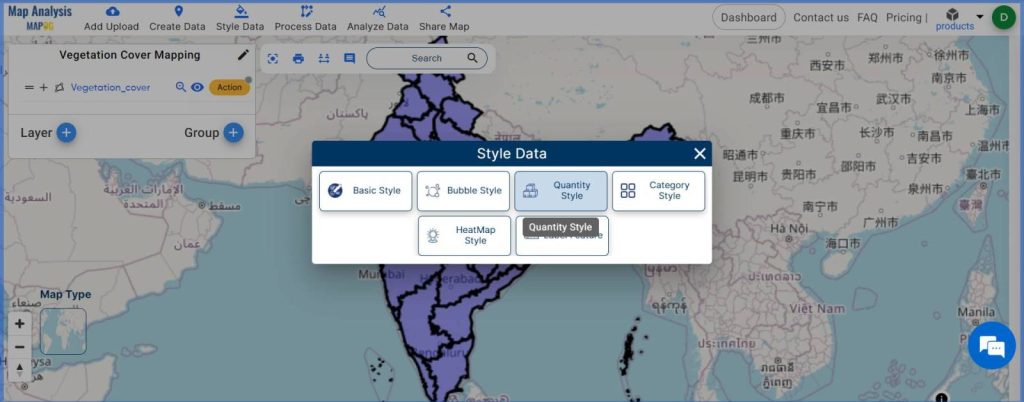
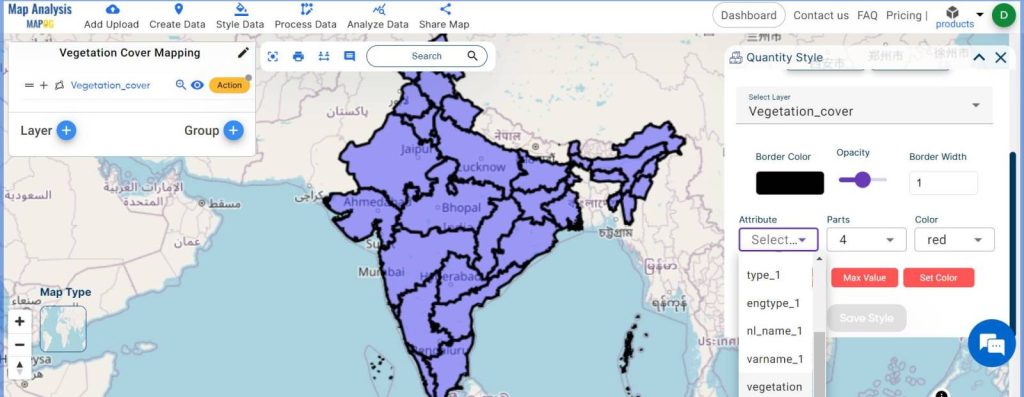
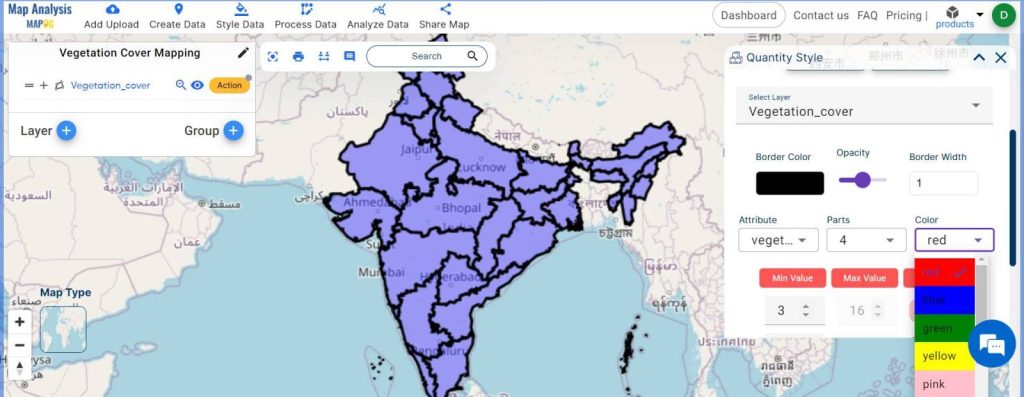
Now apply Quantity Style: Navigate to Style Data, choose Quantity Style, select the layer, choose the attribute based on which you want to style the data, and select the part, customize the color for styling.
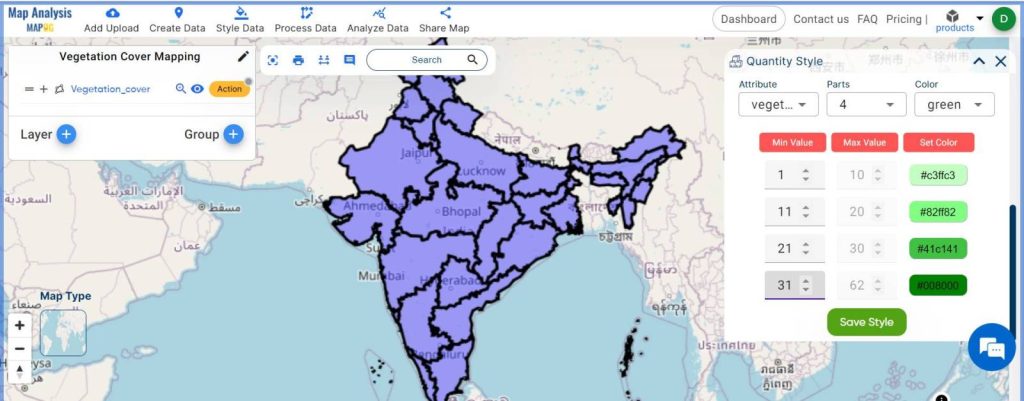
Step 4:
After all the parameters are selected click, Save Style
Step 5:
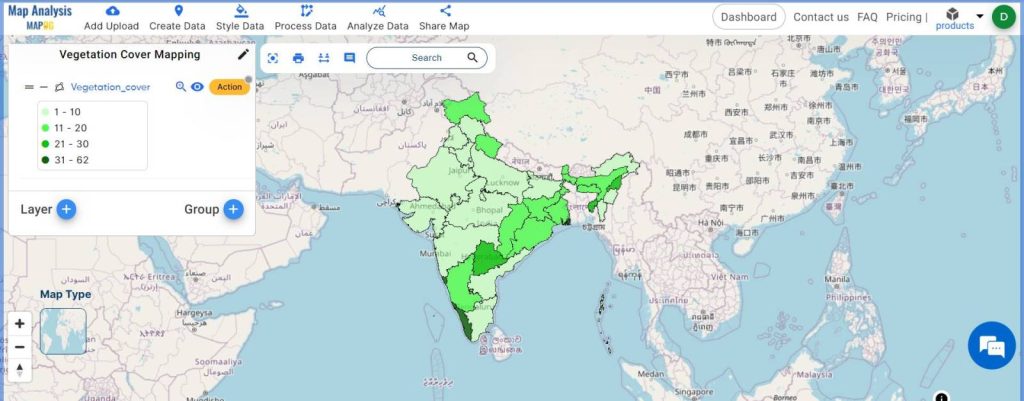
Now Display Legend for a better understanding, go to the Action button and select the Show Legend option.
Step 6:
Final Output: The map now reflects quantitative data with darker shades indicating higher quantities, offering insights into variations in vegetation cover and other attributes across the region.
Major Findings:
MAPOG’s Quantity Style facilitates comprehensive analysis of vegetation cover, enabling users to identify patterns, trends, and variations with precision.
Industry and Domain:
- Forestry Management:* Quantity Style empowers forestry professionals to accurately assess forest resources, monitor changes in vegetation density, and devise sustainable management strategies.
- Biodiversity Conservation: Conservationists leverage Quantity Style to analyze habitat fragmentation, identify critical biodiversity hotspots, and prioritize conservation efforts.
- Urban Green Space Planning: Quantity Style facilitates precise mapping of green spaces within urban areas, enabling city planners to assess green infrastructure, prioritize areas for urban greening initiatives, and enhance environmental quality.
- Agriculture: In agriculture, Quantity Style supports precision agriculture practices by mapping crop distribution, monitoring crop health, and assessing land productivity.
- Ecosystem Services Assessment: Quantity Style aids in evaluating ecosystem services such as carbon sequestration, water purification, and soil retention.
Conclusion Unveiling Quantity Style: vegetation cover mapping:
Quantity Style offers a powerful tool for precise data visualization in geospatial analysis. MAPOG’s user-friendly interface and advanced features empower users to conduct sophisticated analyses effortlessly. Whether it’s monitoring vegetation cover or assessing ecological corridors, Quantity Style proves indispensable in deciphering complex geographical data. Embrace the potential of Quantity Style through MAPOG and elevate your projects to new heights of accuracy and clarity.