In the quest to enhance health care service delivery, GIS provides a robust platform for mapping and analyzing health care services across different regions. Utilizing grid-based mapping techniques in GIS allows for a detailed. The equal-area analysis of service distribution with highlighting areas. Mapping Health Care Services: Utilizing Grid Tools in GIS, This article outlines a step-by-step process using the MAPOG Map Analysis tool to conduct a comprehensive analysis of health care services, revealing significant insights for planning and improvement.
Key Concept of Mapping Health Care Services: Utilizing Grid Tools in GIS
The core concept revolves around using GIS grid tools to create a clear, visual representation of health care service distribution. By dividing the study area into small, manageable squares, each grid square can be analyzed independently to provide a detailed understanding of service availability. Alongside this guide, datasets will be provided for practical application. articles like “Creating Travel Guides: Mapping with GIS Buffer Zones” and “Creating GIS Solutions for Urban Agriculture Map” offer deeper insights into GIS applications.
Creating a Health Care Service map using MapOG’s Grid tool is straightforward. Here’s a step-by-step guide:
Step 1: Uploading Data
The initial step involved uploading boundary data into MAPOG Map Analysis:
1.Click on the “GIS Library.”
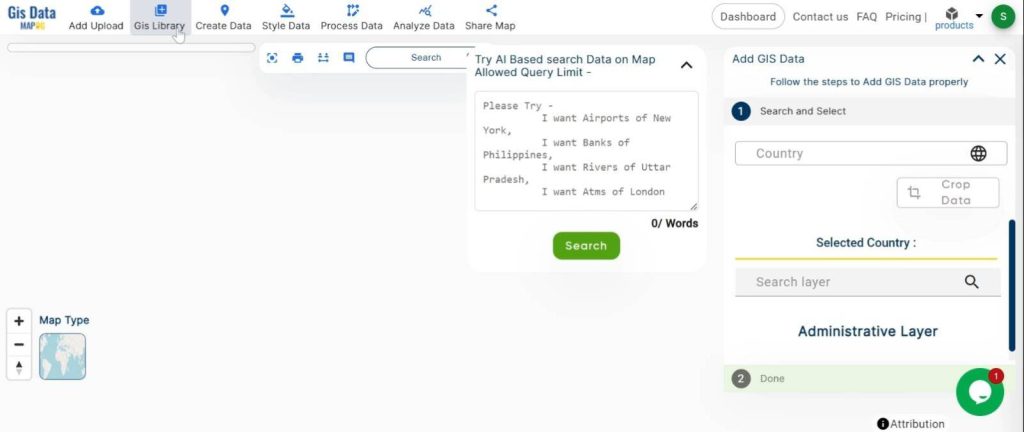
2.Search for the country name.
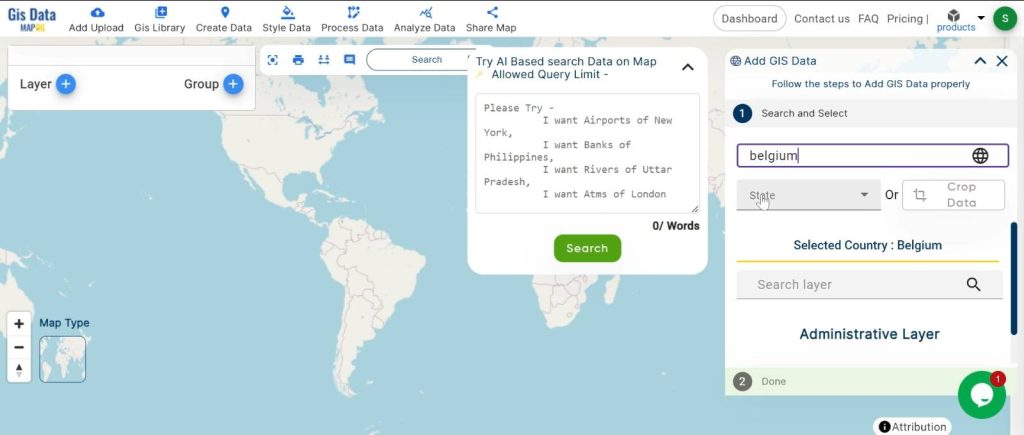
3.Select the required layer.
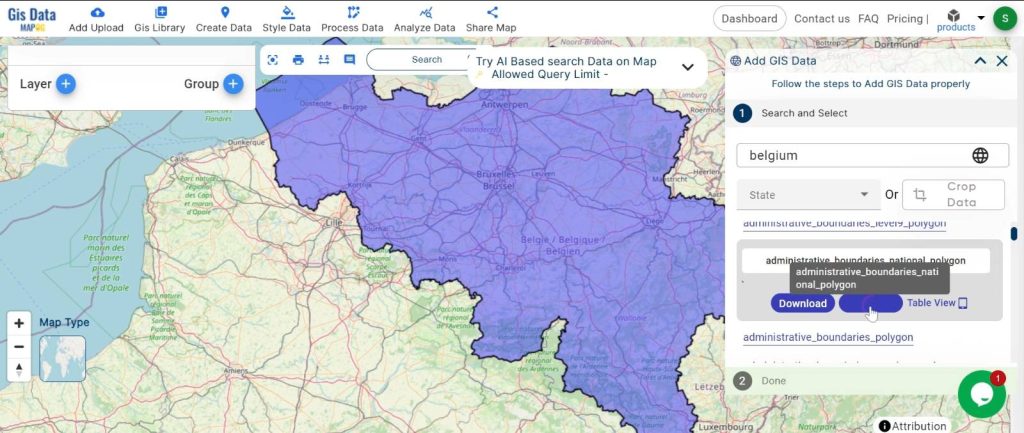
This step ensured all necessary data were consolidated in one place for a seamless analysis.
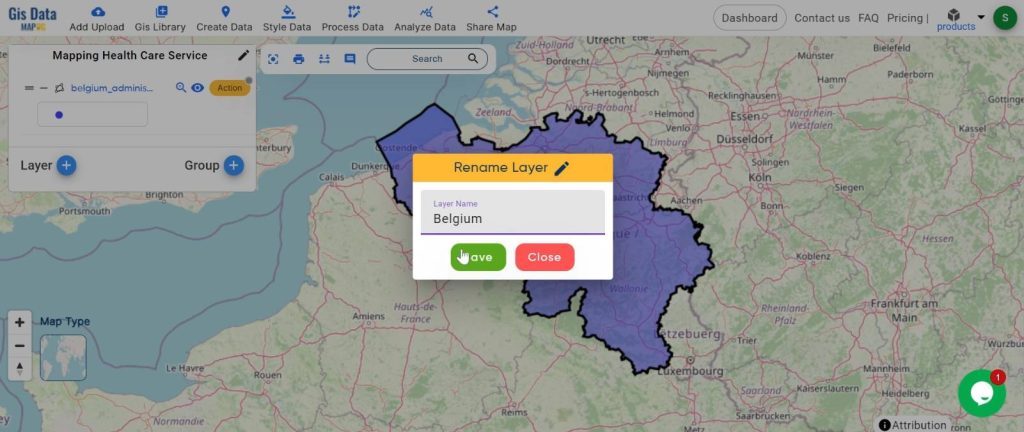
Step 2: Naming the Map and Renaming the Layer
1.We named the untitled map
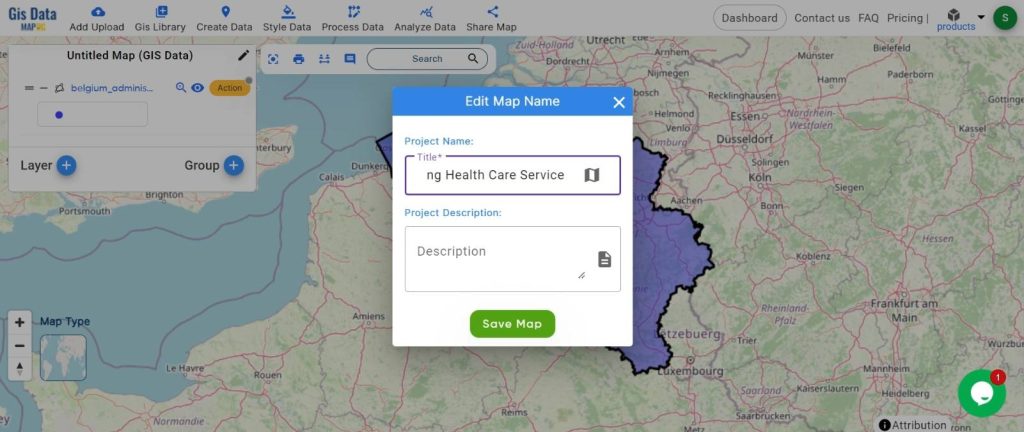
2.appropriately renamed the layer to maintain clarity and organization.
Step 3: Using the Grid Tool
we utilized the grid tool to segment our study area into small squares:
1.Click on the “Process Data” button and choose “Create Grid‘ Tool.
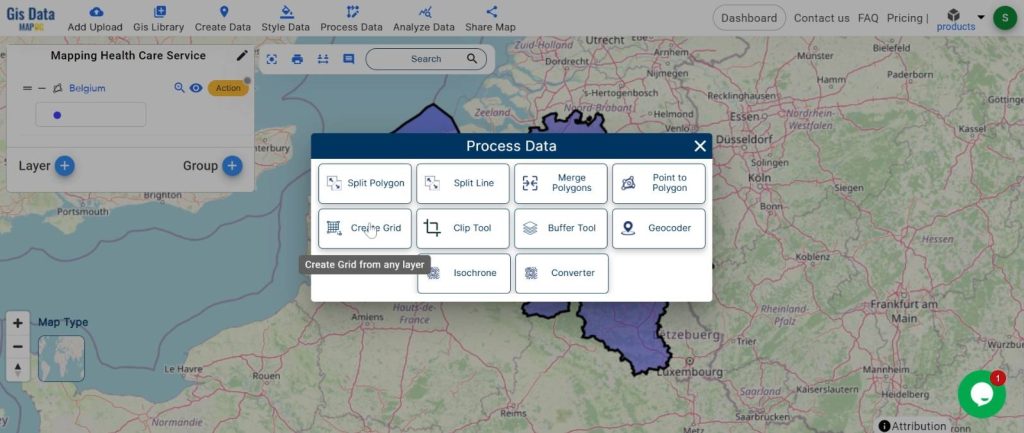
2.Set the layer and grid range. Click on the “Submit” button.
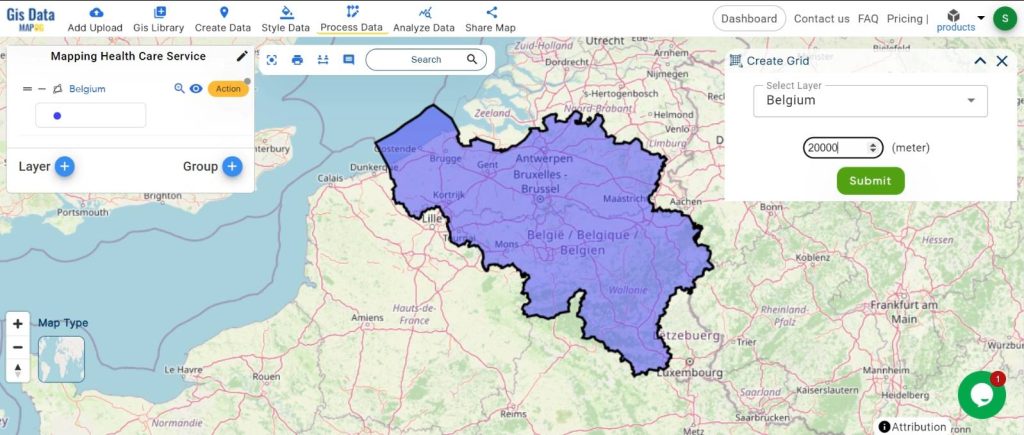
This approach allowed us to evaluate each part of the area uniformly.
Step 4: Adding Data with Excel
Additional health care data were incorporated from an Excel file, detailing the number of facilities and services in each grid square:
1.Click on the “Analyze Data” button and choose “Excel attribute.”
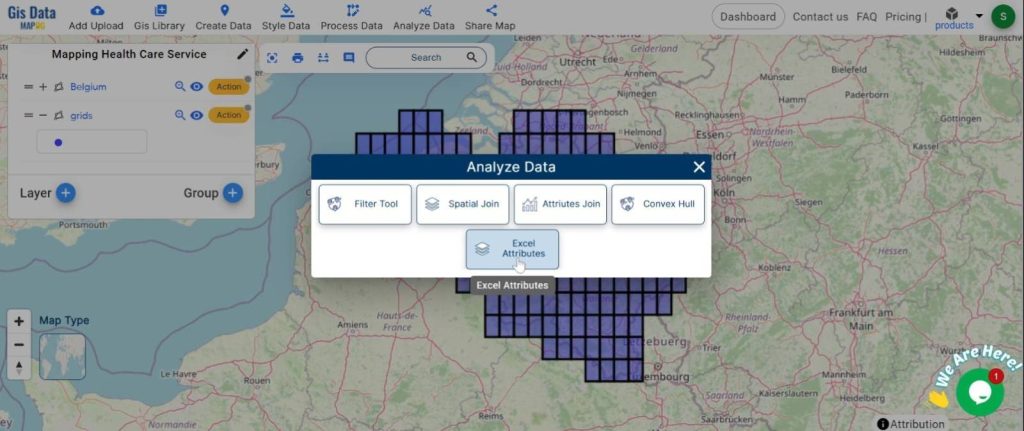
2.Upload the Excel file.
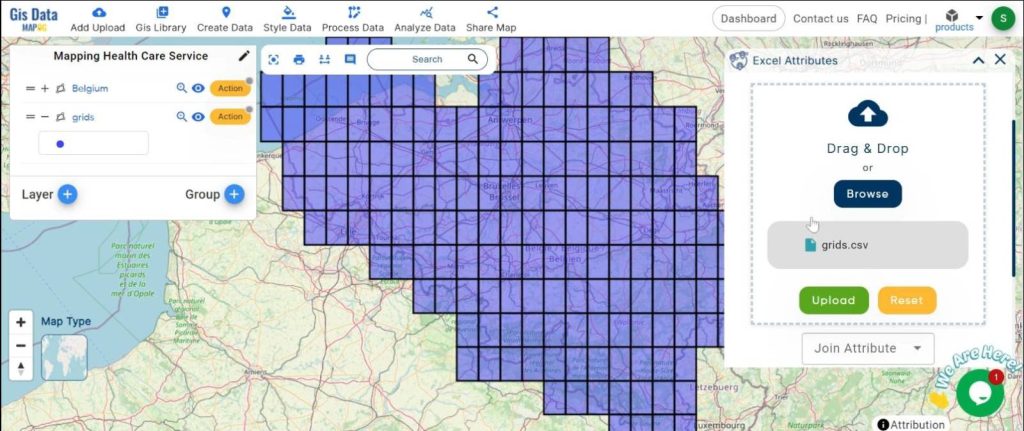
3.Set the join attribute, target layer, and attribute.
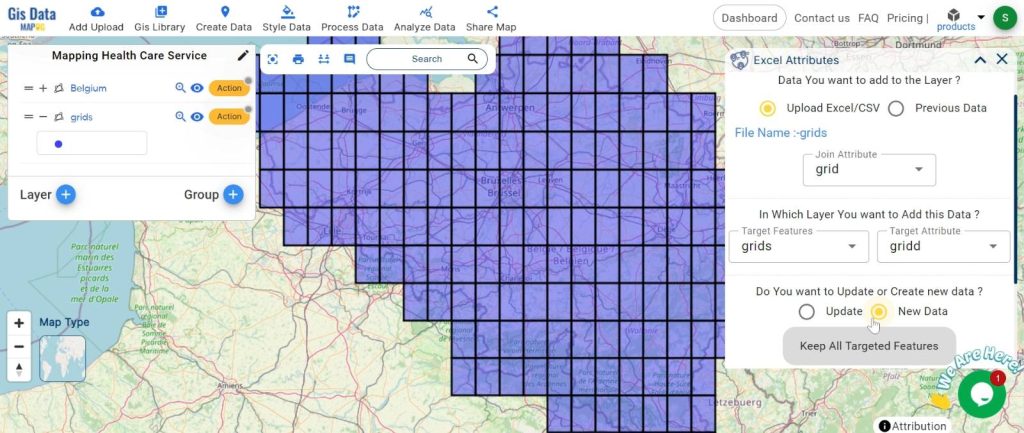
4.Select the fields and click on the “Submit” button.
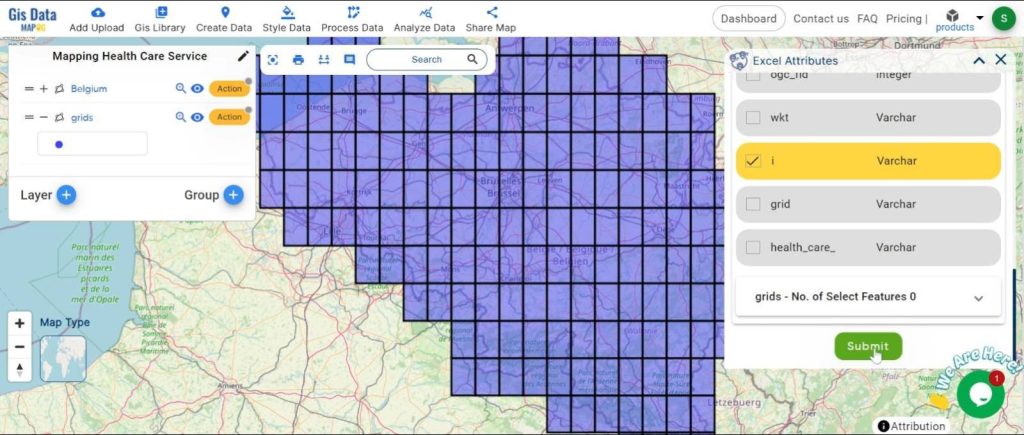
This step enriched our dataset with specific details for each grid square.
Step 5: Visualizing with Quantity Style
We employed the quantity style tool to color-code the grid based on the volume of health care services:
1.Click on the “Active” button and select “Quantity Style.”
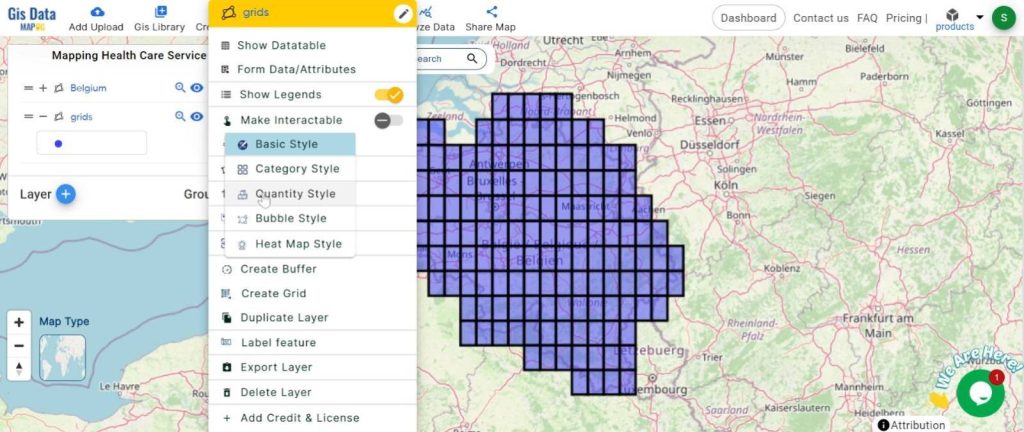
2.Set the attribute and color. Click on the “Save Style” button.
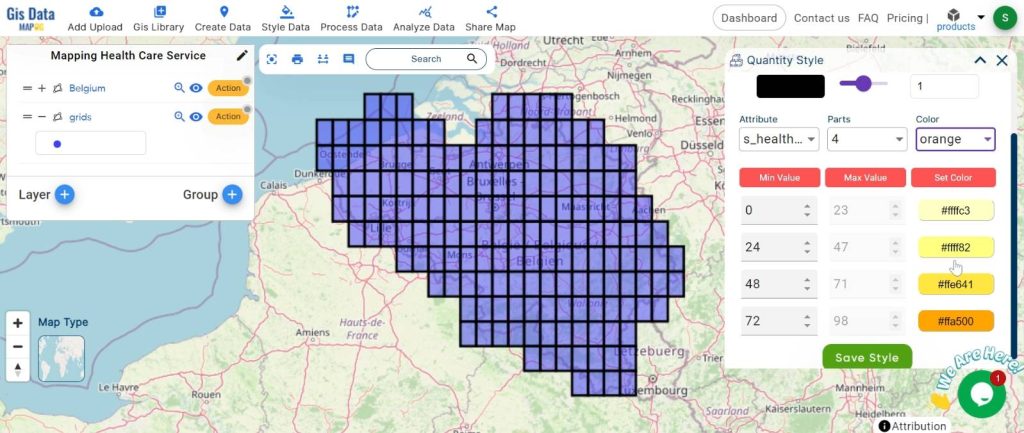
This visualization clearly illustrated the varying levels of health care services across different areas.
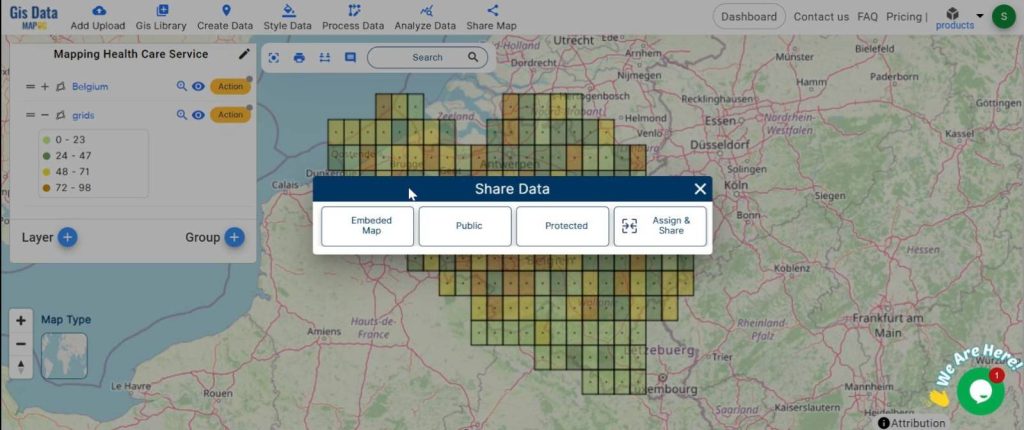
Step 6: Sharing the Map
we shared the map with stakeholders using MAPOG Map Analysis’s sharing tools and facilitating broader accessibility and collaboration.
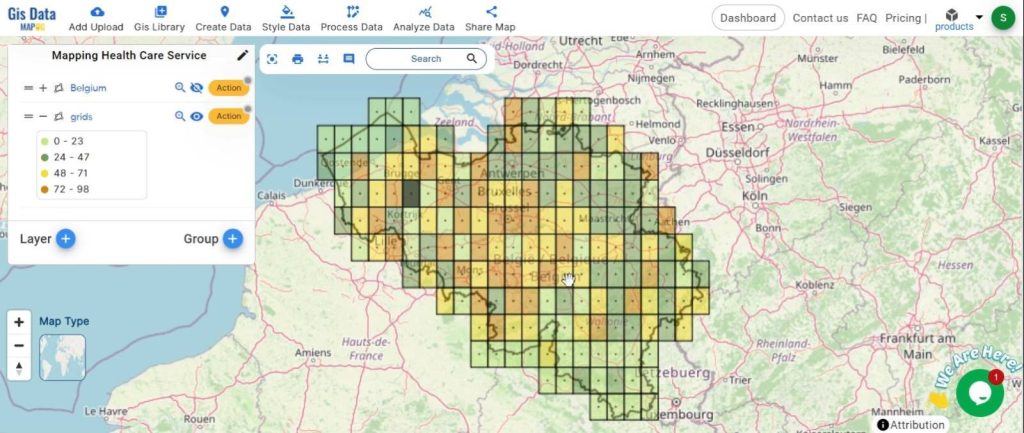
Major Findings
The analysis revealed significant disparities in health care service distribution. Some regions had Sample facilities. others were lacking, highlighting a need for better resource allocation and planning.
Domain and Industry
This grid-based GIS method is relevant to the health care sector and urban planning. It provides essential insights for policymakers, health care administrators, and urban planners, aiding in the effective allocation of resources and strategic planning to improve health care accessibility and quality
The grid-based GIS approach using MAPOG Map Analysis proved instrumental in mapping health care service distribution. It offered a detailed, clear picture of areas that are well-served and those in need of more attention. This method is invaluable for planning and improving health care services, ensuring that resources are allocated efficiently and equitably across regions.
Link of the Data:
Explore the data further through our GIS Data product, uncovering valuable information for in-depth analysis and understanding.
Exploring Our Previous Blogs: