In the ever-evolving landscape of data analysis, the integration of disparate datasets has become paramount for deriving comprehensive insights. Today we are “Integrating Population and Literacy Data Through Attribute Join”. This process not only enhances our understanding of demographic trends but also sheds light on the educational dynamics within different population groups with MAPOG.
Key Concept:
The Attribute Join tool serves as a bridge between datasets, allowing users to seamlessly integrate them based on common attributes. In this case, population and literacy rate datasets are merged using common attributes such as State and UT. This merging process enables us to correlate population demographics with literacy levels, providing a holistic view of educational landscapes. Check our other blog ‘How to Merge Polygons in Maps‘ and the links of the data are given at the end of the blog.
Process:
Step 1:
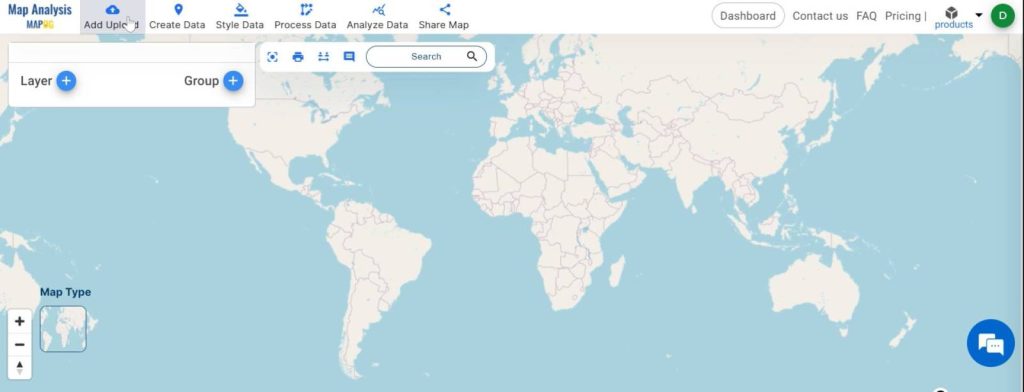
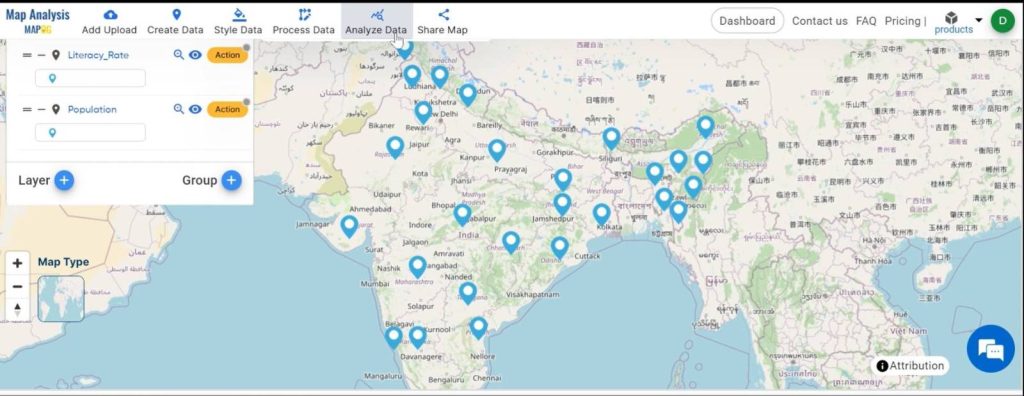
Accessing MAPOG Interface: Open the MAPOG Map Analysis interface.
Step 2:
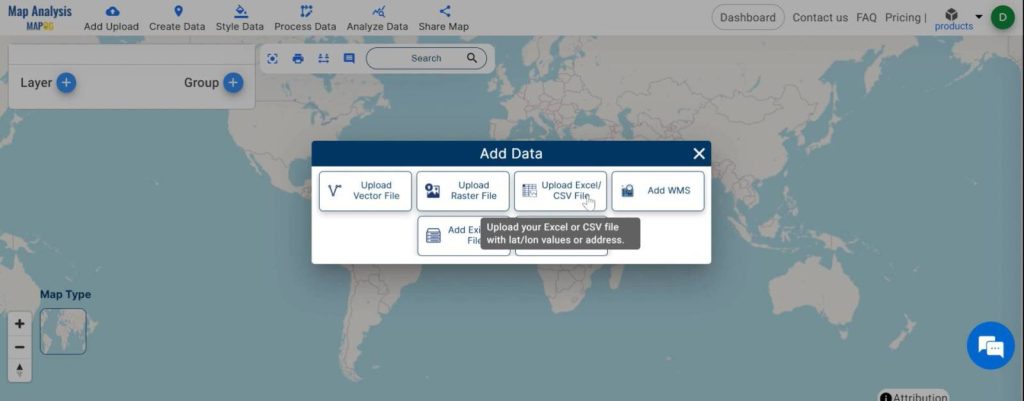
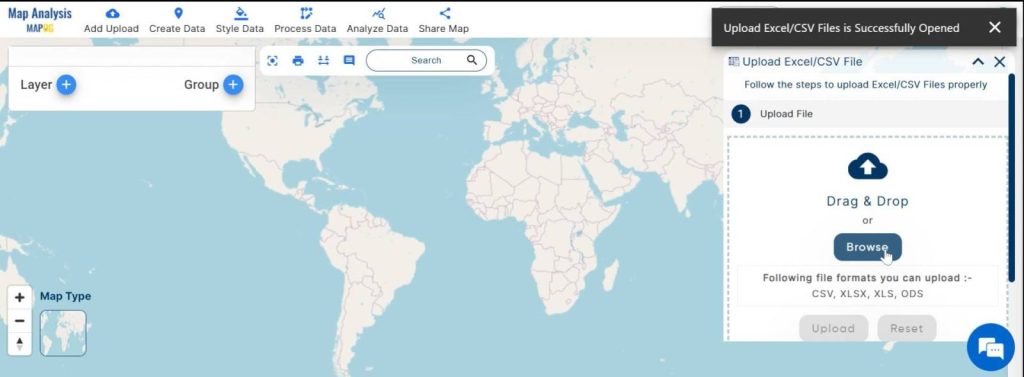
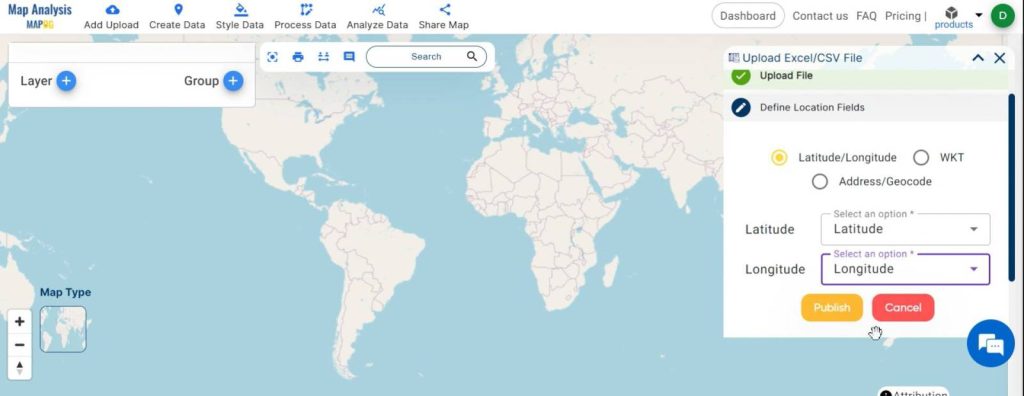
Uploading Datasets: Go to “Add Upload“, Then select ” Upload Excel/CSV files“. Browse and upload the data containing population and literacy rate data, assigning latitude and longitude values for accurate mapping. Last “Submit”.
Step 3:
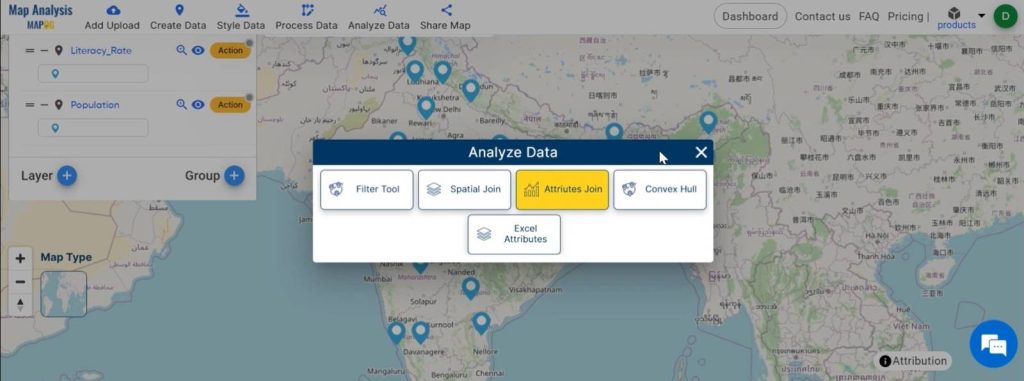
Analyzing Data: Click on “Analyse data” after uploading both datasets.
Step 4:
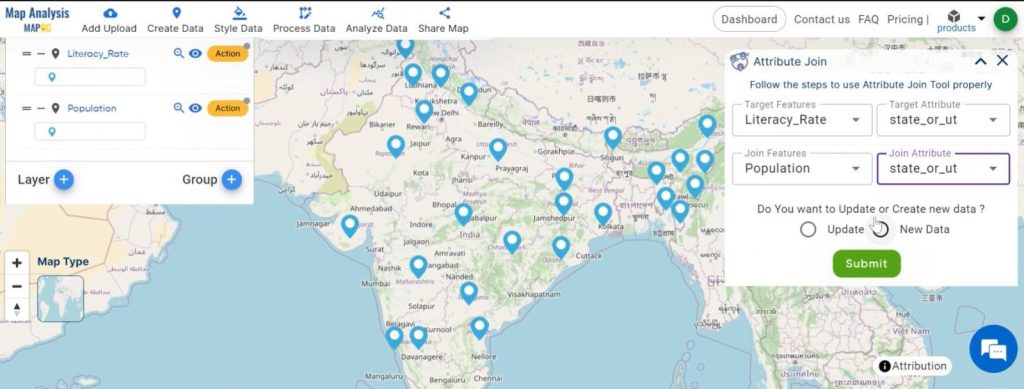
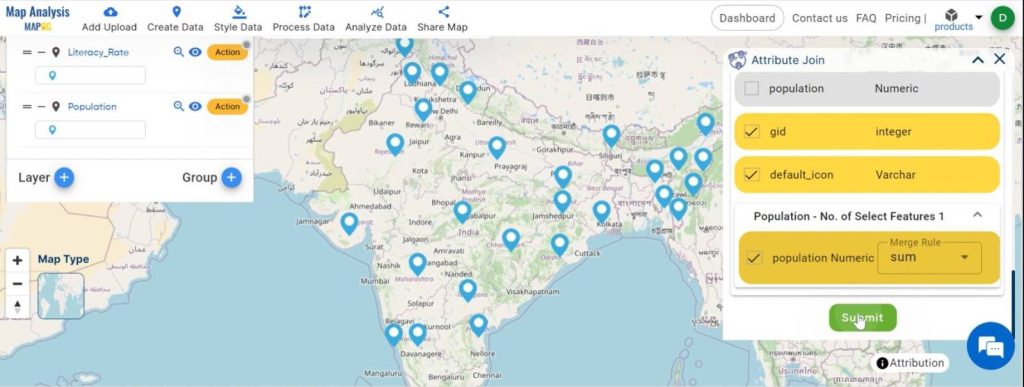
Attribute Join: Select “Attribute join” to begin the merging process.
- Choose “Target Feature” and select the corresponding target attribute (e.g., State/UT).
- Select “Joining Feature” and choose the same attribute for merging.
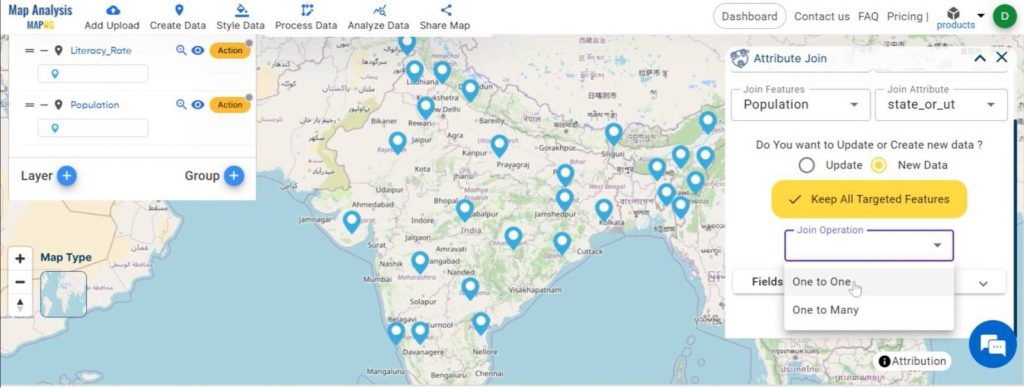
- Select the new layer option.
- Choose “Keep All Target Feature” and set “Join Operation” to “One to One.”
- Select the Field.
- After all the selections, click “Submit”
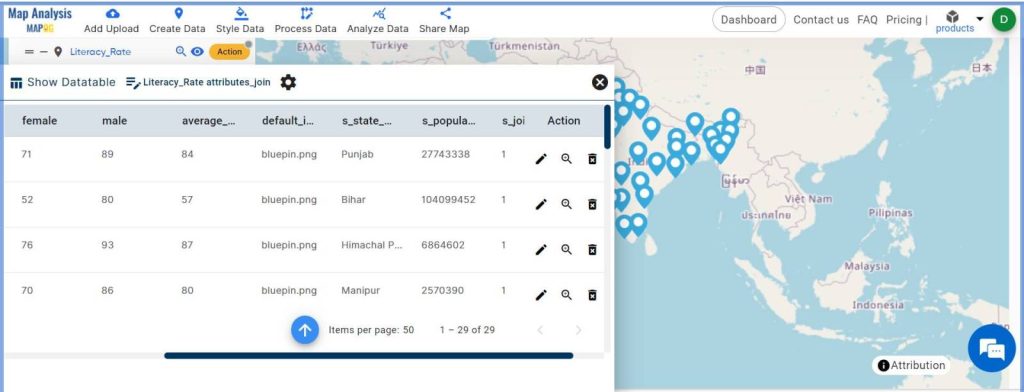
Step 5:
Viewing Merged Dataset: A new merged layer is opened now. Access the ‘Action’ button, and select “Show Data Table.” Now you can see the new merged dataset.
Major Findings:
The merged dataset provides valuable insights into the distribution of literacy levels within different population groups. By correlating population demographics with literacy rates, one can:
- Identify areas with low literacy rates.
- Target interventions to improve education outcomes.
- Make informed decisions for policy-making and resource allocation in the education sector.
Industry and Domain:
The implications of attribute joining extend across various industries, particularly in the education sector. Stakeholders such as policymakers, educators, and NGOs can leverage the merged dataset to:
- Target educational interventions effectively.
- Allocate resources based on identified needs.
- Monitor progress and evaluate the impact of interventions over time.
Conclusion:
Attribute join, facilitated by tools like MAPOG, offers a powerful means to integrate and analyze disparate datasets. By merging population and literacy rate data, we gain invaluable insights into education levels within different population groups. This information is instrumental in driving informed decision-making processes and fostering positive societal outcomes. As we navigate the complexities of data analysis, tools like Attribute Join empower us to unlock deeper insights and drive meaningful change.