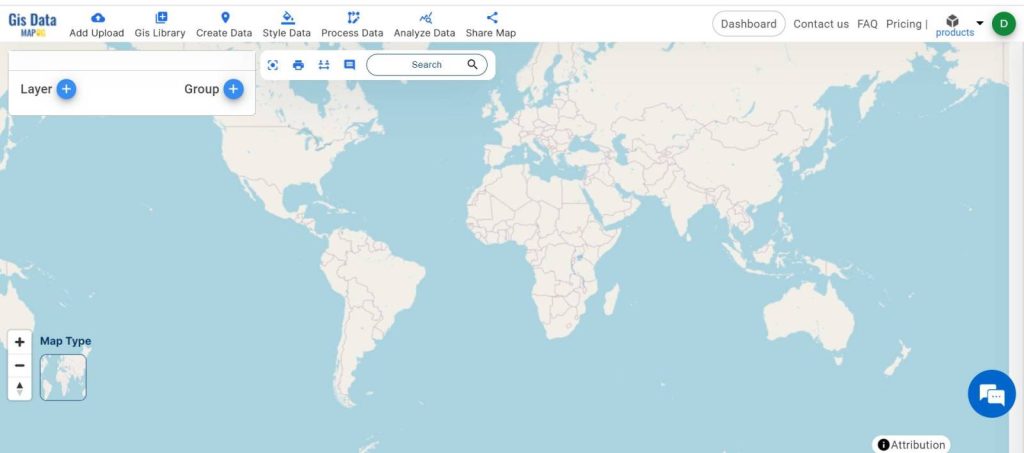
MAPOG stands at the forefront of innovation in the real estate industry, offering a sophisticated platform designed to streamline market analysis and aid in strategic decision-making. Leveraging the power of GIS technology, MAPOG provides real estate professionals with visually intuitive representations of land prices, empowering them through “Land Price Mapping: Insightful Visualization“.
Key Concept For Land Price Mapping:
At the heart of MAPOG lies the integration of GIS technology with real estate data, facilitating a comprehensive understanding of land prices. Through advanced spatial analysis, MAPOG unveils hidden patterns and trends, allowing users to make informed decisions based on accurate and up-to-date information. Check out another blog Creating Quantity Style Map: Styling Natural Wealth. Find the links for the data used at the end of the article.
Process for land price Mapping
Step 1:
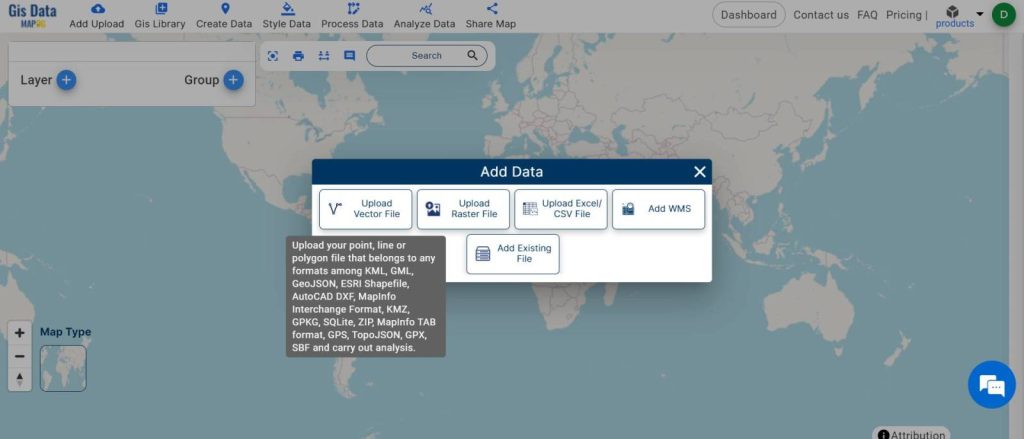
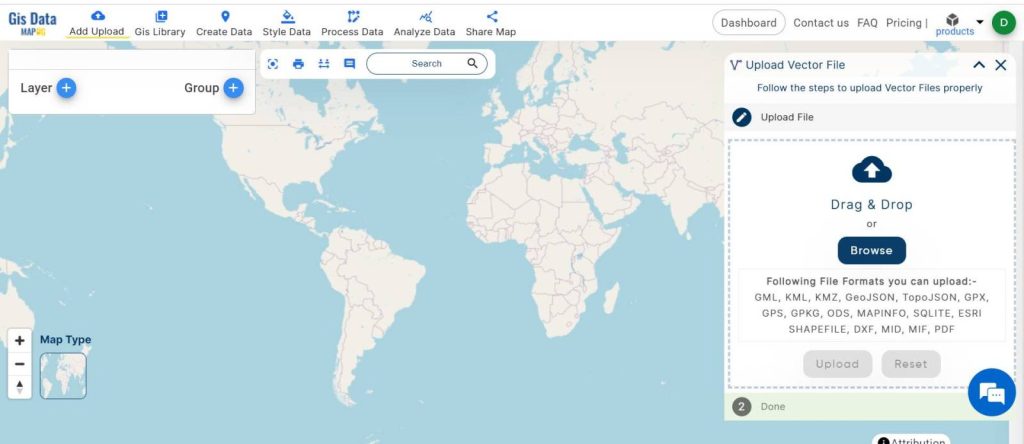
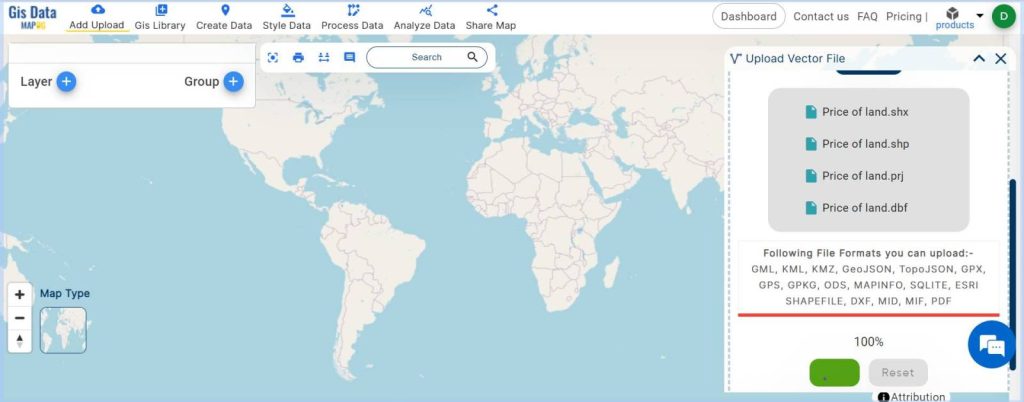
Upload Vector File: After opening the MAPOG Map Analysis interface, begin by uploading your vector file containing land price data. Navigate to “Add Upload” and select “Upload Vector File.”
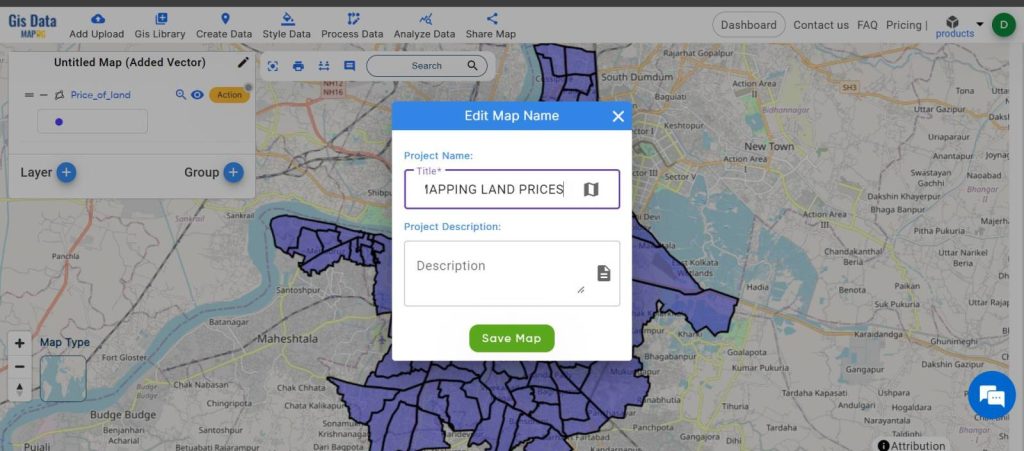
Step 2:
Name Your Map: Once the vector file is uploaded, customize your map by giving it a suitable name and saving it.
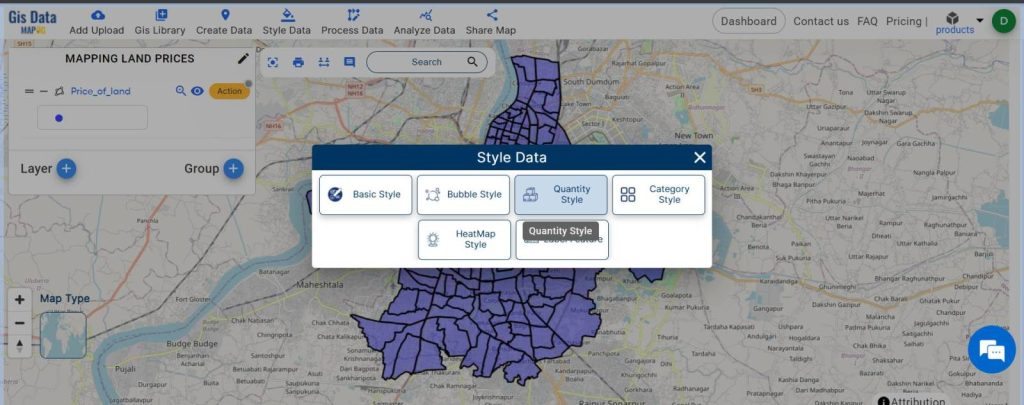
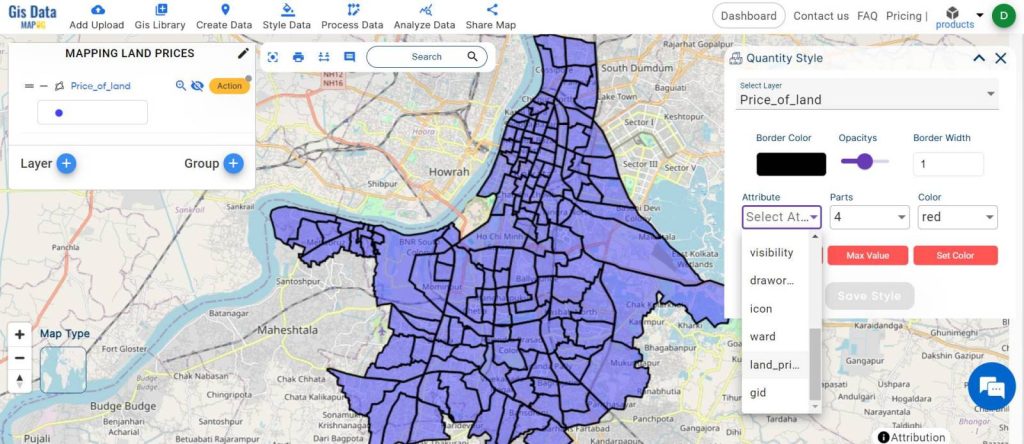
Step 3:
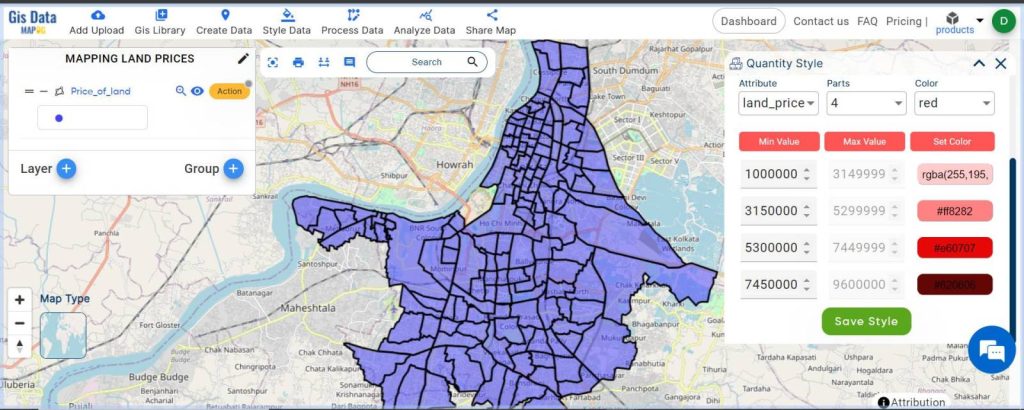
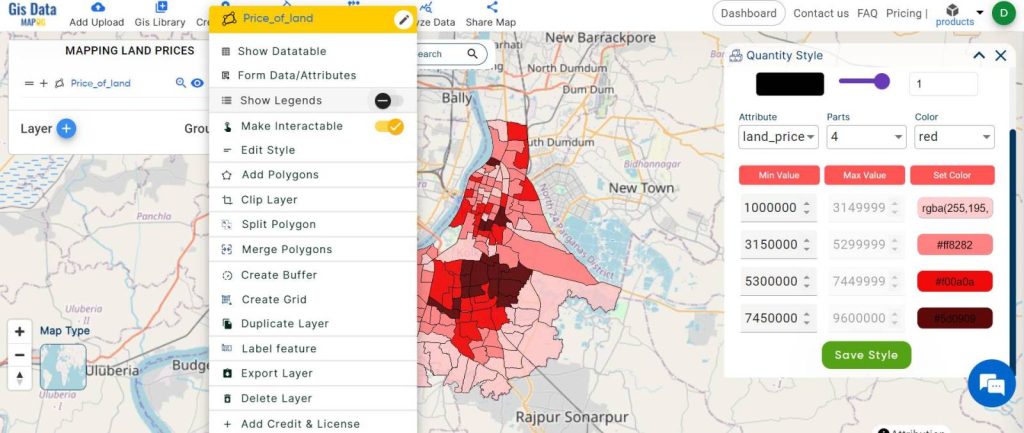
Style Your Data: Access-style data and select “Quantity Style” to visualize land prices effectively. Choose the layer first, then choose the attribute based on which the quantity style will applied. Now select parts as per your choice. Set the Color and also you can customize the color. After all these selections just click Save Style.
Step 4:
Show Legends: Display legends to provide context and aid interpretation of the map.
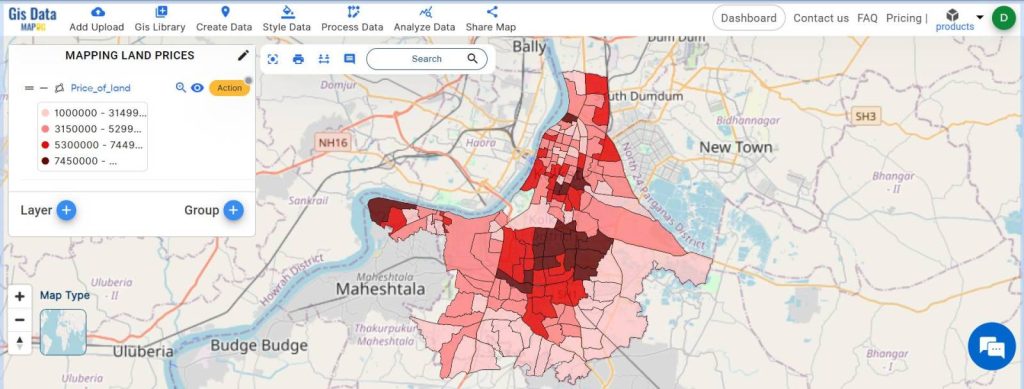
Step 5:
Explore Insights: Dive into the final output, where visually intuitive representations of land prices reveal valuable insights and trends. By integrating quantity styling, it effectively showcased the variation in land values, with darker shades indicating higher prices and lighter shades denoting lower prices.
Major Findings:
Streamlined Market Analysis: MAPOG‘s GIS-based visualization simplifies market analysis, saving time and providing accurate insights for real estate professionals.
Informed Decision-Making: MAPOG empowers professionals with insights for confident decision-making in investments and sales strategies.
Industry and Domain:
Maximized Profitability: Accurate land price analysis with MAPOG helps agencies maximize profitability by identifying lucrative opportunities and optimizing portfolios.
Enhanced Strategic Planning: Businesses can better plan and align operations with market trends using MAPOG’s intuitive representations.
Conclusion:
MAPOG offers a gateway to informed decision-making in the real estate industry, providing a comprehensive platform to understand and analyze land prices with precision. As we continue to unlock the potential of GIS technology, MAPOG remains at the forefront of innovation, enabling real estate professionals to navigate the ever-changing landscape with ease and confidence.