Embark on a journey through the intricate world of mapping annual rainfall distribution, where each droplet paints a picture of climate variation and geographic uniqueness. Leveraging MAPOG’s Map Analysis tools, we unravel the complexities of precipitation patterns with precision and clarity. Join us as we navigate the art and science of visualizing rainfall distribution, offering invaluable insights for water resource management, disaster preparedness, and environmental sustainability through Mapping Annual Rainfall Patterns. Discover how these maps serve as indispensable assets for informed decision-making across diverse sectors.
KEY CONCEPTS
Our goal is to create a map of Annual Rainfall Distribution. This map aids decision-makers in making further analyses on Water Quality Create Map for Analyzing Water Quality using Heat Map Style or Protecting Wetlands: Guide to Create GIS Map for Nature. For Demonstration purposes, we have taken the annual rainfall data of the Districts of Karnataka, India.
Steps for the Mapping of Annual Rainfall Distribution Patterns.
Below are the steps to follow to map rainfall distribution patterns in MAPOG Map Analysis.
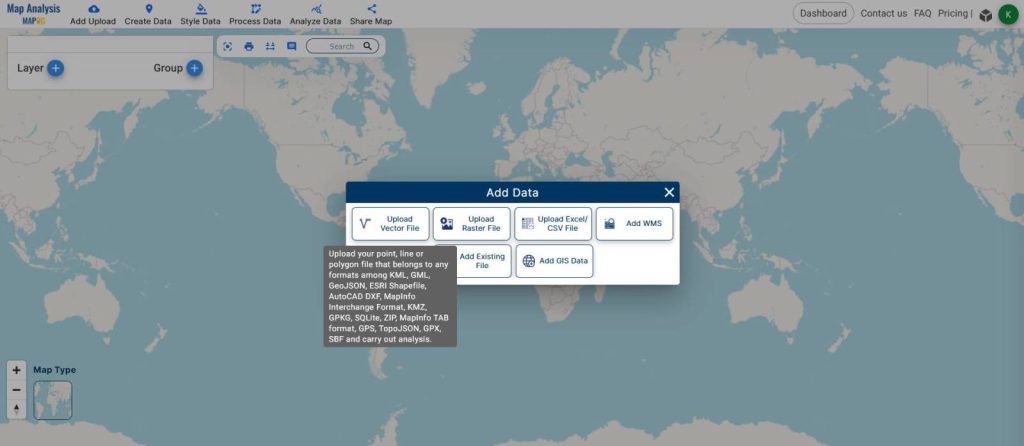
Step 01: Adding the DATA
- Click on Add Upload.
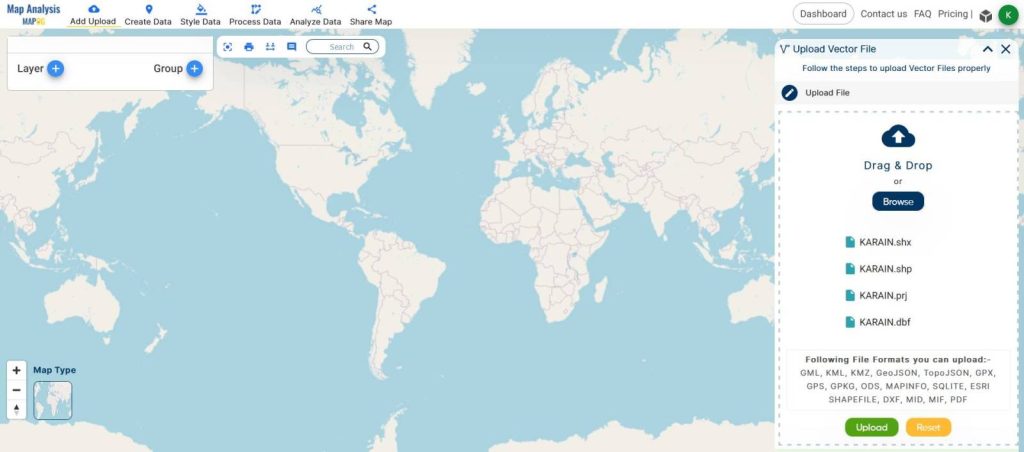
- Click Add Vector Data. This shapefile consists of the district boundaries and annual rainfall attribute data.
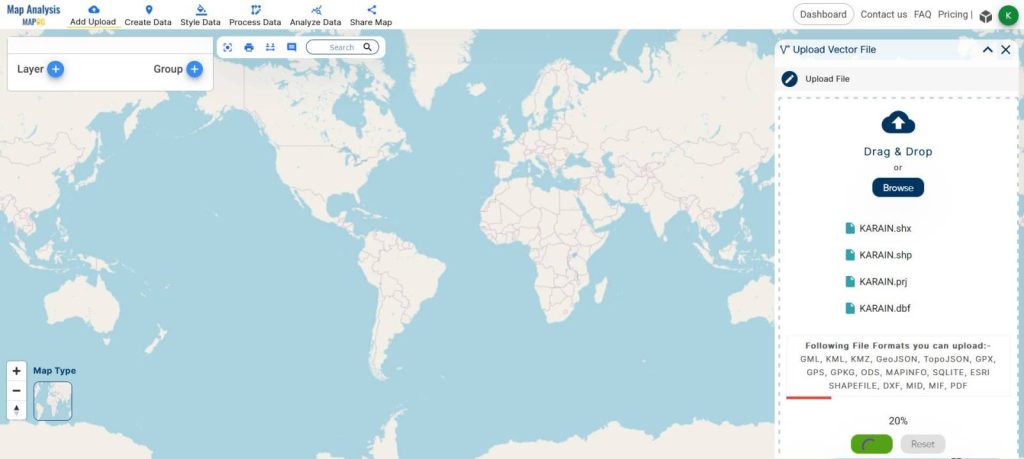
- Select your Shapefile Data and click Upload
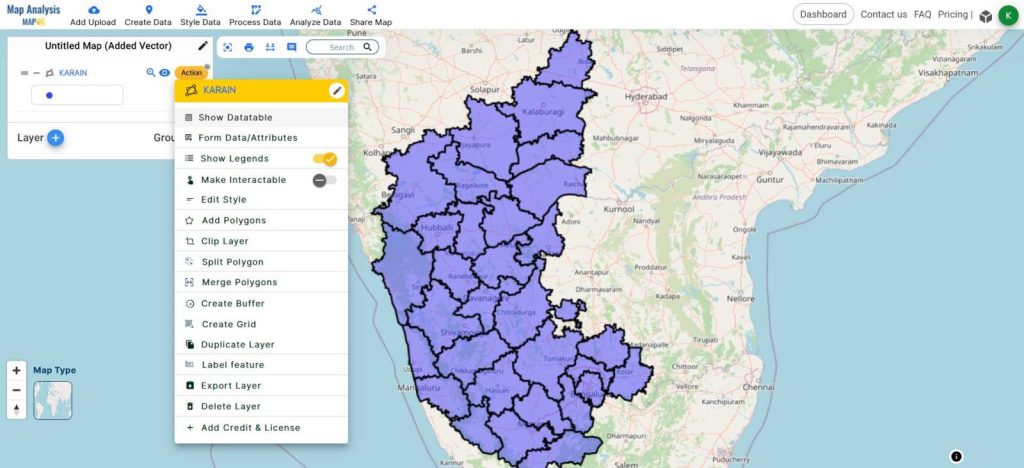
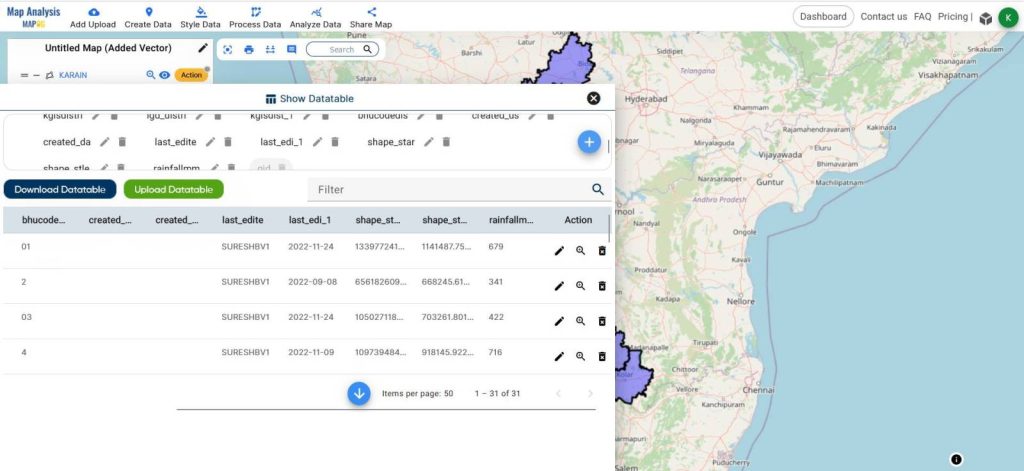
- View the data table from Actions – Show Datatable for a clear understanding of the attributes.
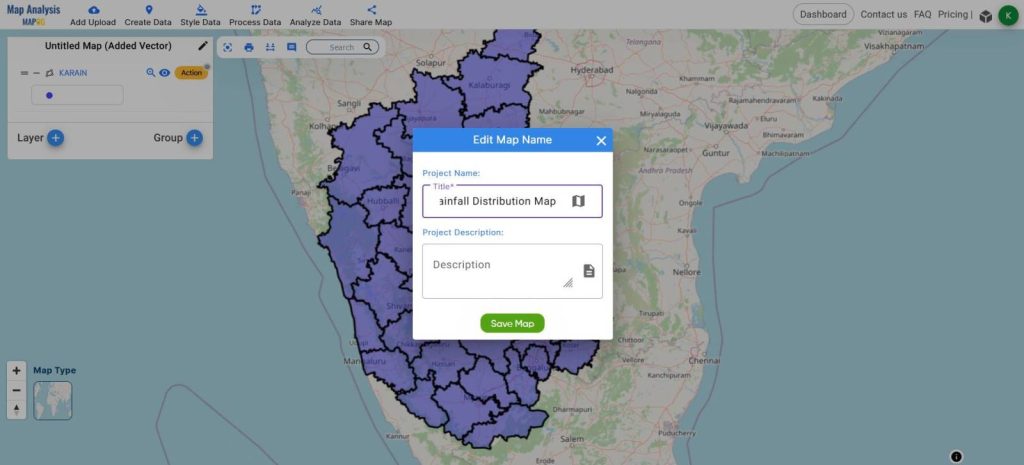
Edit the name of the Map using The Edit icon on the top left of the Layer Panel.
02: Classification / Styling.
We can classify the data using style tools with the layers and attributes in place.
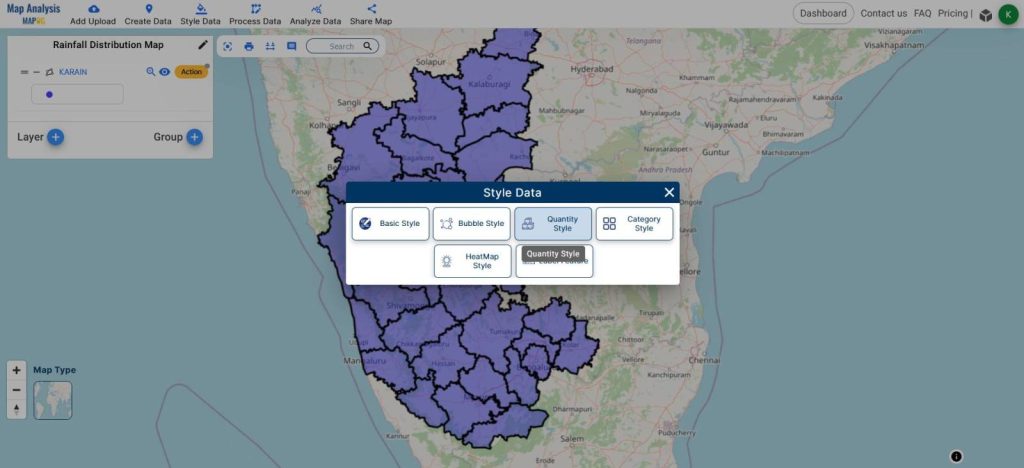
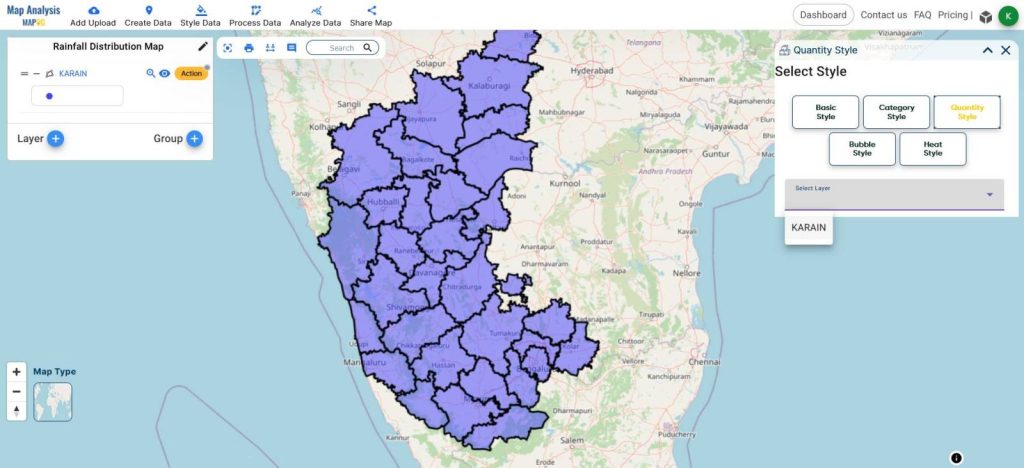
- From the Style Data tool from the toolbar, select Quantity Style.
- Select the required layer from the Select Layer option on the right side.
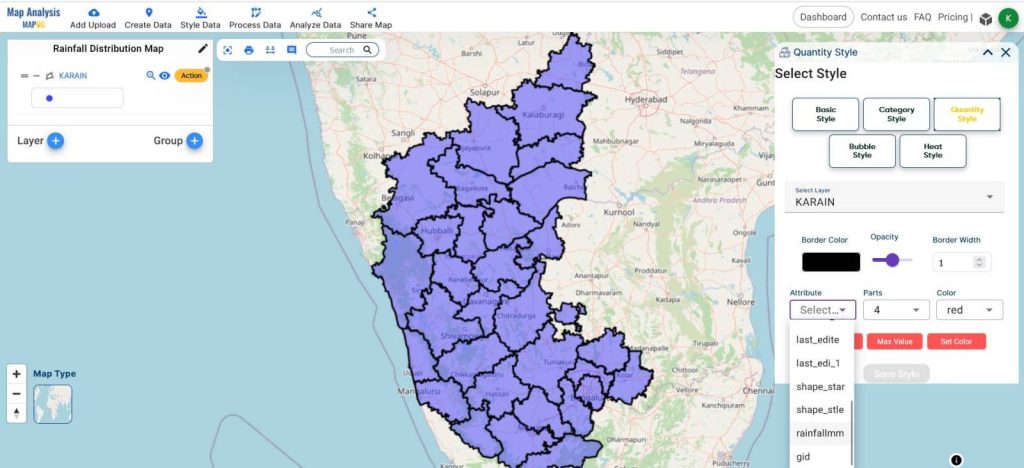
- In the attribute selection, choose the Rainfall Attribute.
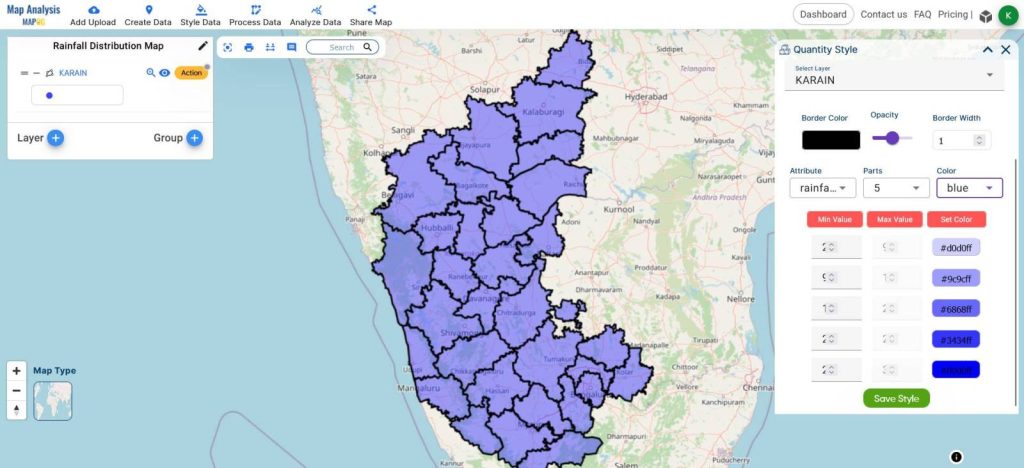
- You can divide it into parts, I will do 5 parts for this video.
- Choose the color, border width, etc., and hit Save Style.
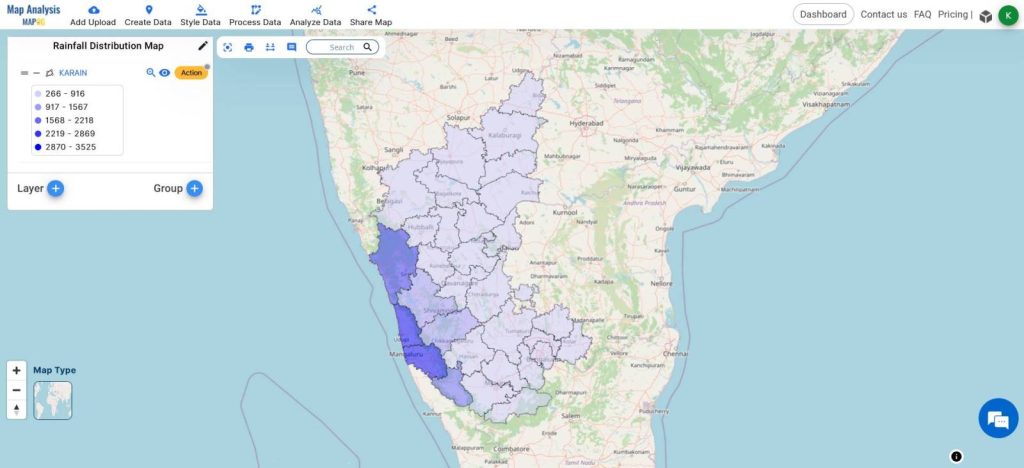
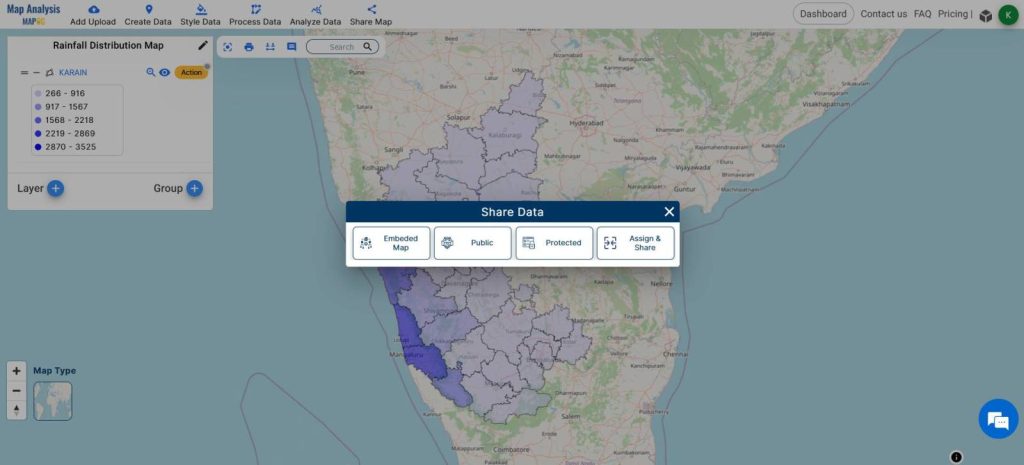
Now, the final map of Rainfall Distribution will be created. This map shows the rainfall distribution across the state, from which we can analyze that the coastal districts have received more rain compared to the inner districts. With this Knowledge, the decision-makers can plan accordingly regarding Farming, Disaster Management, etc.
You can share the final map using the share map tool.
MAJOR FINDINGS
- The MAPOG MAP ANALYSIS helps to Map Annual Rainfall Distribution Patterns.
- The Quantity Style feature classifies the districts based on the amount of annual rainfall received.
- These maps also serve as valuable tools for research, education, and community awareness, facilitating proactive measures to address climate variability and its impacts.
BENEFICIAL DOMAIN: Environmental Science, Meteorology, Water Resource Management.
Environmental Science: In environmental science, the use of MAPOG’s Map Analysis for mapping annual rainfall distribution aids in understanding the intricate relationships between precipitation patterns and environmental factors. These maps provide insights into ecosystem health, habitat suitability, and climate change impacts, informing conservation efforts and land management strategies.
Meteorology: Meteorologists rely on MAPOG’s precise rainfall distribution maps to enhance weather forecasting accuracy and predict meteorological phenomena. By integrating MAPOG’s data into weather models, meteorologists can anticipate storms, assess flood risks, and issue timely warnings to communities at risk, contributing to disaster preparedness efforts.
Water Resource Management: MAPOG’s mapping capabilities are essential for effective water resource management. Water managers use MAPOG’s data to assess water availability, plan infrastructure projects, and implement sustainable water allocation strategies. By visualizing rainfall patterns across regions, MAPOG empowers water resource managers to optimize water usage, mitigate drought impacts, and protect freshwater ecosystems.
For any inquiries or support needs, feel free to contact us at support@mapog.com to ensure seamless assistance and optimize your infrastructure protection strategies.
CONCLUSION
To summarize, our exploration into mapping annual rainfall distribution has illuminated the complex interplay between climate patterns and geographical features. Leveraging the capabilities of MAPOG’s Map Analysis tools, we’ve deciphered the nuances of precipitation distribution, offering valuable insights into water management, disaster mitigation, and environmental conservation. As we conclude our journey through the realm of rainfall mapping, let’s recognize the pivotal role these maps play in guiding informed decisions and shaping strategies for a more sustainable tomorrow.
VIEW OUR PREVIOUS BLOGS
Digitalization of Road Networks by Drawing Line on Map
Create Point, Line, Polygon on Map
Mapping Tourist Spots Reachable Within an Hour with Isochrone Maps