In today’s era of rapid urbanization and the push for sustainable transportation, the accessibility of charging stations for electric vehicles (EVs) has emerged as a critical consideration. In this article, we delve into the importance of evaluating the accessibility of charging stations, employing the powerful methodology of MAPOG MAP Analysis. By harnessing this innovative approach, we uncover key insights that can shape the future of EV infrastructure deployment and drive the transition toward greener mobility solutions.
KEY CONCEPTS
Our goal is to create a map of charging station accessibility using the points data from MAPOG GIS DATA and the Isochrone tool from MAP ANALYSIS. This map provides the areas without charging stations, by which the decision makers can analyze and make proper decisions to build one there. Isochrone tool provides multiple applications like Mapping Tourist Spots Reachable Within an Hour with Isochrone Maps and Fast Emergency Response: Using GIS and Isochrone Maps for 10-Minute Ambulance Arrival.
Steps for Mapping EV Charging Station Accessibility using Isochrone
Below are the steps to follow to create a Charging station accessibility map:
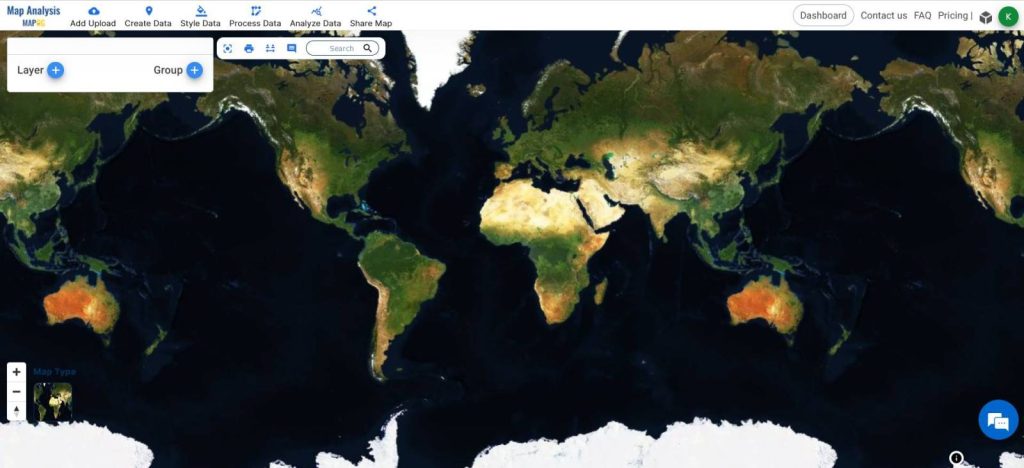
- Open Map Analysis
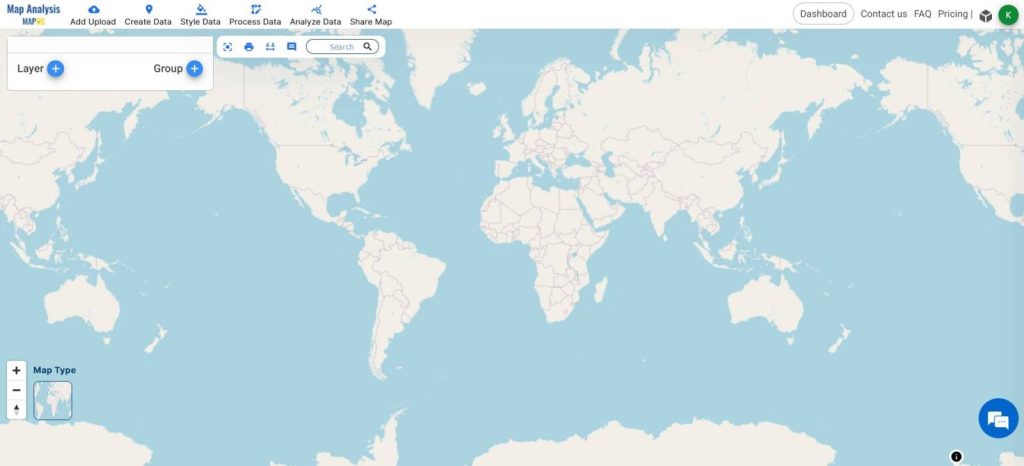
- From the different map types in MAPOG, choose OPEN STREET MAPS for this analysis

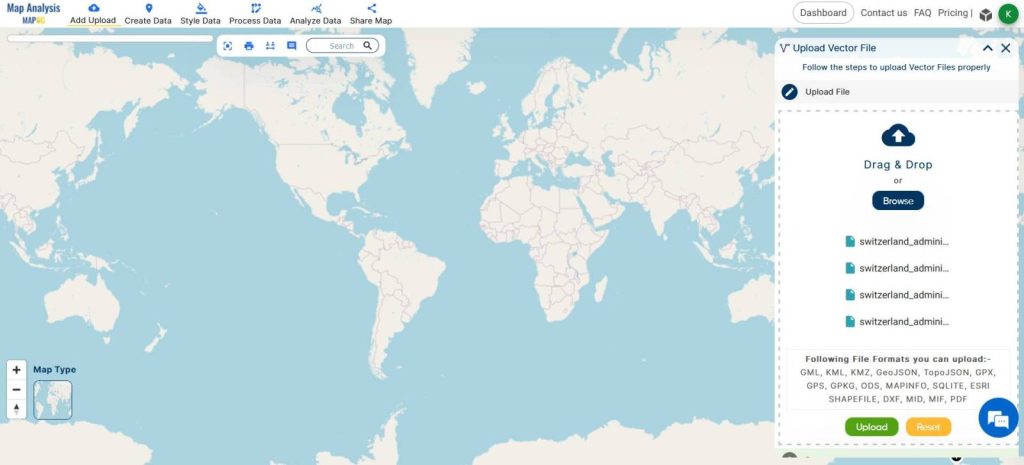
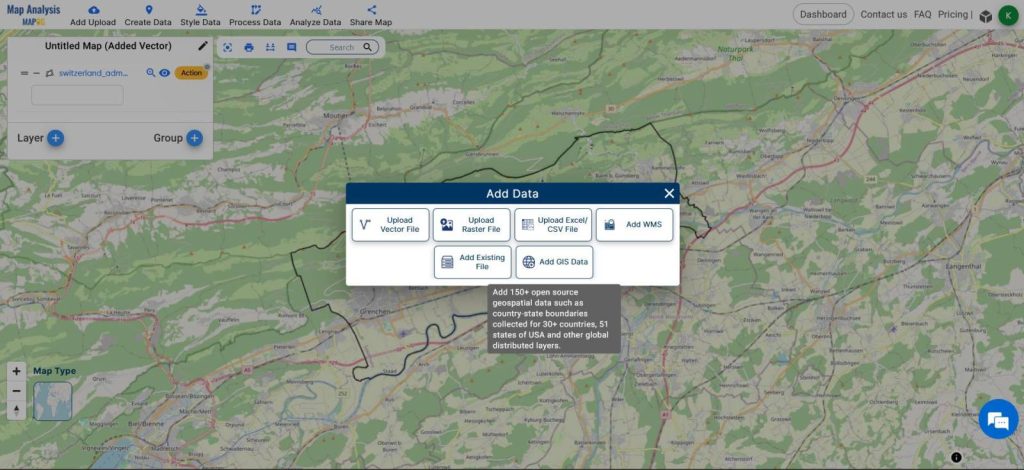
- Click Add Upload, Add Vector Data, select the boundary shapefile of your area of interest, and Upload it
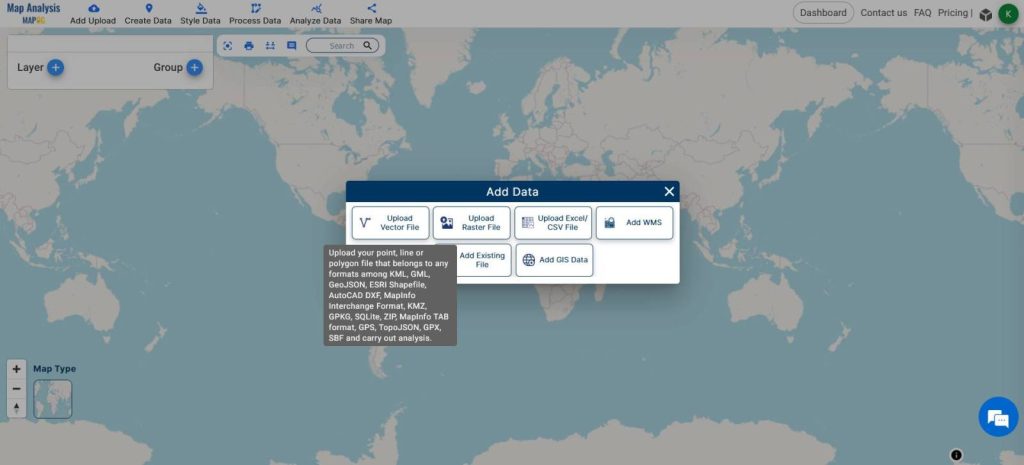
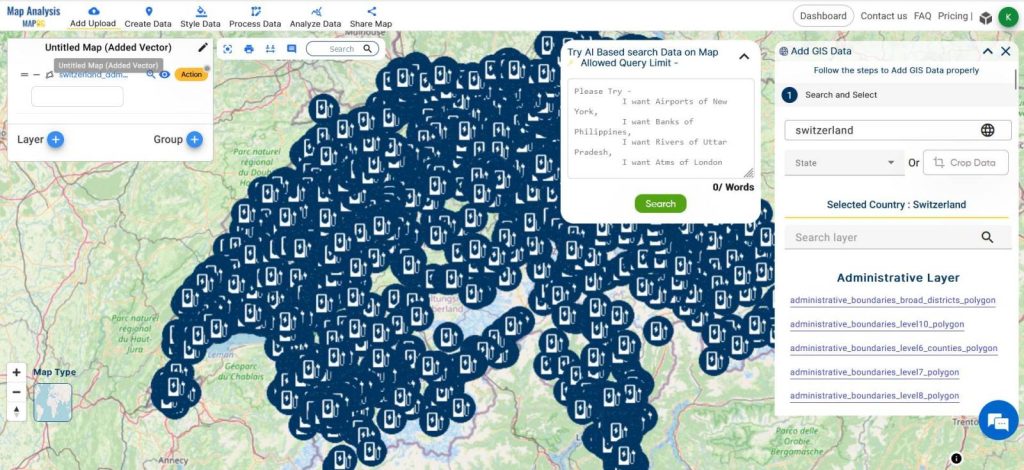
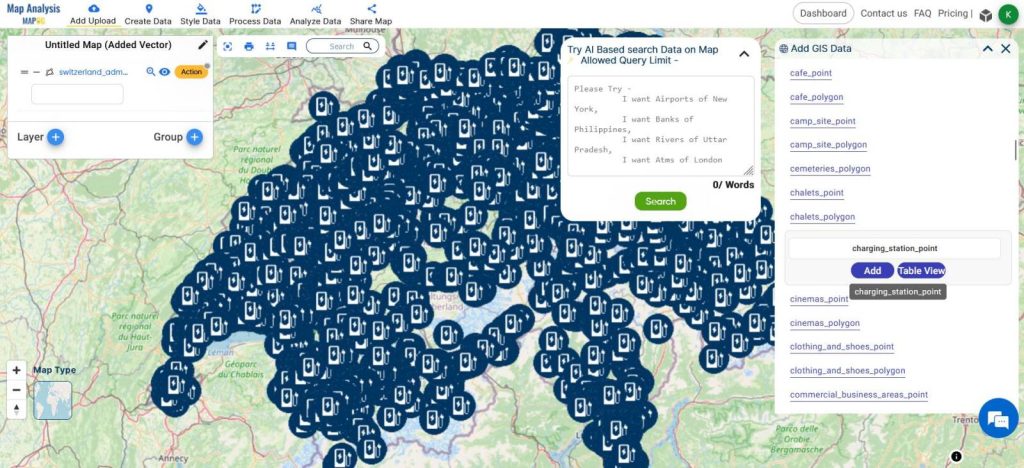
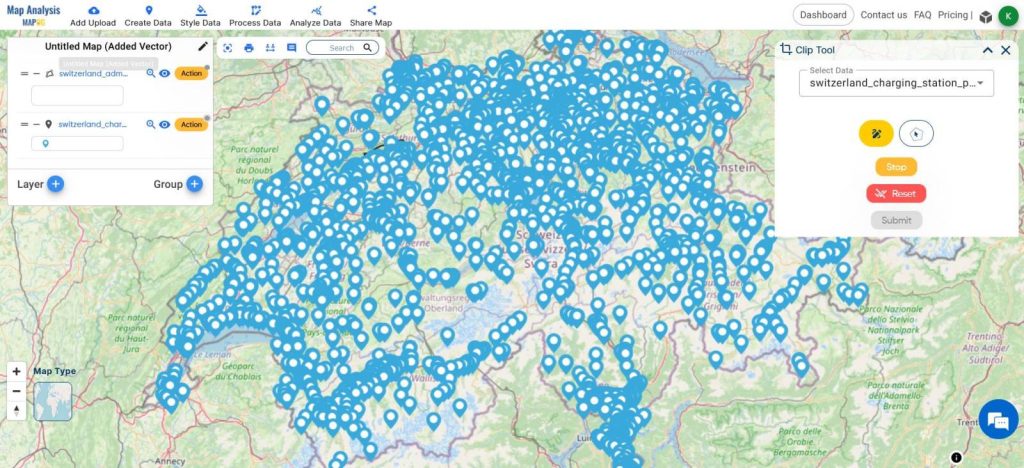
- From the Add Upload, Add GIS data, search for the country and charging station point layer, and click add.
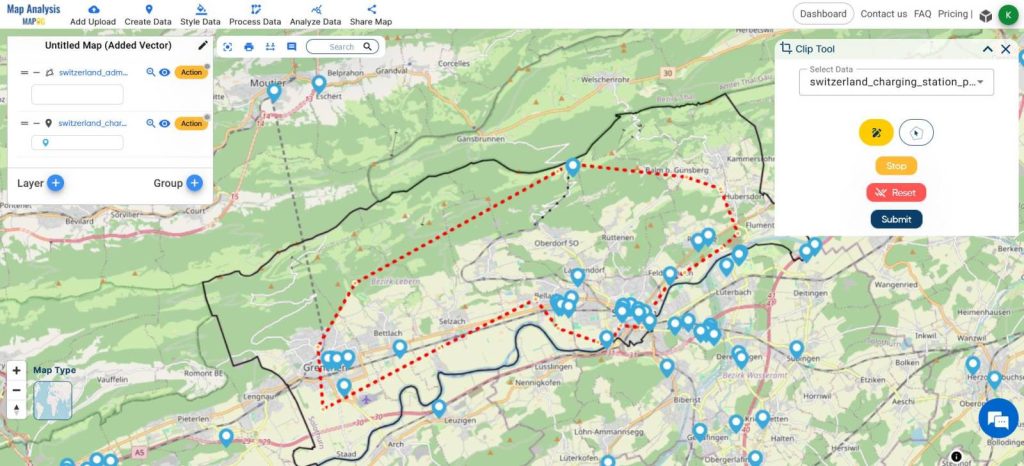
- Using the clip tool from the process data, clip the area of interest to extract the points.
- Draw a polygon around the area of interest and hit submit.
- A new clipped layer will be formed.
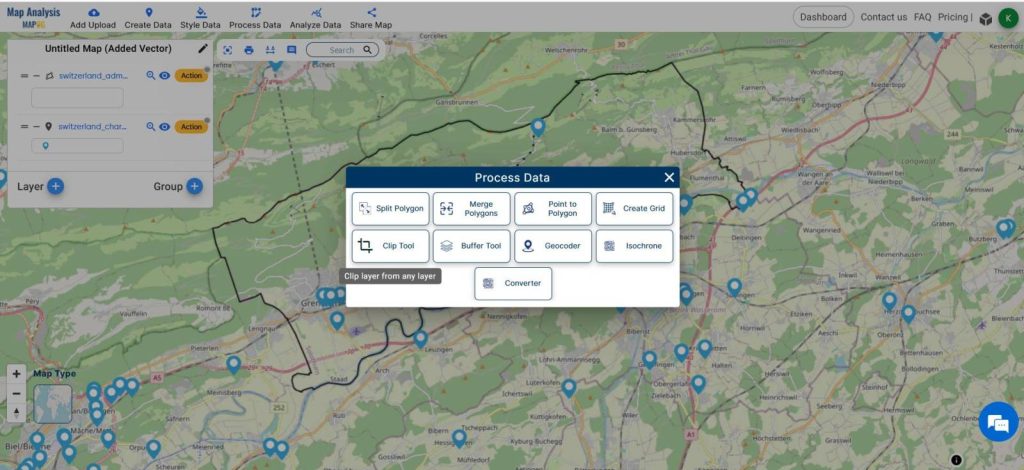
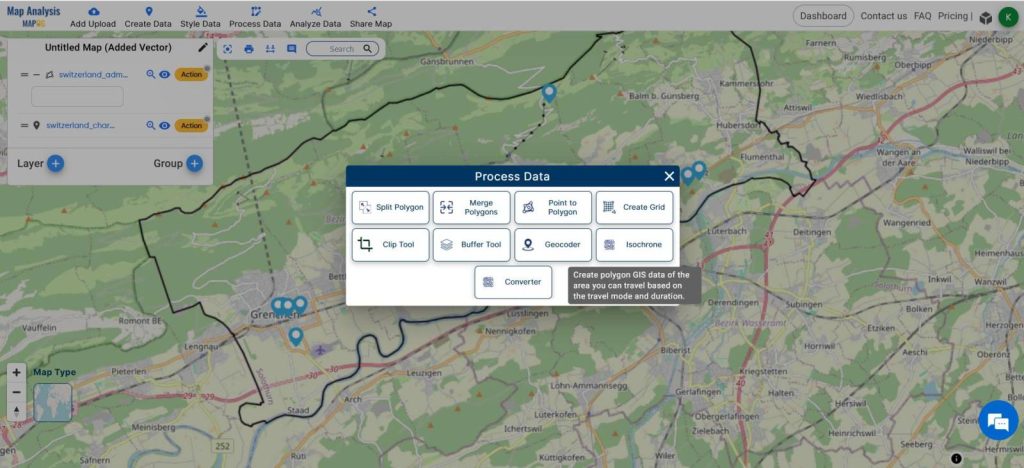
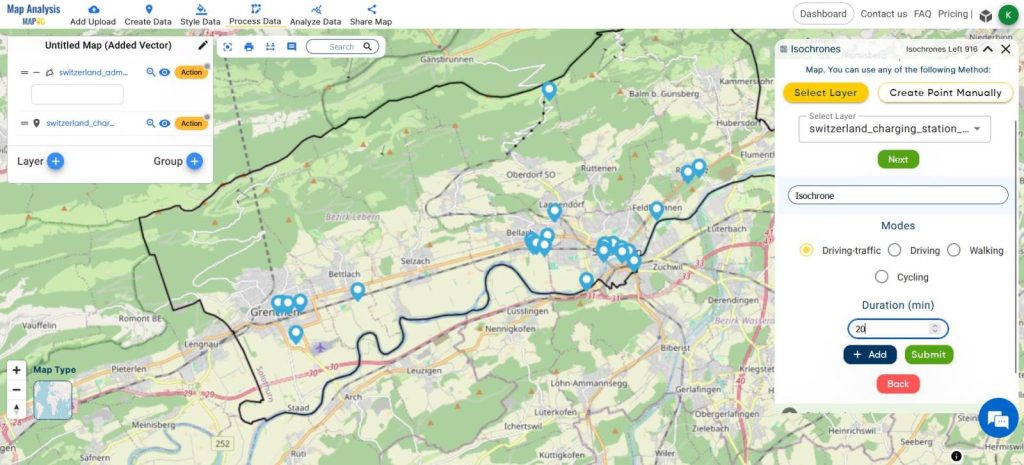
- Now, from the process data, select the isochrone tool.
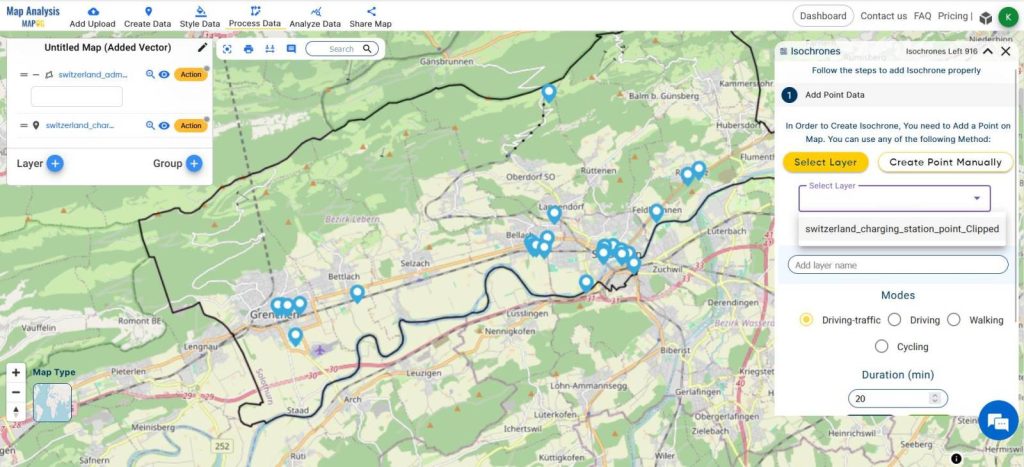
- Select the points layer.
- Give a name to the new layer.
- Select driving traffic and the time to be 20 minutes, and click submit.
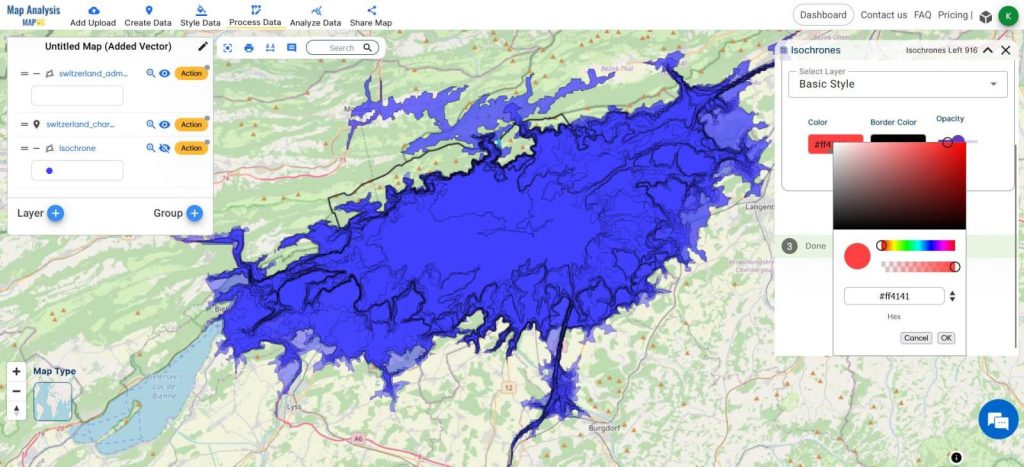
- You can customize the isochrone using the available options.
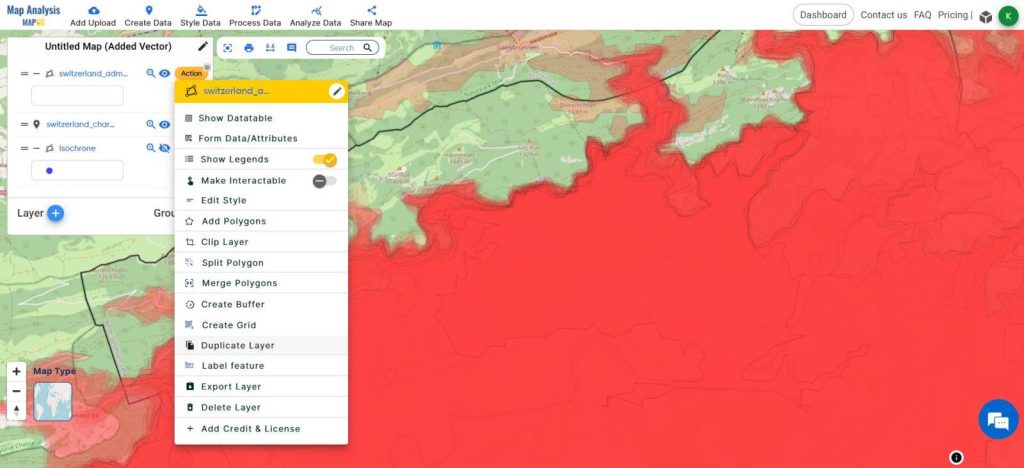
- Duplicate the boundary layer.
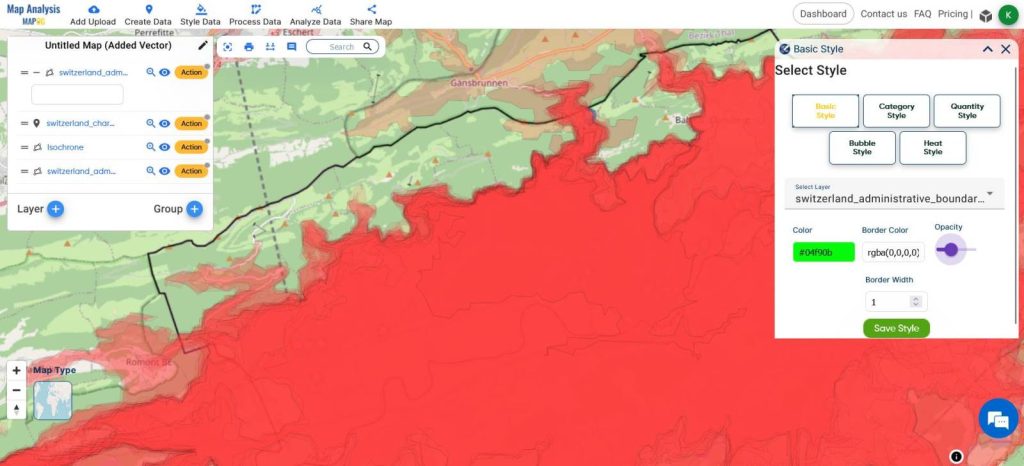
- Change the color
- Place it on the bottom to know the areas that do not have any charging points.
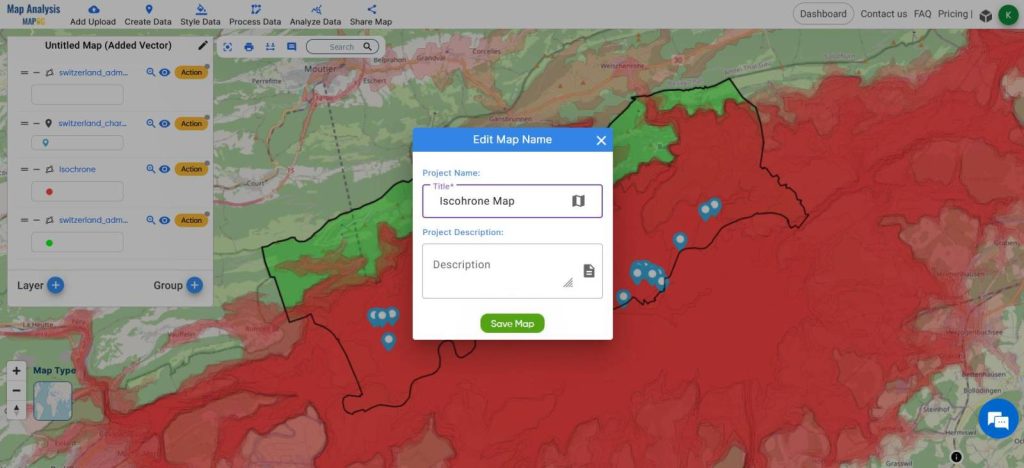
- Edit the map name by clicking on the pencil/edit icon from the top of the Layer Panel.
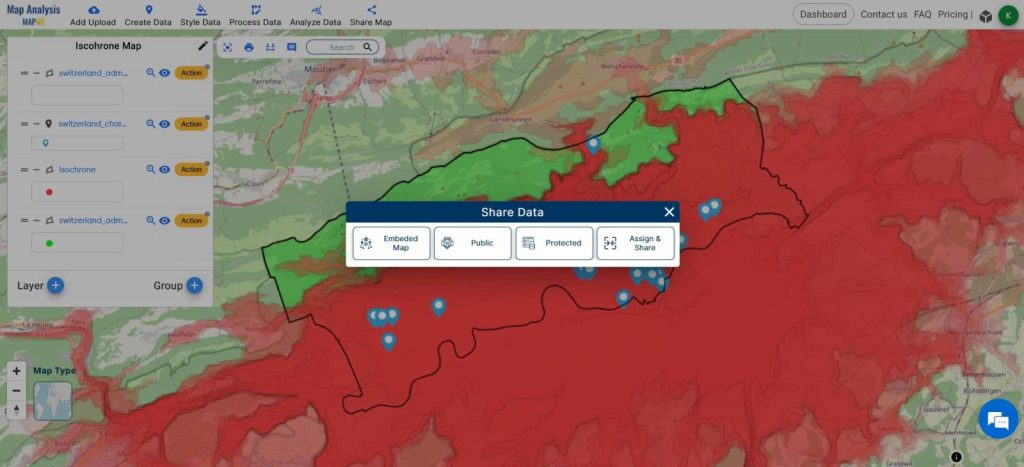
- Share the final map using the share tool.
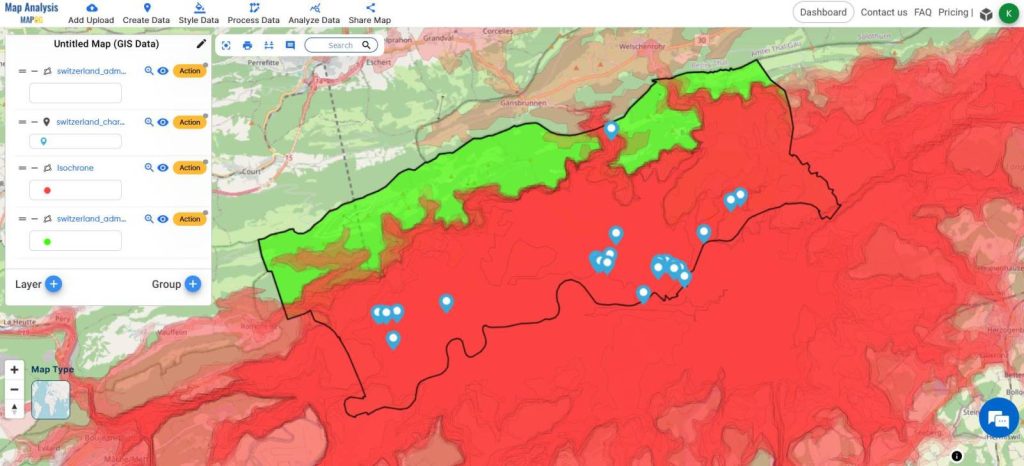
This is the Final Map in which
- Red color isochrone indicates the areas that fall under 20 minutes of drive time from the already existing charging station points, which are in blue.
- The Green color indicates the area that has no charging stations whatsoever and is vulnerable to EV drivers traveling through that area.
- Green color areas need new charging stations.
As the automotive industry shifts towards electrification, charging stations are critical for facilitating sustainable transportation and reducing dependence on fossil fuels. This helps in a sustainable green future.
MAJOR FINDINGS
- The Urban areas have greater accessibility to charging stations compared with that of Rural areas.
- Utilized MAPOG MAP Analysis to pinpoint areas with high demand for charging infrastructure, guiding targeted investment and expansion efforts.
- Isochrones provides coverage of the already existing charging stations within the 20-minute driving range.
BENEFICIAL DOMAIN: Transportation Planning, Environment Management, Urban Development.
- Transportation Planning: Charging station accessibility analysis guides transportation planners in strategically locating infrastructure, optimizing routes, and promoting sustainable mobility.
- Environment Management: Encouraging electric vehicle adoption powered by renewable energy sources mitigates air pollution and reduces carbon emissions, contributing to climate change mitigation.
- Urban Development: Ensuring equitable access to charging infrastructure fosters economic development and social equity by creating job opportunities and enhancing mobility options for residents.
For any inquiries or support needs, contact us at support@mapog.com.
CONCLUSION
Wrapping up our exploration, the findings from the MAPOG MAP Analysis shed light on the pivotal nexus between charging station accessibility and urban development. These insights underscore the imperative for strategic planning and inclusive infrastructure development to foster sustainable mobility solutions. As we navigate toward a future marked by cleaner transportation and resilient cities, leveraging these insights is paramount for steering our course toward a greener horizon.
GIS DATA USED
Switzerland Administration Boundary
VIEW OUR PREVIOUS BLOGS
Crime Data Mapping: Finding Patterns and Trends Using GIS
Plotting Airports on MAP: Simplifying Logistics and Planning
Create Map for Real Estate Developer for Best Site Selection
Strategic Logistics Mapping: Optimizing E-commerce Delivery with Isochrone Analysis