Learn how to map groundwater concentrations with MAPOG MAP ANALYSIS. In this article, we explore the transformative power of heat maps in mapping groundwater concentration. Discover how this innovative approach revolutionizes our understanding of groundwater quality and aids in the protection of vital water resources.
KEY CONCEPTS
Our goal is to create a simple and interactive map of groundwater concentrations using the Heat Maps of MAPOG Map Analysis
Learn more about the analyses using the Heat Maps here Mapping Air Quality Index: Air Pollution Monitoring
Steps for Creating a Ground Water Concentration Heat Map
Below are the steps to follow to create the map
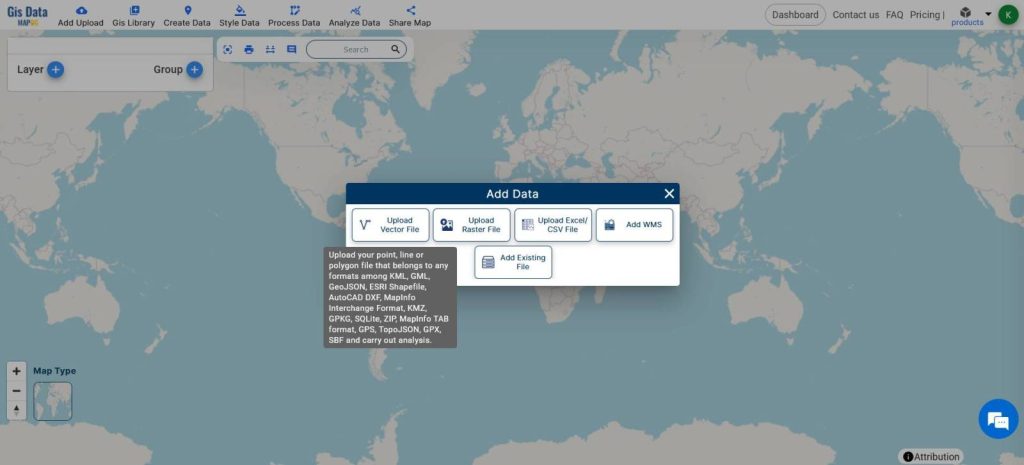
- Open Map Analysis
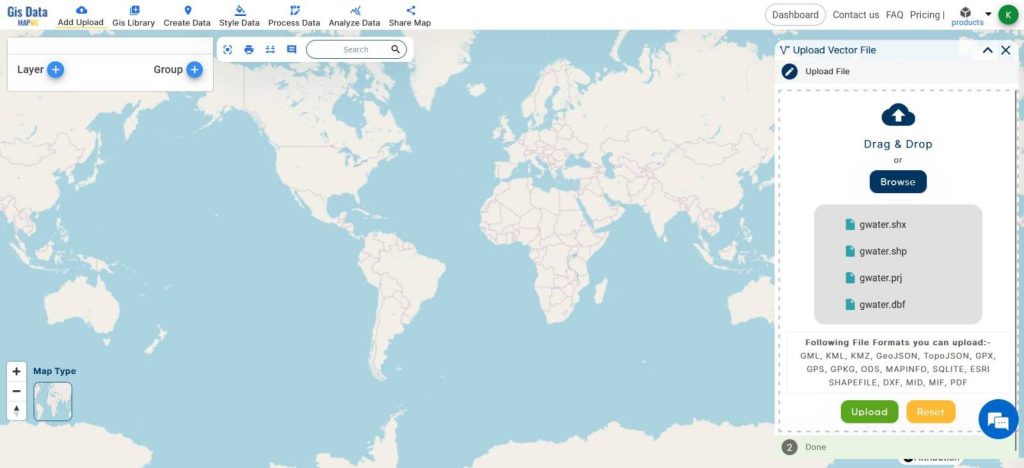
- From Add Upload, Upload Vector Files
- Upload the shapefiles containing points of Groundwater
The data used here is just for demonstration purposes only. Actual Data may vary.
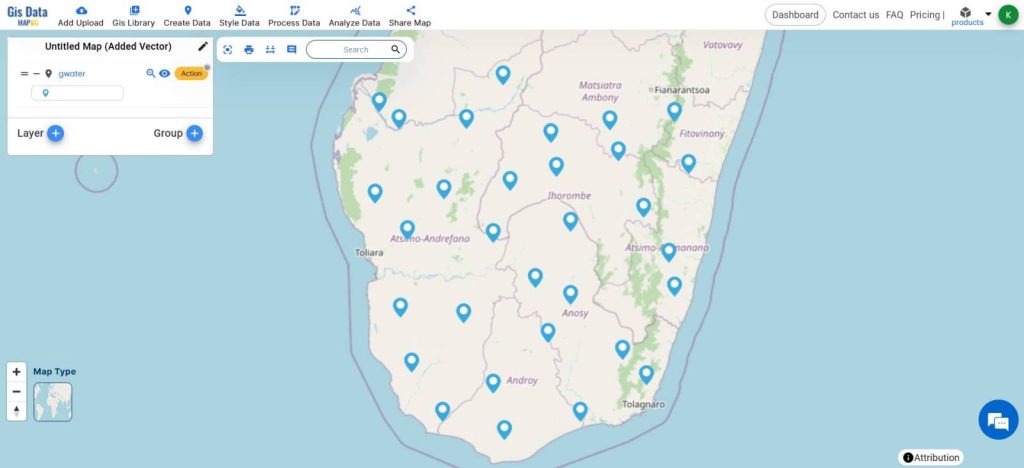
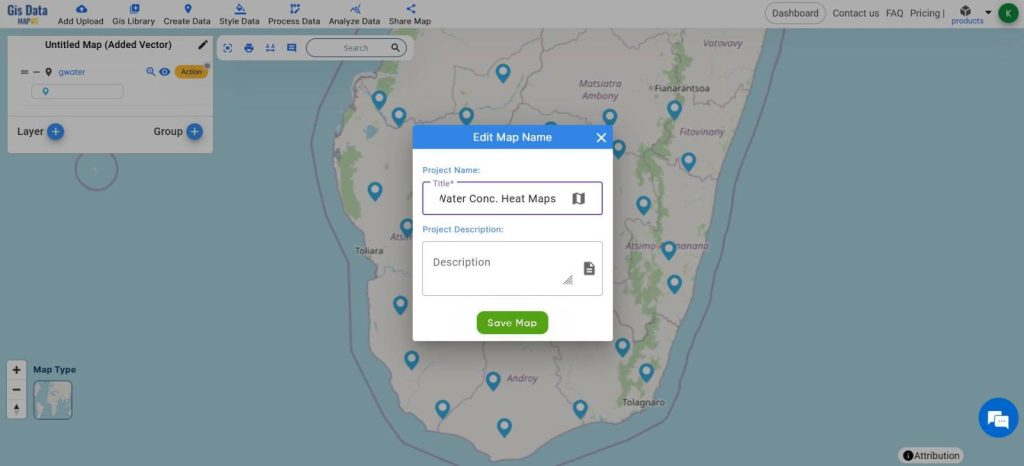
- Name your Map using the Edit icon next to the Current name above the Layer Panel
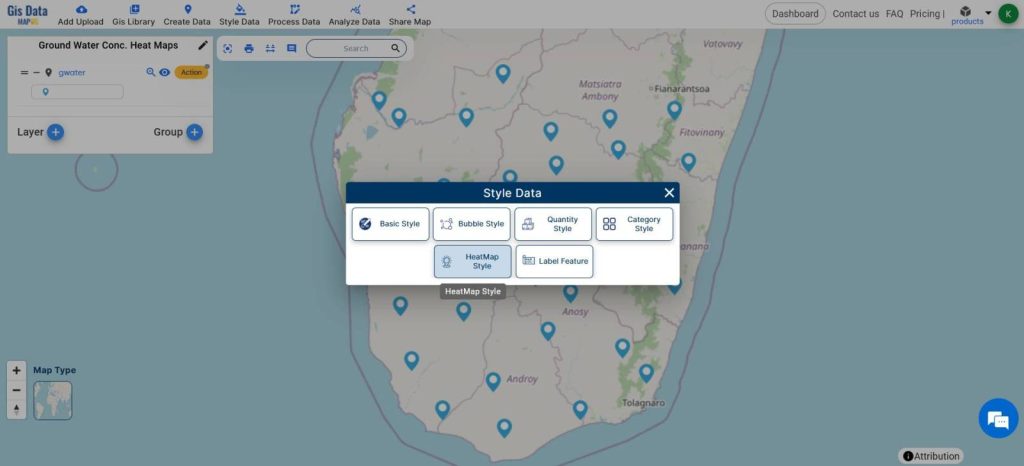
- From Style Data, click on Heatmaps
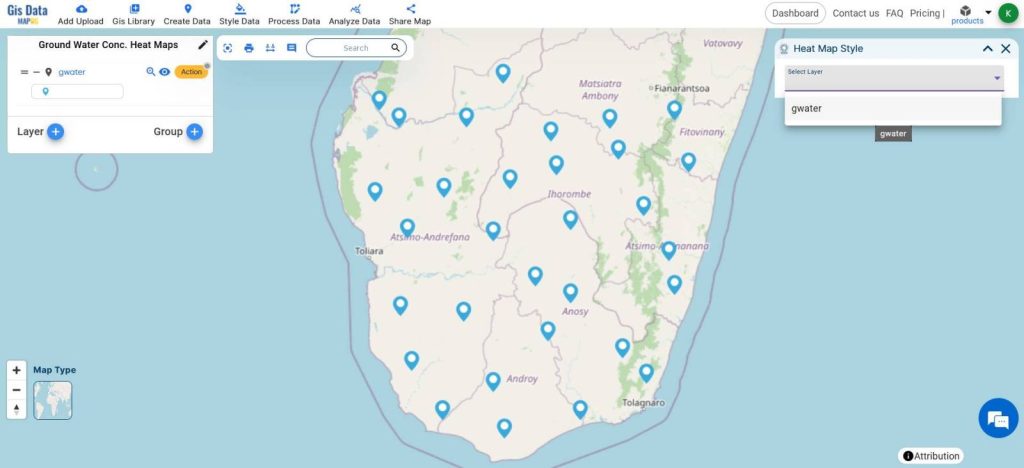
- Select the layer
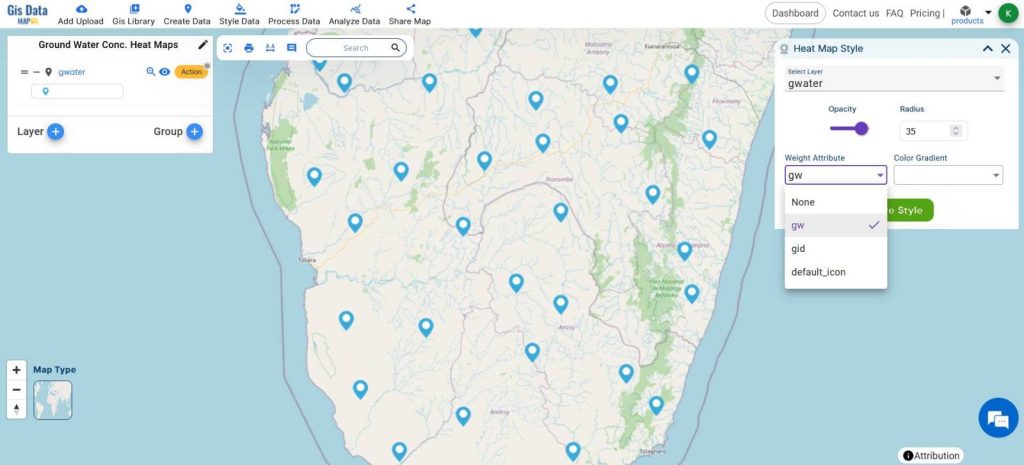
- Change the opacity and radius of the heatmap
- Choose the Attribute of GroundWater Concentration
- Click Save Style
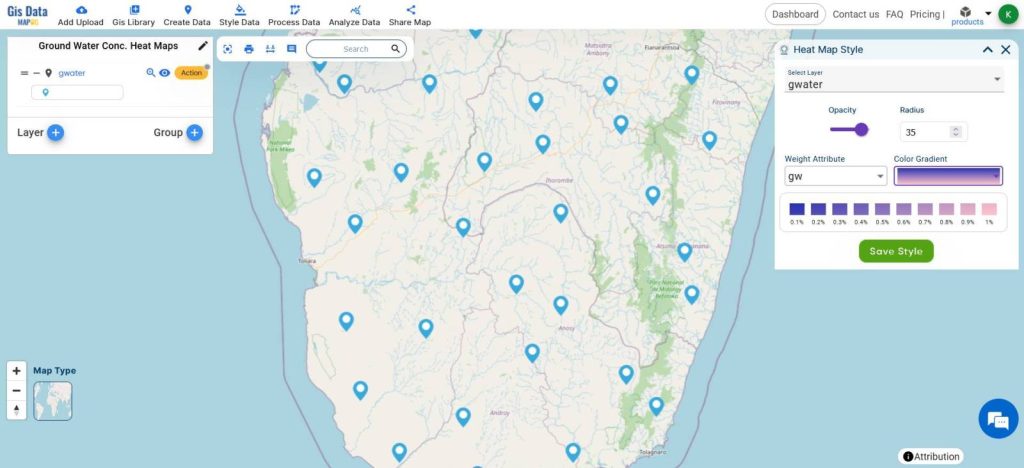
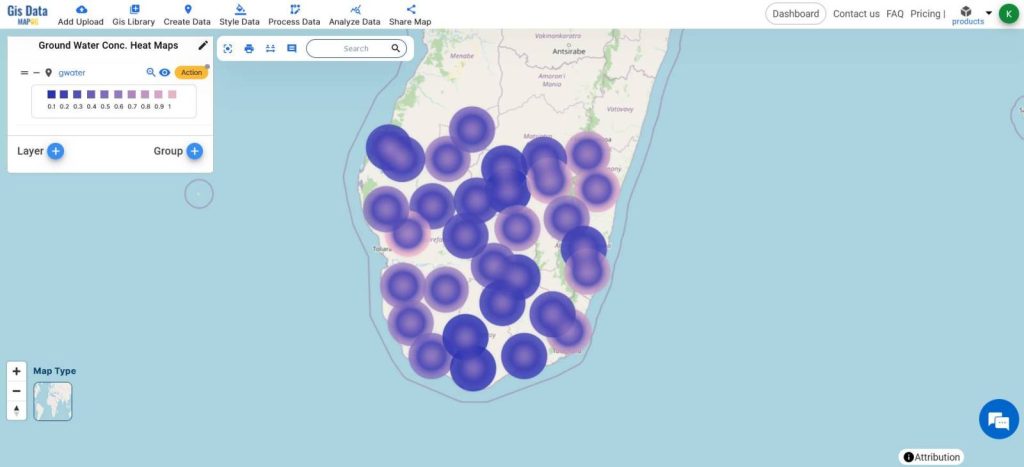
A simple and interactive heatmap of Groundwater Concentration will be created.
The bluish color shows areas with less groundwater and the pinkish colors show the areas with greater groundwater concentration respectively.

The analysis of groundwater concentration using heat maps enables efficient identification of water-rich hotspots and informs targeted remediation strategies.
MAJOR FINDINGS
- Identified Hotspots: Specific locations with elevated groundwater contamination levels were pinpointed, indicating areas needing urgent remediation.
- Spatial Trends: Patterns in groundwater concentration across the study area emerged, guiding future monitoring efforts.
- Land Use Correlation: The analysis revealed a link between groundwater levels and land use activities, underscoring the role of land management in preserving water quality.
BENEFICIAL DOMAIN: Environmental Protection and Public Health
- Environmental Protection: The analysis aids in identifying areas of groundwater contamination, facilitating targeted remediation efforts.
- Public Health: By identifying concentrated areas and trends, the analysis helps protect public health by ensuring access to clean and safe drinking water.
For any inquiries or support needs, feel free to contact us at support@mapog.com.
CONCLUSION
MAPOG map analysis emerges as a powerful tool for understanding and managing groundwater concentration.
By identifying areas with high concentration, and spatial trends, and relating it with land use,
MAPOG empowers stakeholders to make informed decisions for environmental protection and public health preservation.
VIEW OUR PREVIOUS BLOGS
Mapping Zones With Specific Farming Fields : Planning Sustainable Irrigation