Accessibility to educational institutions is a fundamental aspect of ensuring equitable education opportunities for all. Pedestrian crosspoints near Educational Institutions play a crucial role in facilitating safe and convenient access to educational institutions. MAPOG is a powerful tool for evaluating and improving accessibility infrastructure. This article explores the application of MAPOG in identifying Pedestrian Crosspoints near Educational Institutions.
Key Concept of mapping for Pedestrian Crosspoints near Educational Institutions
Proximity analysis in MAPOG distinguishes educational institutions with nearby pedestrian crosspoints from those lacking such proximity. This enables the identification of areas adjacent to educational facilities requiring additional pedestrian crossing points, highlighting regions where enhanced infrastructure is necessary. The links for GIS Data which we are using here are mentioned at the end of the article.
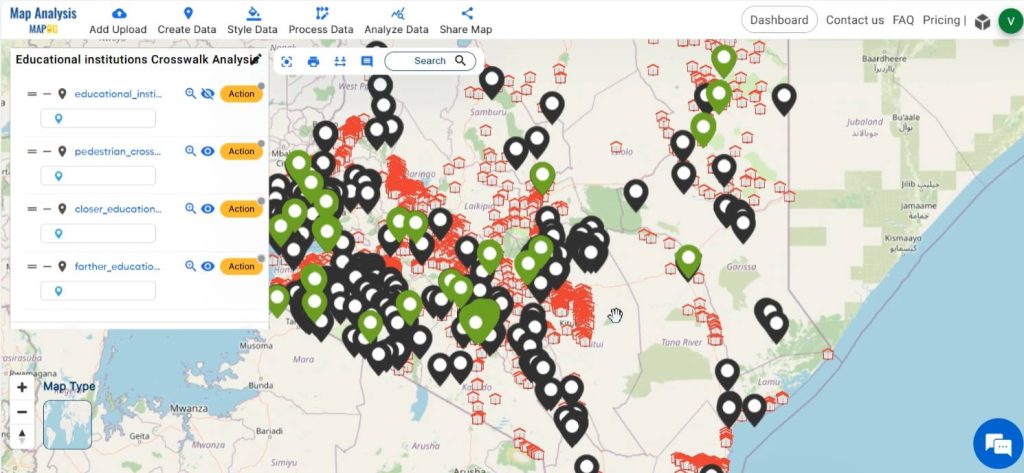
Follow the below process Step-by-step for mapping Pedestrian Crosspoints near Educational Institutions
Step 1: Open Map Analysis
Open Map analysis interface from MAPOG platform.
Step 2: Upload data
To add the required data, click on the Add Upload option from the menu bar at the upper left end, and then go to the Add GIS Data option.
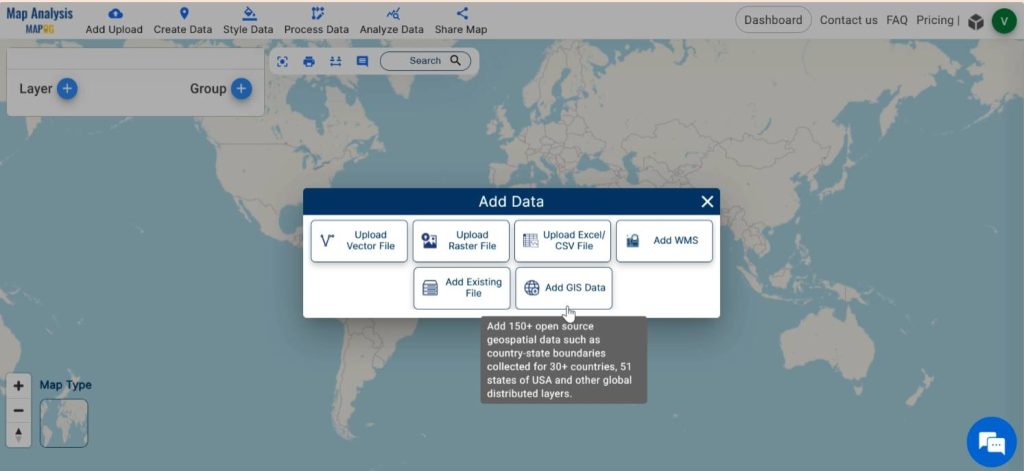
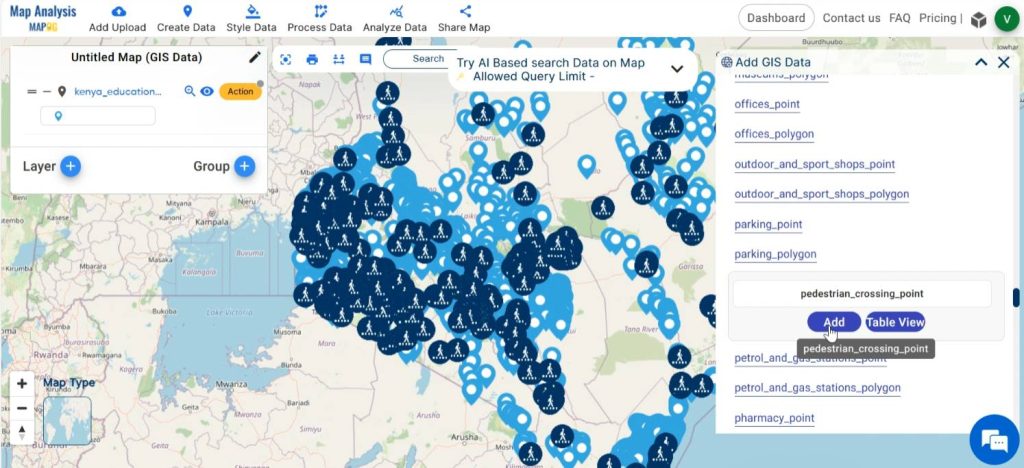
Begin by selecting your preferred country from the GIS data. Scroll down and Add education institutions point and pedestrian crossing point layers. With the Table view option preview the data table of the chosen layer.
Step 3: Save map
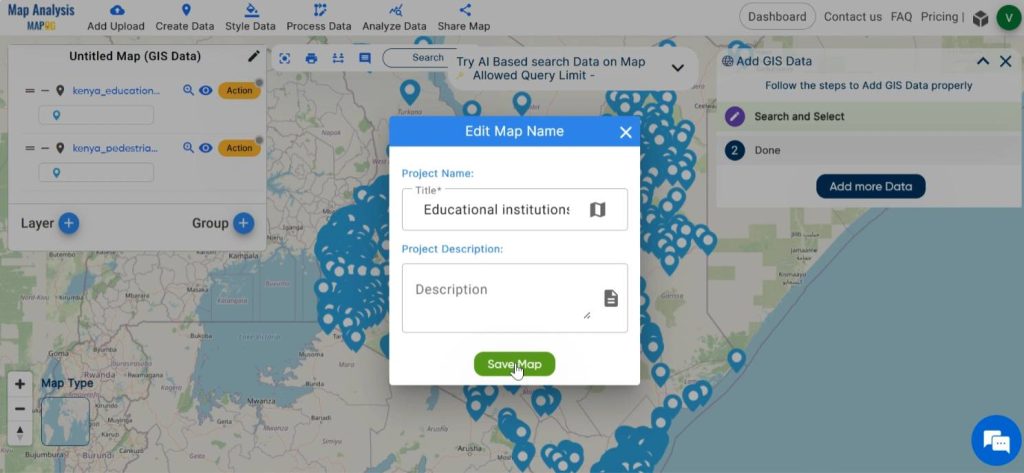
Appropriately name and save your map. For this, click on the pencil icon near “Untitled Map”. Enter a suitable name, and if desired, provide a brief description of your project. Finally, save the map by clicking on the Save Map button.
Step 4: Rename Layer
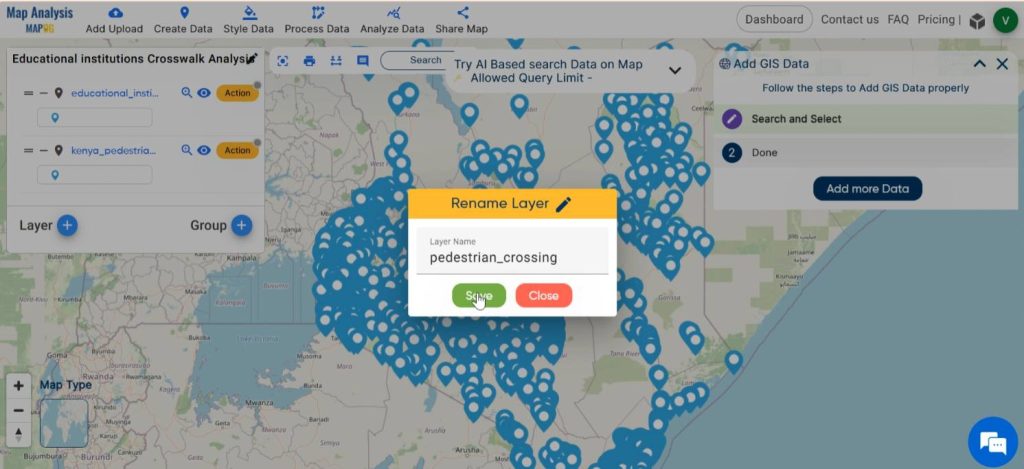
For renaming the layers, click on Action and select the pencil icon. Enter a suitable name. Then, click on save.
Step 5: Style the layers
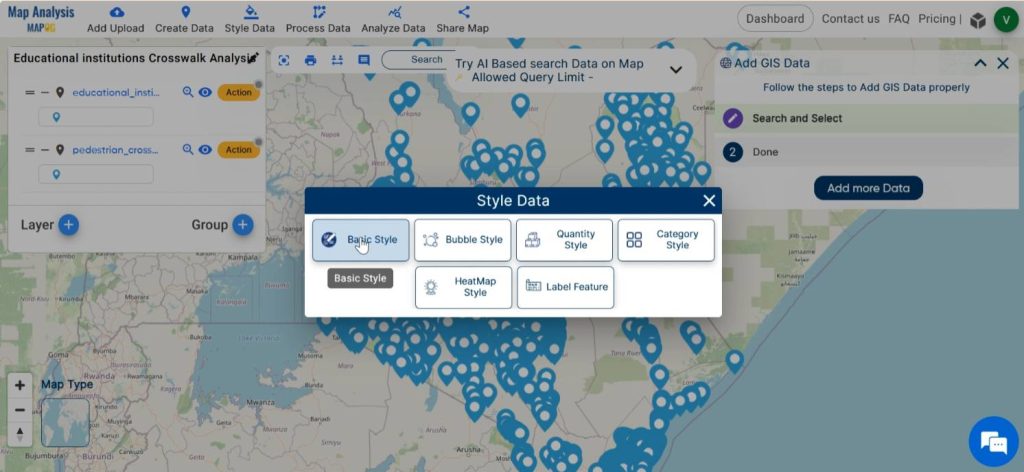
Now, proceed by styling the layers with appropriate colours. Begin by selecting Action and then Edit Style. Choose Basic Style to customise the appearance. Alternatively, this can be also done by selecting Basic Style from the Style Data in the menu bar.
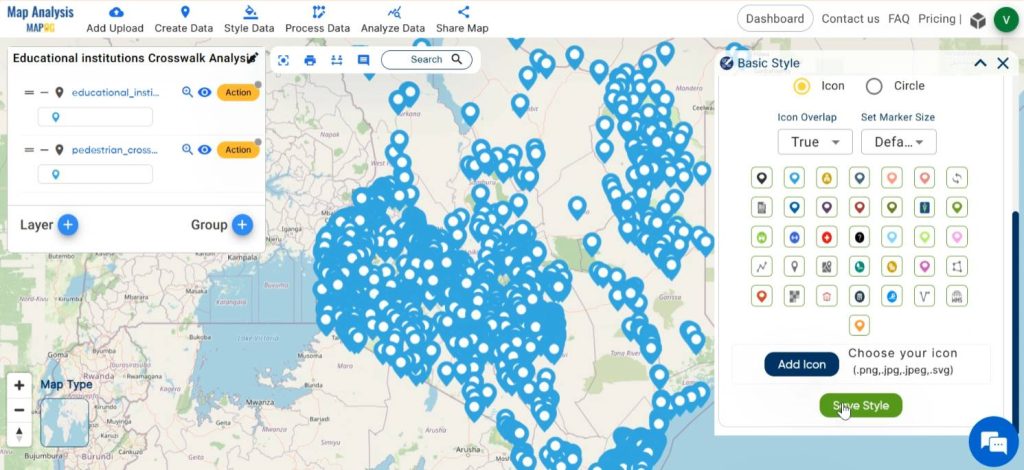
Select the layer to be styled and then select appropriate icons from the list or, if needed, add your own icons. At last, click on Save Style.
Step 6: Analyse the accessibility of educational institutions
To filter educational institutions based on their accessibility to pedestrian crosspoints, select Analyse data from the menu bar. Then select the “Two layer” option.
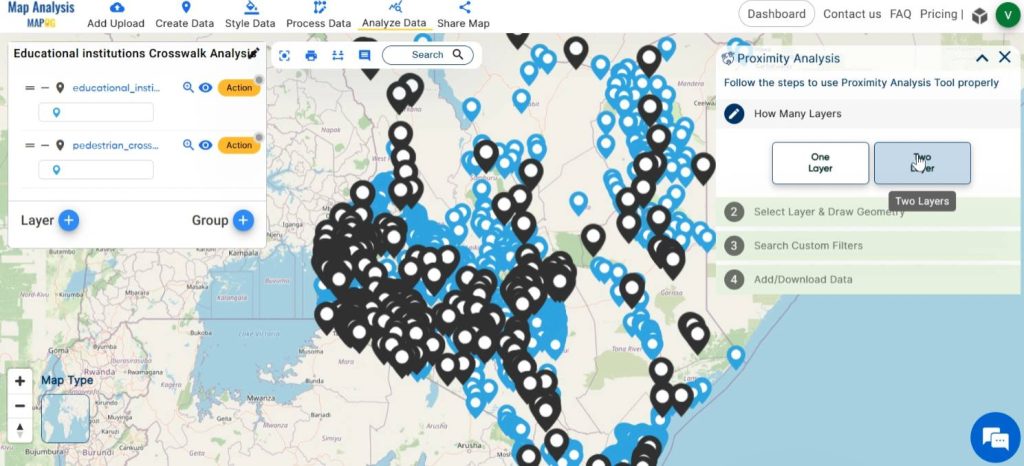
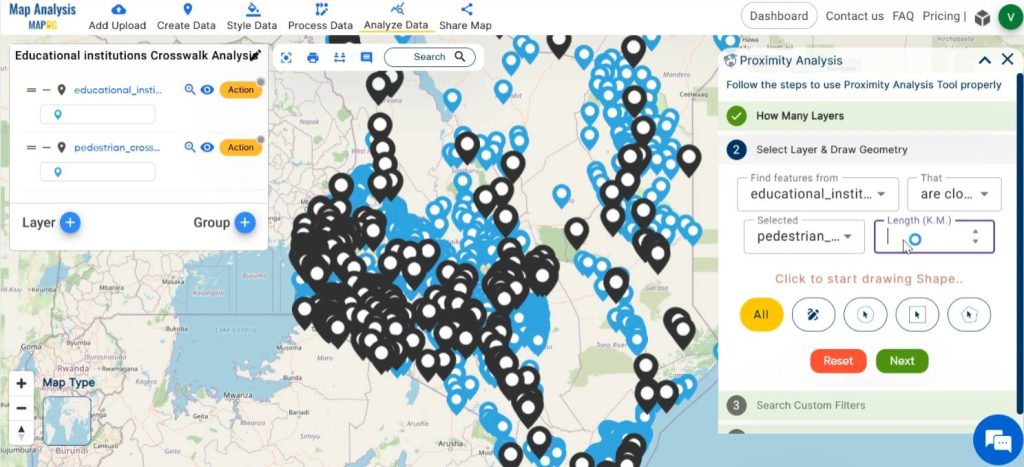
In the “find features” tab, choose the educational institution layer. Next, Specify the option “that are closer than” and select the “pedestrian crosspoints layer” in the following tab. Enter the desired proximity length in kilometres and finally click on Get Results.
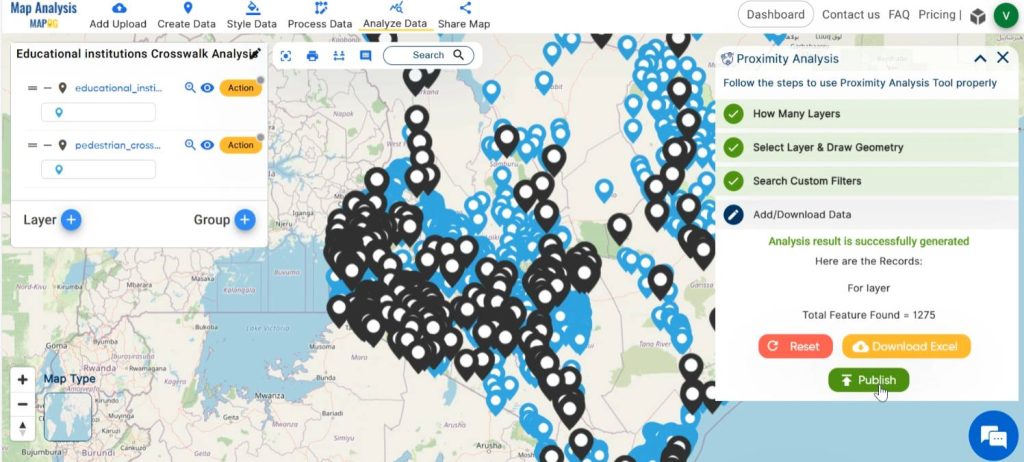
After the analysis, the number of results found is displayed in the window. Now, the result can be downloaded as an excel file with the option or can be displayed in the map using the “Publish” option.
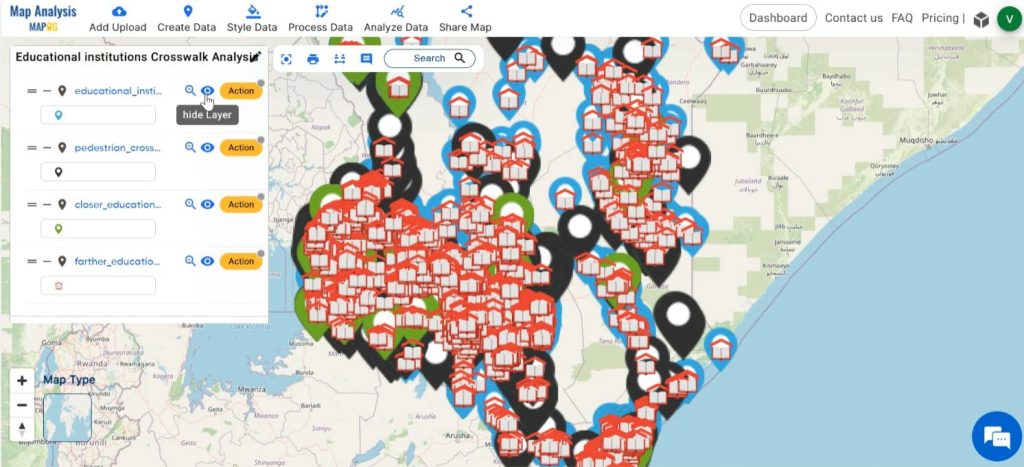
In the same manner, filter out the educational institutions that are farther from pedestrian crosspoints at a desired distance.
Step 7: Enhance the filtered layers
For enhanced visual understanding, rename the filtered layers and also style the layers with basic style.
Also, hide the educational institution layer, for a better visual representation.
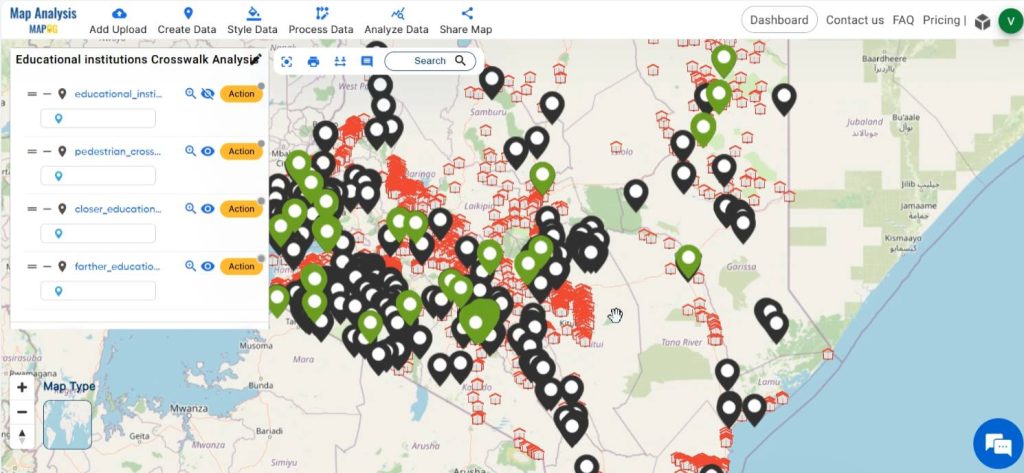
This final map distinguishes between educational institutions based on whether they are situated near pedestrian crosswalks or not. Some institutions have easy access to pedestrian crossing points, while others are not conveniently located near to the crossings.
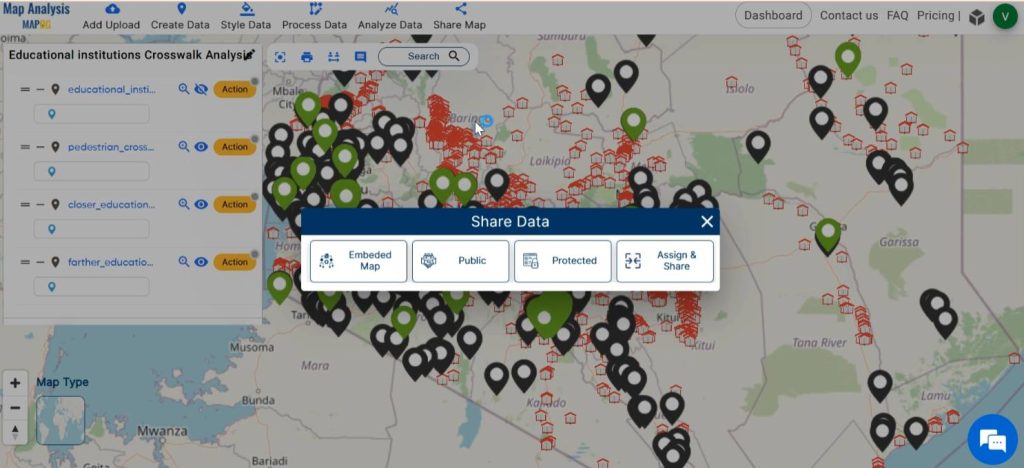
Step 8: Share Map
Finally, using the Share tool, share the map or post it on social media.
Major Findings
- Identification of Areas with Adequate Access: This map highlights regions where educational institutions have sufficient pedestrian crossing point accessibility. Thus, ensuring a safe and convenient pathway for students and staff.
- Recognition of Access Gaps: The map reveals areas where educational institutions lack proximity to pedestrian crossing points, indicating areas in need of infrastructure improvements.
- Insights for Inclusive Planning: The map provides valuable insights for inclusive urban planning.
- Data-Driven Decision Making: This facilitates data-driven decision-making by presenting visual representations of accessibility patterns, empowering stakeholders to make informed choices regarding infrastructure investments and policy initiatives.
Industry and Domain
- Students: Improved access to educational institutions promotes safety and convenience for students commuting on foot.
- Parents: Ensuring that pedestrian crosspoints are located near educational institutions provides peace of mind to parents regarding the safety of their children.
- Teachers and Staff: Easier access to pedestrian crosspoints can enhance the commuting experience for teachers and staff working at educational institutions.
- Urban planners: Helps in evaluating and improving the infrastructure to enhance the accessibility of educational institutions within the community.
- Government: Enhancing the accessibility of educational institutions aligns with broader goals of promoting education, public safety, and community development.
- Traffic Safety Authorities: Identifying and improving pedestrian crosspoints near educational institutions contributes to overall traffic safety initiatives within the community.
Conclusion– mapping for Pedestrian Crosspoints near Educational Institutions
This evaluation of pedestrian crossing points offers valuable insights into enhancing the accessibility of educational institutions. By leveraging the Proximity analysis tool in MAPOG, policymakers and urban planners can identify barriers to access, prioritise improvements, and promote equitable and safe access to education for all individuals.
GIS Data Links
Educational Institutions point
Other Articles
- Protecting Wetlands: Guide to Create GIS Map for Nature
- GIS Analysis in Urban Planning: Reshaping Transportation Future Insights of state/city
- Fast Emergency Response: Using GIS and Isochrone Maps for 10-Minute Ambulance Arrival
- Mapping Tiger Attack Hotspots – Create an Online Map and Share
- Make Routes for Military Aerial Planning- Through Bearing angle and Distance calculation – Online Route Compass
- Mapping Healthcare Efficiency: GIS Buffer Analysis of Hospital Locations
- Add WMS- Two step online view of WMS layer on a map
- Plot ATM locations on a map and embed on your website
- Map habitat locations of endangered animals & keep track of their living