In the pursuit of sustainable development, understanding and mitigating pollution around construction sites have become imperative. This article delves into the innovative approach of utilizing MAPOG to map pollution around construction zones levels effectively. By harnessing the power of GIS technology, this study aims to provide a comprehensive understanding of pollution dynamics in construction zones, thereby facilitating informed decision-making and proactive environmental management.
Check this article-‘Plot ATM locations on a map and embed on your website‘ for exploring application of MAPOG in other fields.
Key Concept for Create map: Pollution Around Construction Zones
The central concept of this study revolves around leveraging MAPOG‘s advanced GIS capabilities to create buffer zones around construction sites. Through meticulous mapping and analysis, this approach enables us to visualize and quantify pollution intensity, identifying hotspots and implementing targeted mitigation strategies. The link for GIS data is available at the end of this article.
Health sector is highly benefited through MAPOG Buffer tool. Check this article- ‘Mapping Healthcare Efficiency: GIS Buffer Analysis of Hospital Locations ‘for more details.
Steps for Mapping Pollution Around Construction Zones
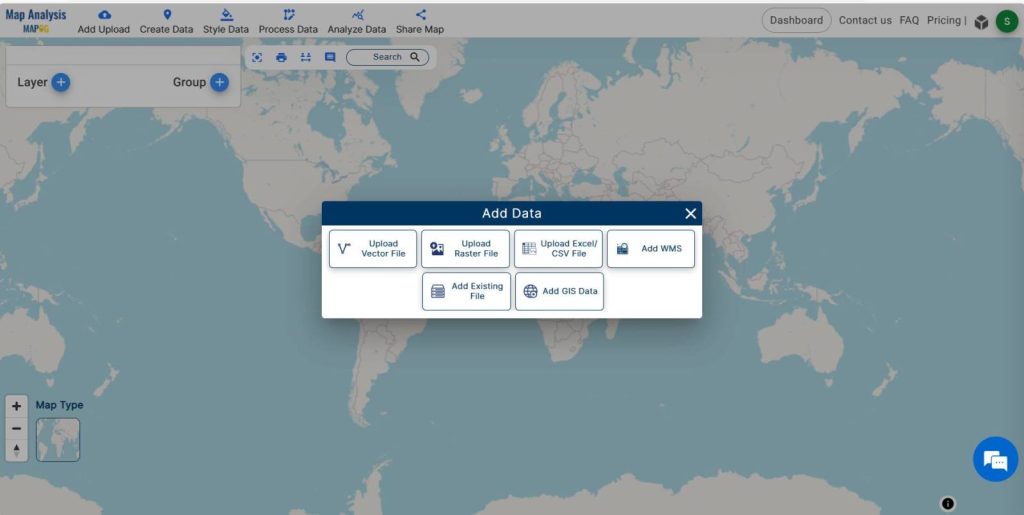
Step 1 Upload the data
To access the MAPOG Map analysis interface, navigate and click on the “Add Upload” option in the menu bar positioned at the upper left end. Then, proceed to select the “Add GIS Data” option to include the necessary data.
Using the AI search option or manually selecting, actively choose the area of study. Subsequently, scroll down to locate the construction area polygon data. Finally, proceed to add the data to the platform by clicking on the “Add” button.
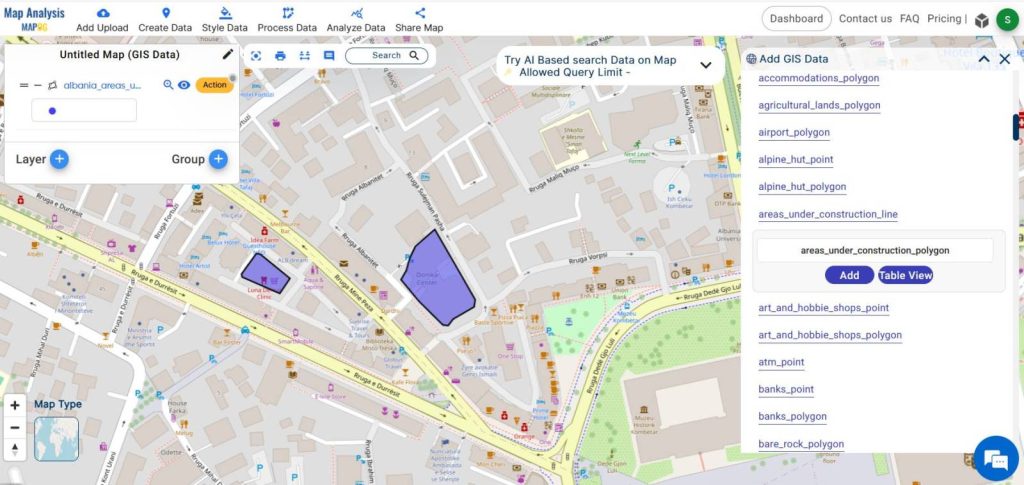
Click on the Add button to add the data to the platform, subsequently incorporating it into the system.
Step 2 Project Title
We successfully added GIS data. Now, we need to rename the untitled project and provide a project description in the description box.
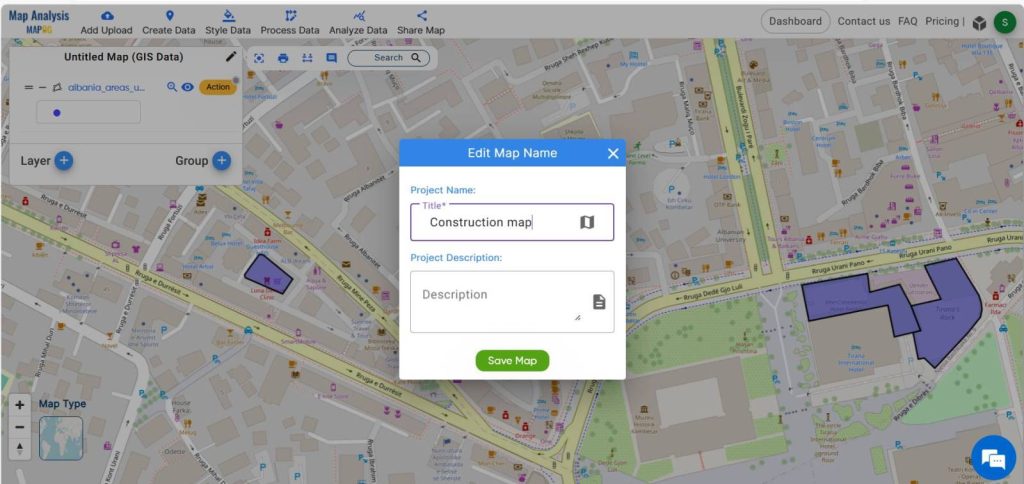
Additionally, we should proceed to the next step by ensuring the project has an appropriate title and detailed description entered in the designated fields.
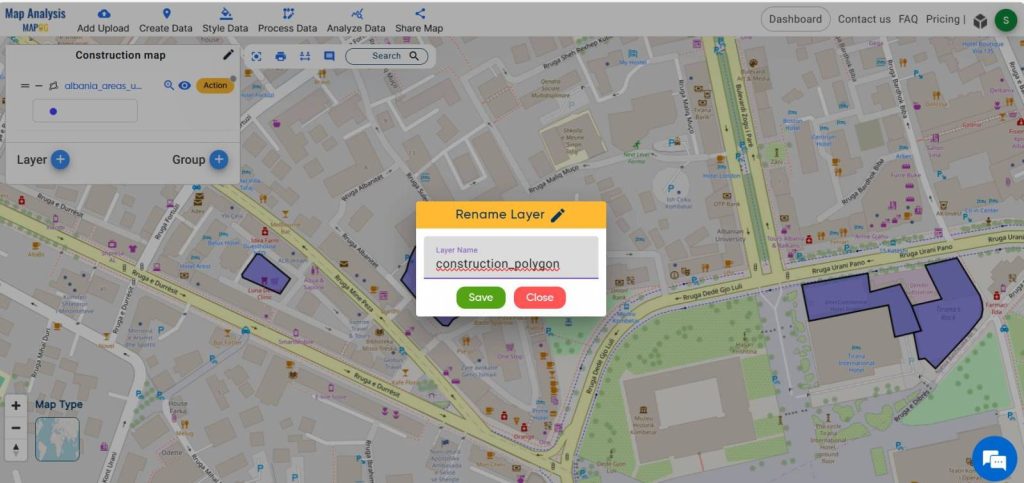
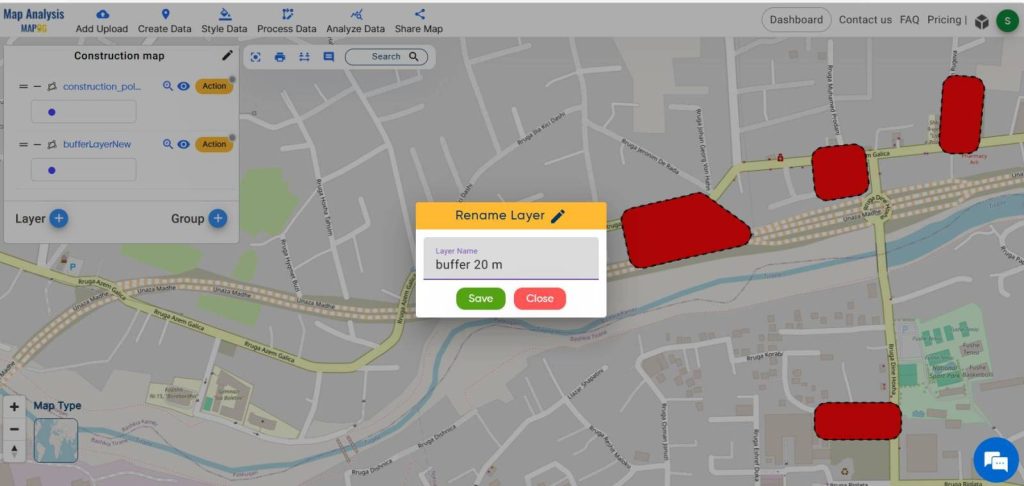
Step -3 Rename the layers
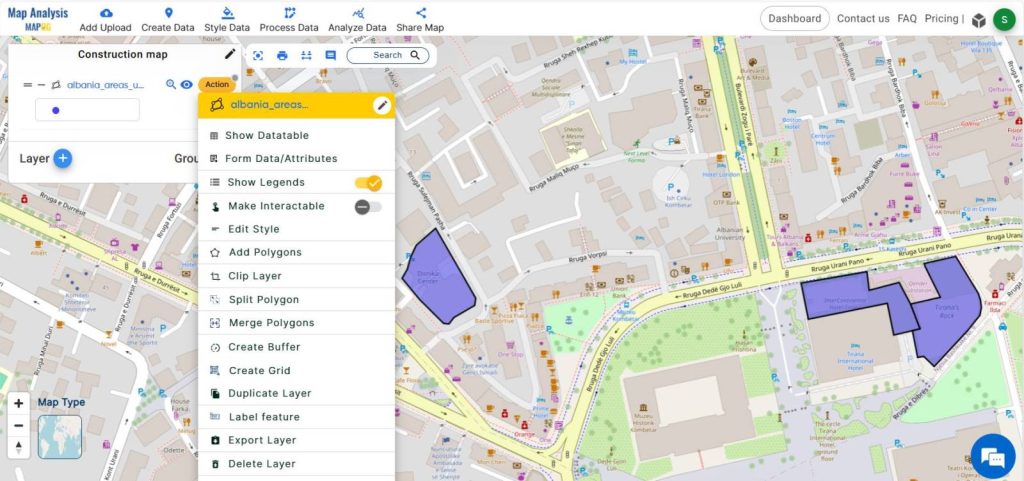
To improve comprehension, select the action button linked to the data layer and proceed to rename the construction zone data layer.
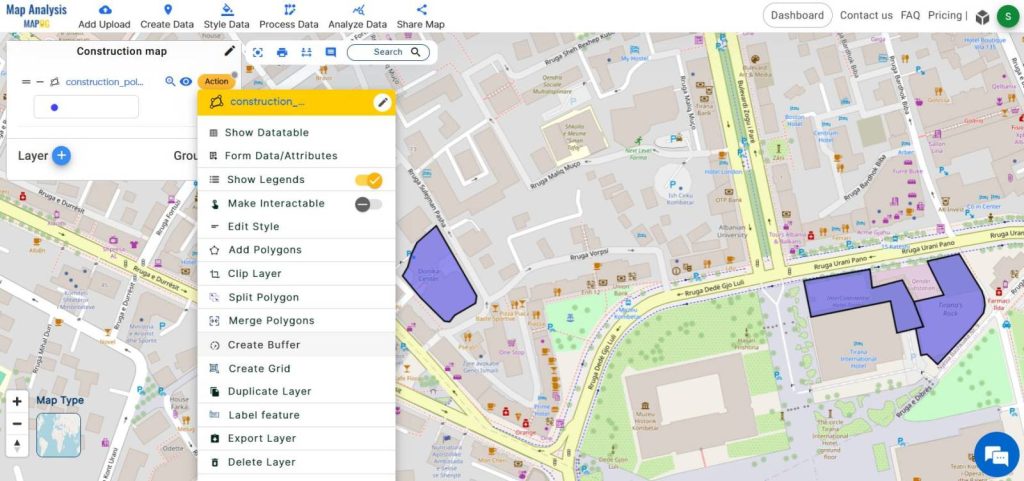
Step 6 Buffer Analysis
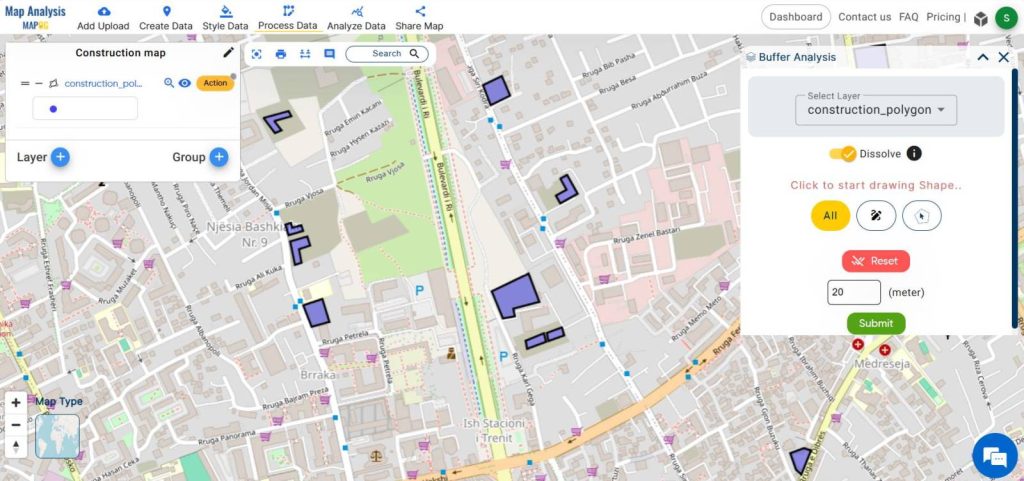
To create a buffer zone of 20-meter intervals around the construction area, simply click on the action button within the data layer. Then choose the create buffer option for buffer analysis.
Once there, designate the desired range for the buffer zone (20 meter). Zoom in on the area to observe the buffered zone.
Step -4 Styling
To style this buffer zone with a dark color, indicating lower air quality, begin by clicking on the action button linked to the buffer 20-meter data layer.
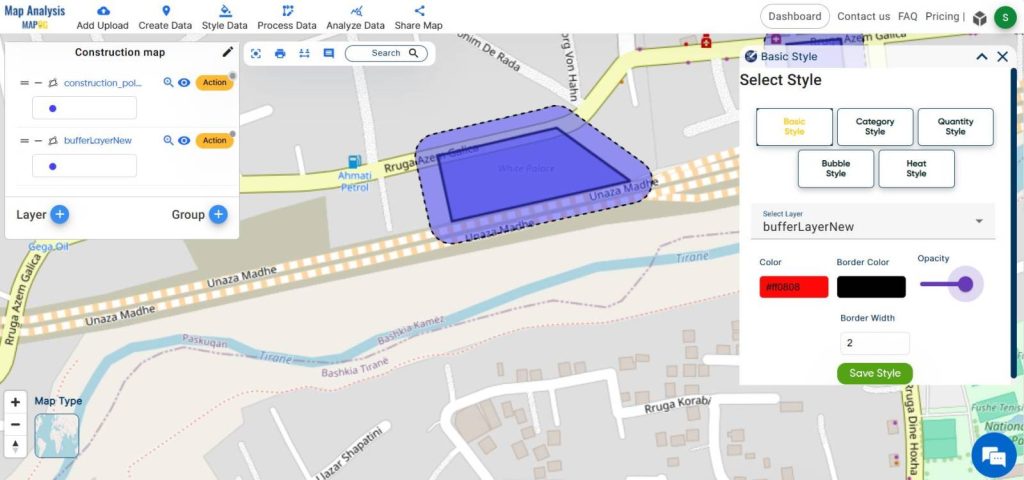
Subsequently, proceed to the edit style option, and then opt for the basic style option. Afterward, select the desired color and drag the opacity bar to its maximum setting. Subsequently, rename this layer as “buffer 20 meter.”
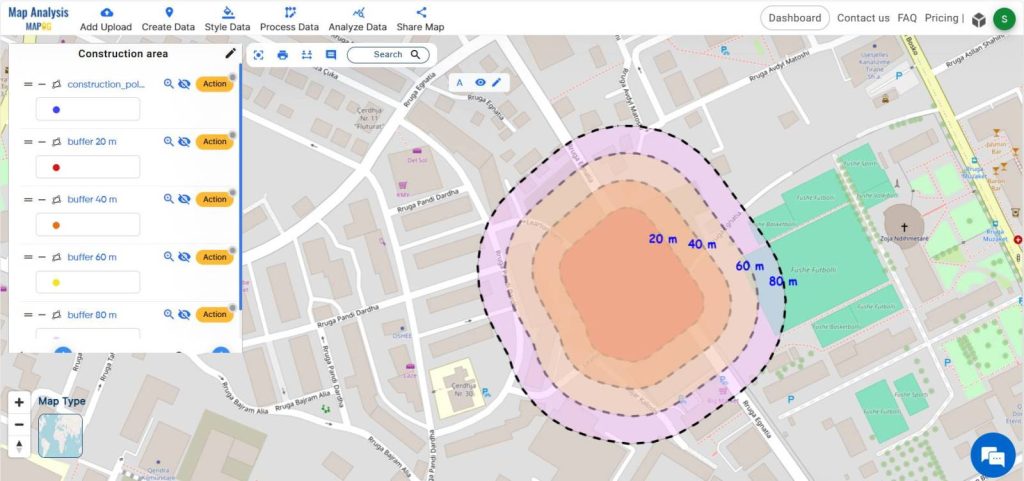
Similarly, create buffer layers of 40m, 60m, 80m, and 100m around the construction polygon data, and assign variant colors to these layers. Ensure that all the buffered layers are distinguishable by adjusting the opacity.
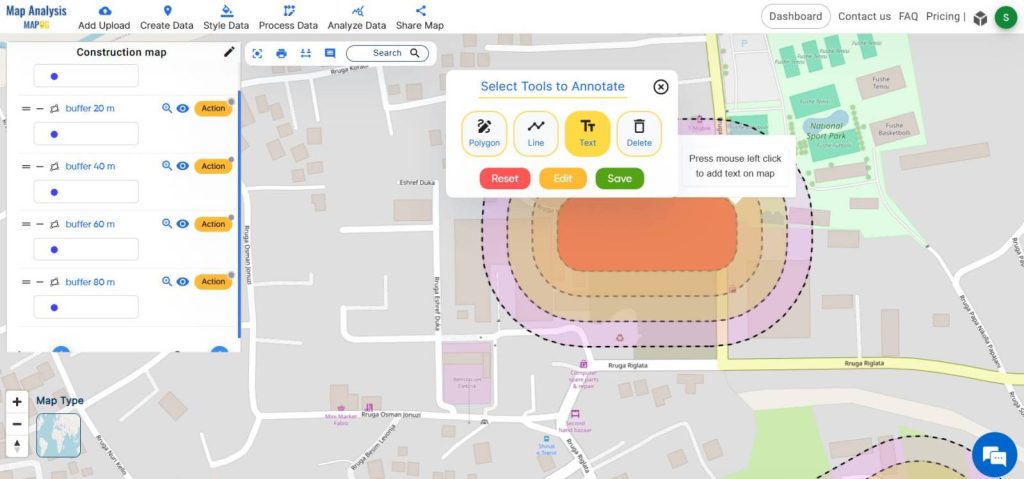
Step 5- Adding Annotations
Transitioning to the annotation tool, utilize the text option to click on each buffer layer, incorporating distances ranging from 20m to 80m for enhanced comprehension.
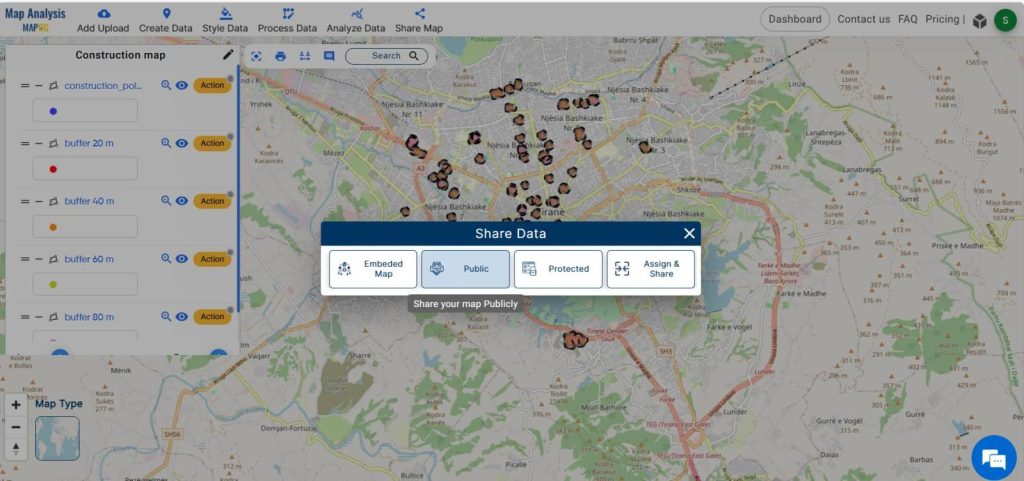
Step 6-Share the map
Share this map to the public using the share data menu.
Major Findings
- Precise mapping of pollution levels
- Enhanced understanding of pollution dynamics
- Improved air quality
- Enhanced public health
Domain and Industry
This study operates at the intersection of pollution and public health, two domains intricately linked by the adverse effects of environmental degradation. Utilization of MAPOG for mapping pollution around construction zones represents a pivotal advancement in environmental monitoring and mitigation efforts.
Let’s go through this article- ‘Make Routes for Military Aerial Planning- Through Bearing angle and Distance calculation – Online Route Compass‘ for exploring the application of MAPOG in other industries.
Conclusion
By harnessing the power of MAPOG, stakeholders can gain invaluable insights into pollution dynamics, enabling informed decision-making and proactive intervention. As we navigate towards a more sustainable future, initiatives like this underscore the importance of leveraging innovative solutions to address pressing environmental challenges and safeguard the well-being of communities worldwide.
GIS Data Links
Construction zone data- https://mapanalysis.mapog.com/map-analysis/add-gis/albania/areas_under_construction_polygon