Immerse yourself in the future of healthcare safety with ‘Mapping Safety: Create GIS Map.’ Explore the game-changing fusion of MAPOG and the Buffer Tool, strategically crafting buffer zones around solid waste areas. This groundbreaking approach not only enhances safety and mitigates hazards but also redefines risk management in hospital settings. Stay at the forefront of healthcare safety practices with this innovative strategy.
Key Concepts for GIS Mapping in Healthcare Safety
Our objective is simple to visualize risk-affected areas, providing detailed hospital information. With MAPOG and its powerful tools we can create a map that will help us to create this amazing map so that we can take strategic actions to the hospitals that are vulnerable to risk. The links for GIS DATA which we’re using here are mentioned at the end of the article.
LINKS FOR THE DATA 👍
GIS Mapping for Hospital Risk Analysis: Step-by-Step Guide
Follow the steps for creating a GIS Map and analyze risk areas:
Step 1: Add Data
First, navigate to the Map Analysis interface. Then click on the Add upload button in the upper left corner. A dialogue box will open. Click on “Upload Vector File”to upload the data.
A box will open on the right side of the screen, select Browse option to browse the Hospital Data and Solid waste data. Then click Upload to upload the data.
Step 2: Enhance Visualization
Now, let’s add thematic styling to enhance the visualization of those layers. To style the data go to the style data option and select the basic style option to visually interpret the data.
Select the Solid waste layer in edit layer option, select size & icon and save style. Same goes for Hospital Layers.
Select different icon styles for hospitals to differentiate between both layers. Hence we created a GIS Map in healthcare next we will analyze it.
Step 3: Create Buffer Zone
Now to prepare the buffer zone click on Process Data and click on Buffer Tool.
In the select layer option Select the Solid Waste layer and click on next. After that in the range option write 1500 as we are creating a 1500-meter buffer zone around the layer. Keep the Dissolve toggle on and hit the submit button.
After creating the first buffer zone, create the next buffer zone with a range of 3000 meters. Keep the Dissolve toggle on and click on submit button.
After that, create the last buffer with a 5000-meter range around the solid waste point. Keep the Dissolve toggle on and click on submit button.
Step 4: Rename Layer
Now click the Action Button of the 1500 buffer layer and click on that pencil icon and rename that layer as High-Risk Zone As it is the nearest zone around the Solid waste area.
Rename the 3000-meter zone as Medium Risk Zone and 5000-meter zone as Low risk zone by going through the same process for understanding purposes.
Step 5: Add Thematic Style
Now Add thematic styling to differentiate between the buffer layers. Go to style data option and select the High-Risk Zone layers and provide Dark red color to it and save the style.
Next select the Medium Risk Zone and select a comparatively lighter shade of red for it and a much lighter shade of red for the low-risk zone layer.
Step 6: Save Project
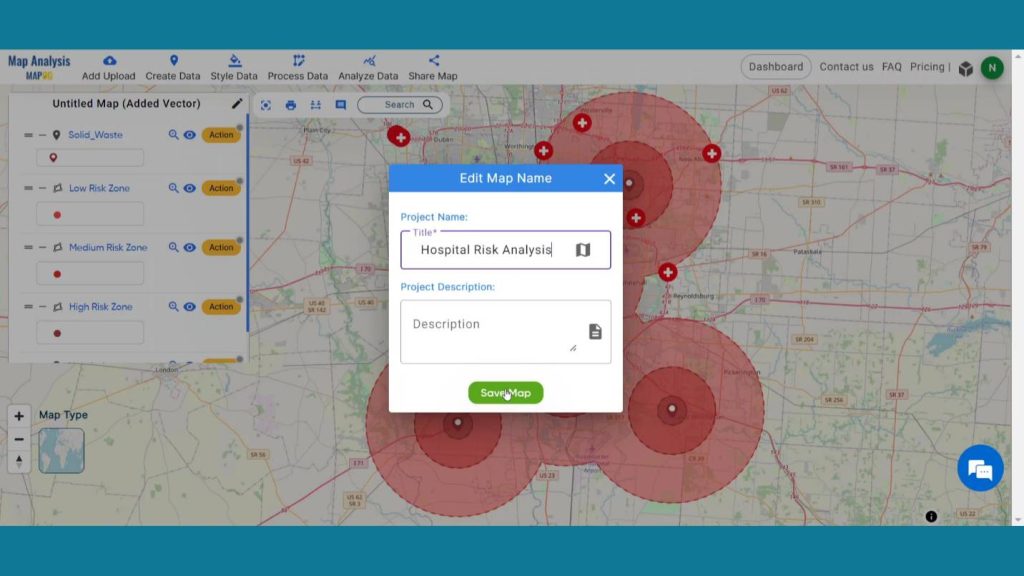
Now, click on the pencil icon situated right after the “Untitled Map” text to save the project. In the dialogue box write proper name and description that describe the project accurately. And click on save map option. Your project will be saved.

Step 7: Results & Analysis
With our map now enriched with details, let’s make those final adjustments. Let’s analyze the map. The Hospitals under High-Risk Zone are vulnerable to risks. Medium and low zones comparatively at low risk. By clicking on the hospital’s icons, we get the information about the hospitals so that we can take proper action on them.
Major Findings
Increased Safety Measures: Implementing buffer zones with MAPOG significantly enhances safety within hospital environments, mitigating potential risks associated with solid waste areas and reducing the likelihood of accidents or hazards.
Optimized Resource Allocation: Hospital risk analysis utilizing MAPOG allows for more efficient allocation of resources by strategically identifying and addressing vulnerabilities in solid waste areas, ensuring a streamlined and effective response to potential threats.
Improved Environmental Sustainability: Creating buffer zones around solid waste areas not only enhances safety but also contributes to improved environmental sustainability. MAPOG facilitates responsible waste management practices, reducing the environmental impact of hospital operations.
Domain and Industry
This map is a powerful tool for Healthcare Industry, Environmental Services, Urban Planning, Emergency Management and beyond. This strategic risk analysis not only safeguards against potential threats but also fosters sustainable practices for resilient and efficient healthcare operations.
Conclusion
Revolutionize hospital safety with MAPOG! By implementing buffer zones around solid waste areas, hospitals ensure enhanced safety protocols, minimized environmental impact, optimized resource allocation, and improved emergency preparedness. As we wrap up our GIS journey, we’ve explored diverse applications—from protecting wetlands to optimizing healthcare efficiency. Check out our previous articles on [Wetland Conservation], [Urban Planning], [Emergency Response], [Tiger Attack Hotspots], [Military Aerial Routes], and [Healthcare Efficiency]. Each piece unveils the dynamic capabilities of GIS mapping in shaping resilient and efficient solutions across various domains. Embrace the transformative power of location intelligence!.
1 thought on “Mapping Safety Create GIS Map : Game-Changing Approach to Hospital Risk Analysis”