Introduction:
Welcome to MAPOG as we embark on an exploration of the diverse world beneath our feet. Today, we’ll leverage the powerful tools of Map Analysis to create a Soil Types Map, shedding light on the intricate soil landscape with “World Diversity Unveiled: A Map Journey”.

Key Concept For Soil Diversity Unveiled: A Map Journey
The creation of a Soil Types Map enables users to visually represent and understand the varied soil types present in a geographic area, offering insights into their distribution and characteristics. For data sources, refer to the links provided below. One can also explore our other blogs Map habitat locations of endangered animals & keep track of their living, Protecting Wetlands: Guide to Create GIS Map for Nature.
Process For Soil Diversity Unveiled: A Map Journey
Step 1:
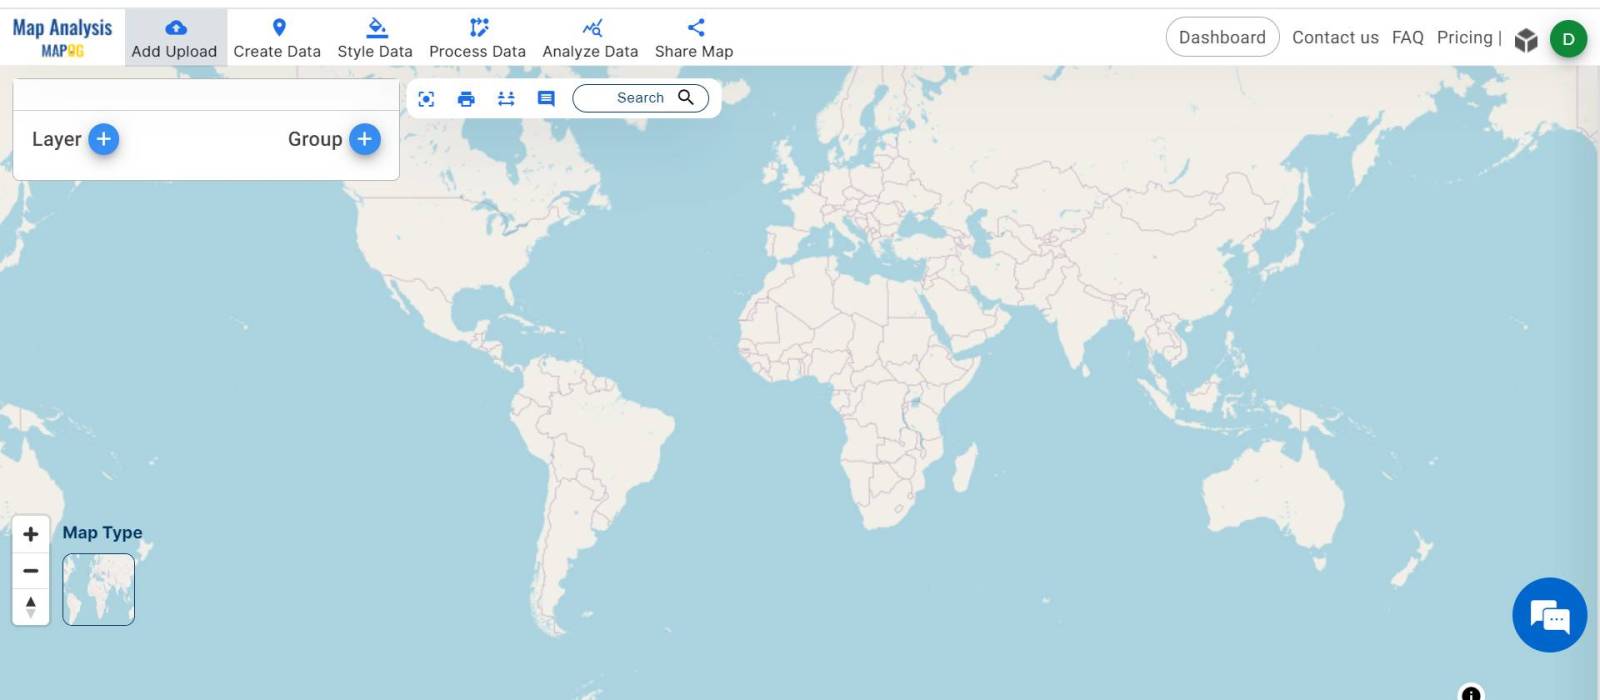
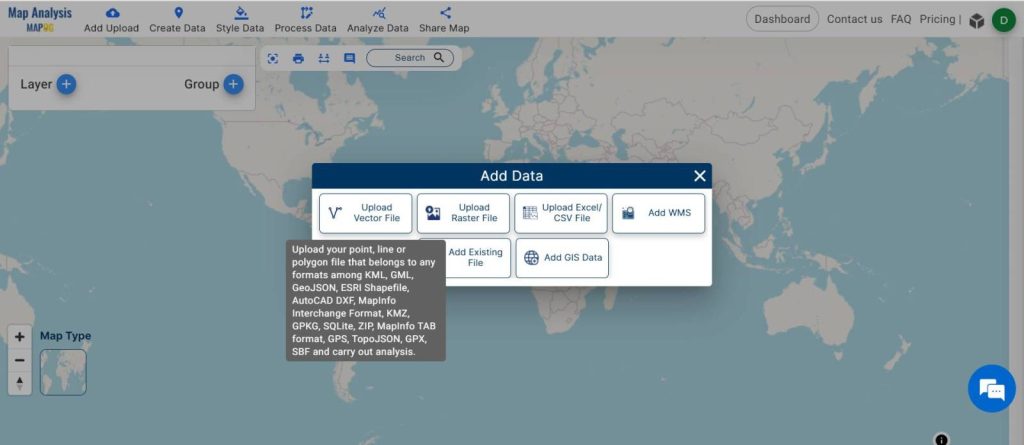
First, begin by opening the MAPOG, Map Analytics interface. Then navigate to ‘Add Upload’ and select ‘Upload Vector File.’
Step 2:
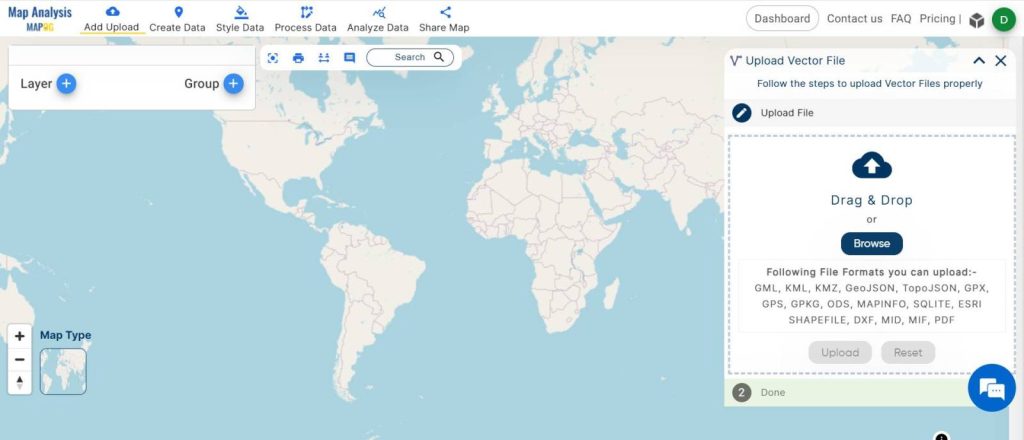
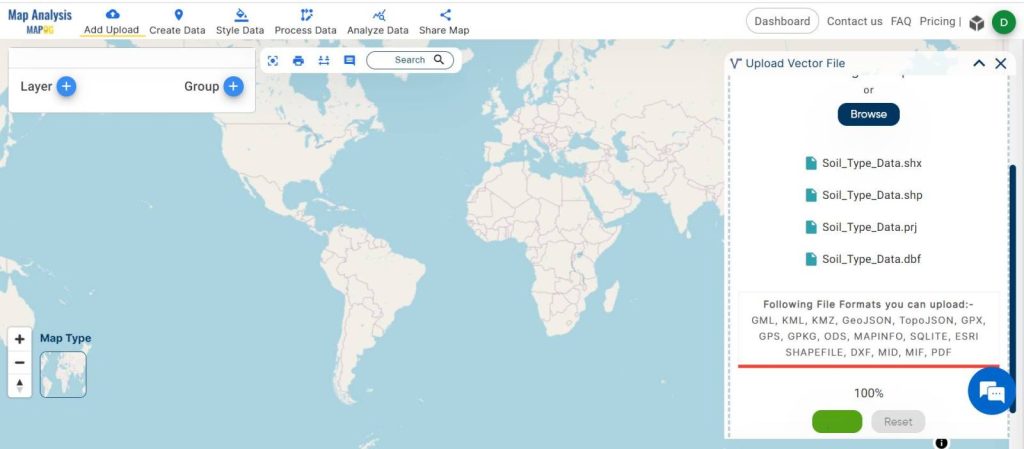
Now Browse and choose your vector file, then proceed to upload it. Your Data is added now.
Step 3:
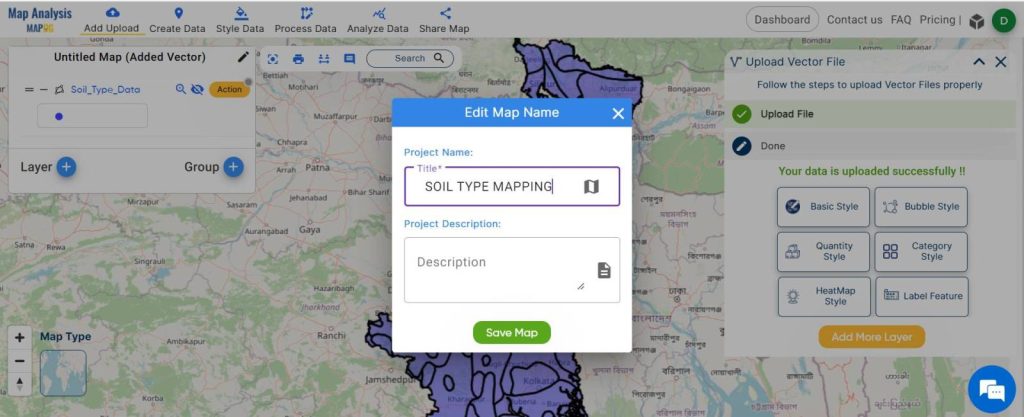
Once the data is added, give a name to the layer by clicking on ‘Edit Map Name.’ Then ‘Save Map’.
Step 4:
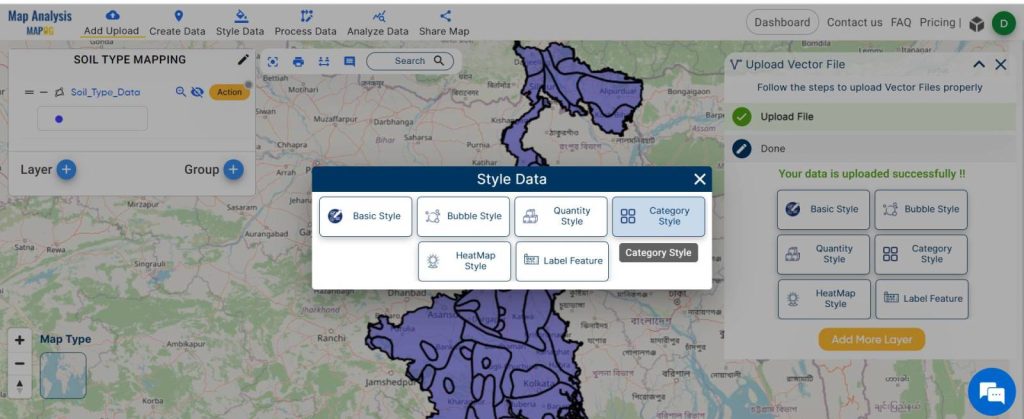
Now go to ‘Style Data’, then choose the ‘Category Style’ option.
Step 5:
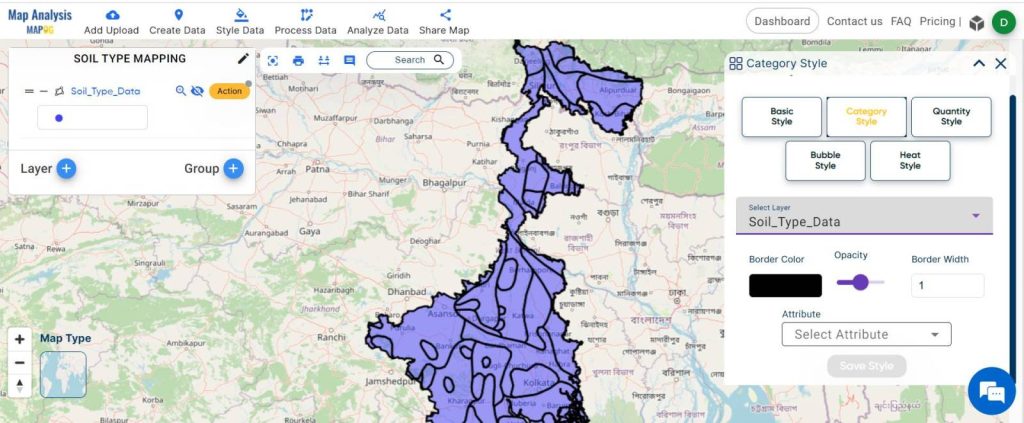
Select the layer first and then select the ‘attribute’ from the data.
Step 6:
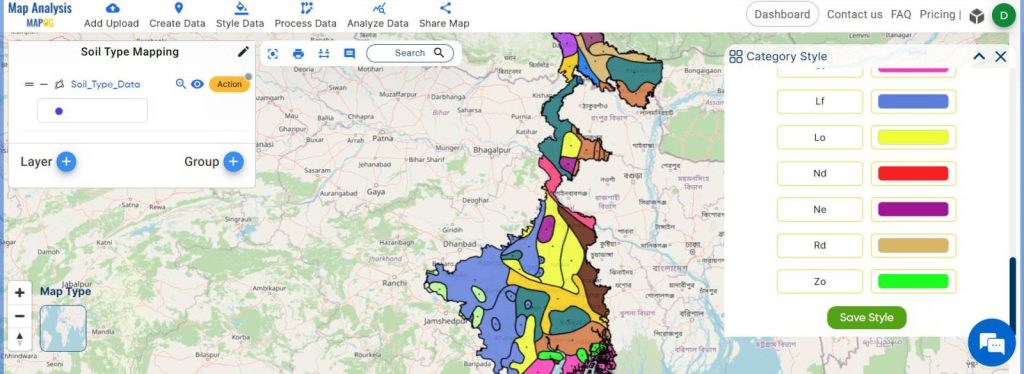
Customize the colours according to your preferences for each category. After that, click on the ‘save style’ option to apply the style to the data
Step 7:
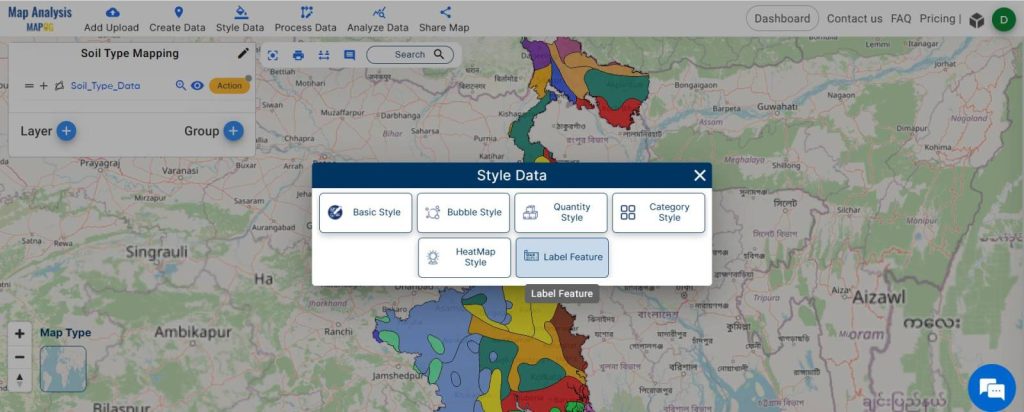
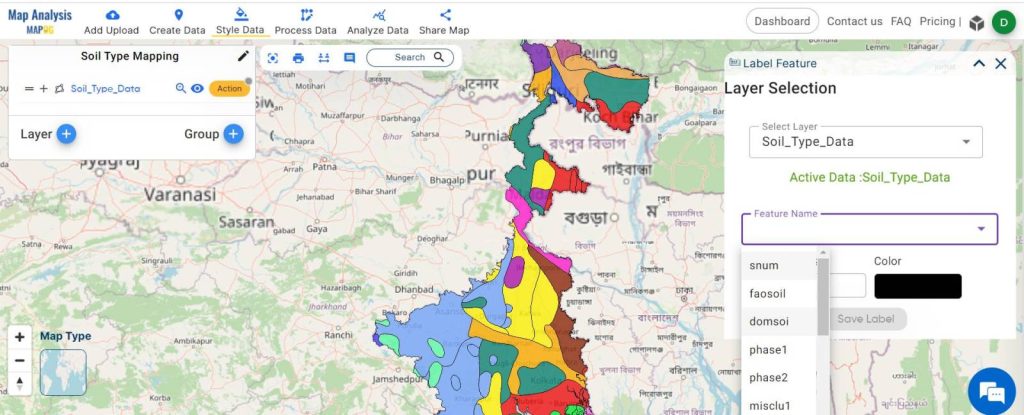
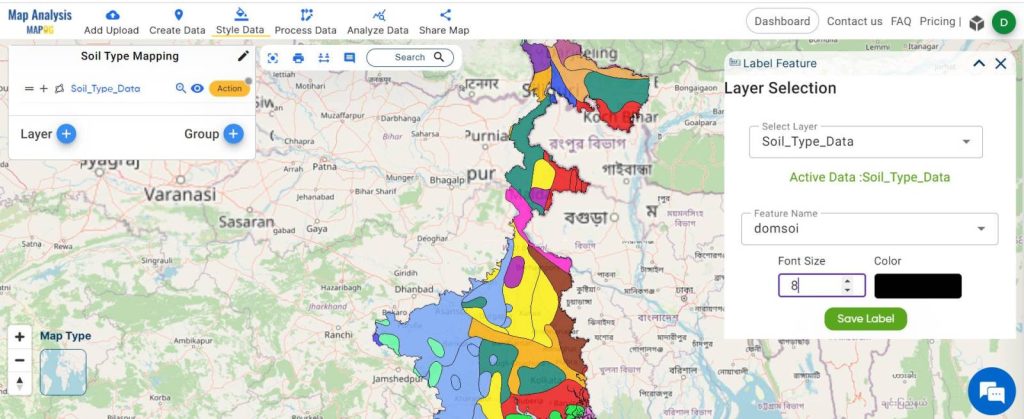
Now to add Lebel go to ‘Style data’ and then go to ‘Lebel Feature’. Select the layer first, then select the ‘Feature name’ which you want to show as the label, and customize the Font size and colour as per your choice. Then ‘Save Label’. The label feature is added now.
Step 8:
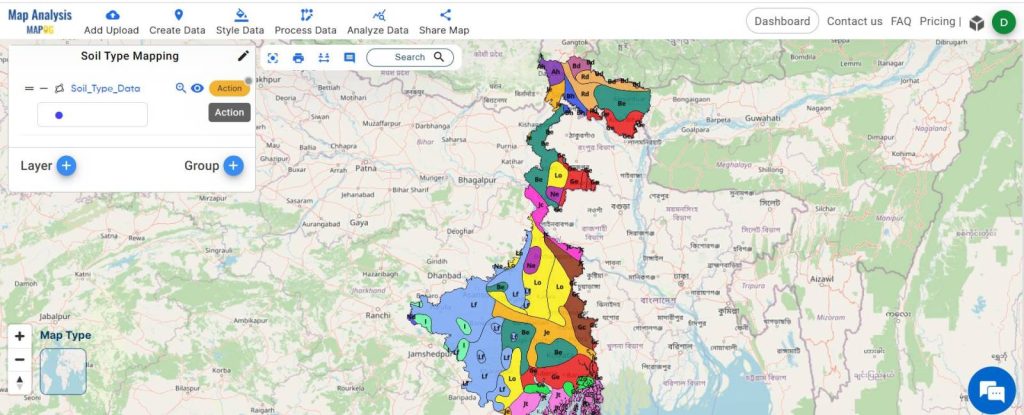
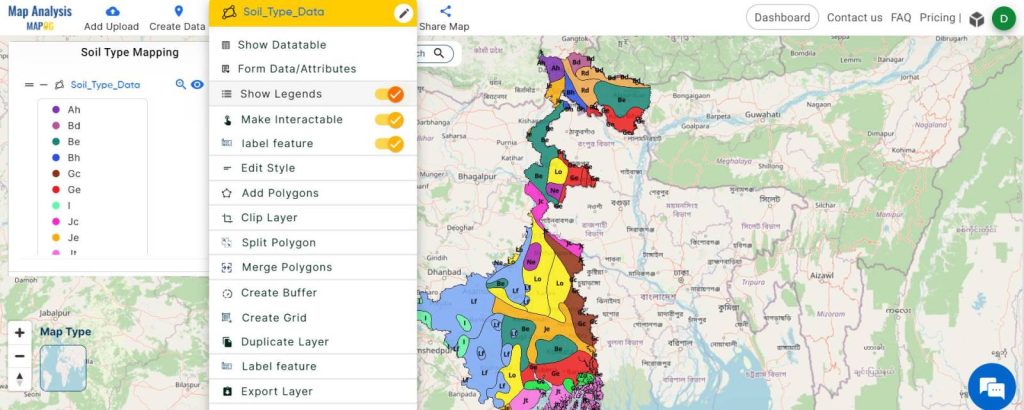
After that, go to the Action Button and select ‘Show Legend’ to display labels on the screen. The legends are now showing on the screen, you can easily interpret the map. Explore the unique representation of different soil types and their spatial distribution.
Major Findings For Soil Diversity Unveiled: A Map Journey
The Soil Types Map serves as a comprehensive visual representation of the diverse soil landscape, facilitating insights into soil distribution patterns and characteristics.
Domain and Industry:
Agriculturists benefit from insights into soil diversity for crop selection and management, while urban planners make informed decisions about construction projects based on soil characteristics. Environmentalists utilize soil health information for conservation efforts.
Conclusion For Soil Diversity Unveiled: A Map Journey
The Soil Types Map emerges as a valuable tool for understanding and utilizing the diverse soil landscape. Whether in agriculture, urban planning, or environmental science, MAPOG provides crucial insights for sustainable decision-making.