The Point to polygon tool is used to build a polygon that represents the smallest region or area that encloses a set of points. The Point to Polygon tool essentially converts point data, representing specific locations, into polygonal shapes. These polygons serve as a visual representation of the distribution or extent of any phenomenon under consideration. This article delves into the significance of the Point to polygon tool and Converting Points to Polygon for mapping Species Distribution.
The Point to Polygon tool offers several advantages:
- Streamlines spatial data processing and analysis.
- Facilitates integration of point and polygon datasets.
- Enhances visualisation and interpretation of spatial patterns.
The Point to Polygon tool serves as a valuable asset in environmental studies, providing researchers, managers, and policymakers with a powerful means of visualising and analysing spatial data. Its applications range from species distribution mapping to land use planning, contributing to informed decision-making and sustainable environmental management.
Key Concept– Mapping Species Distribution
The point to polygon tool in MAPOG converts discrete species occurrence point data into continuous surfaces represented by polygons. This process involves interpolating the values of surrounding points to estimate the characteristics of areas between them. Immerse yourself in the multitude of articles on our blog like Mapping Safety Create GIS Map: Game-Changing Approach to Hospital Risk Analysis, and thought-provoking articles like Fast Emergency Response: Using GIS and Isochrone Maps for 10-Minute Ambulance Arrival for an enchanting reading adventure.
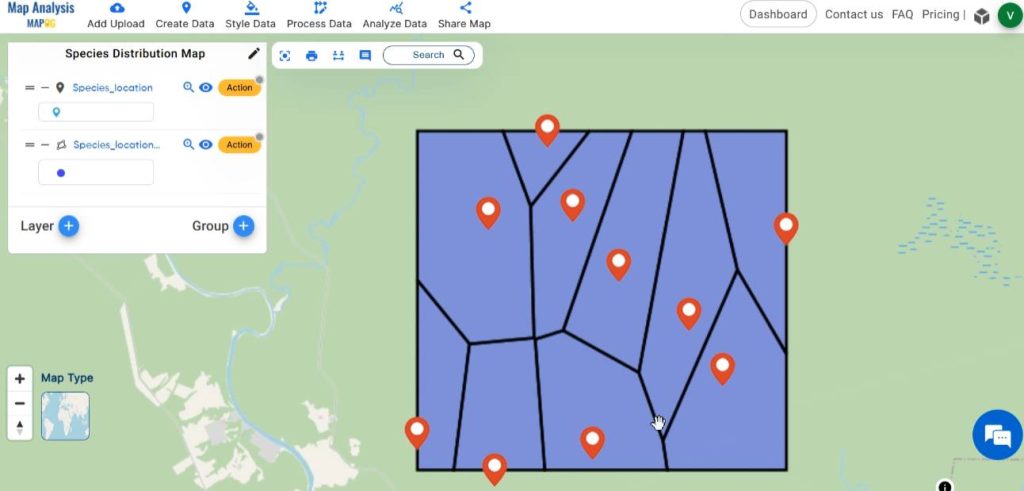
Follow the below process Step-by-step for Mapping Species Distribution
Step 1: Open Map Analysis
Navigate to Map analysis interface from MAPOG platform.
Step 2: Upload data
Begin the process by adding the data containing locations of desired species to the map. For this click on the Add Upload option from the menu bar at the upper left end, and then go to the Upload Excel/ CSV Files option.
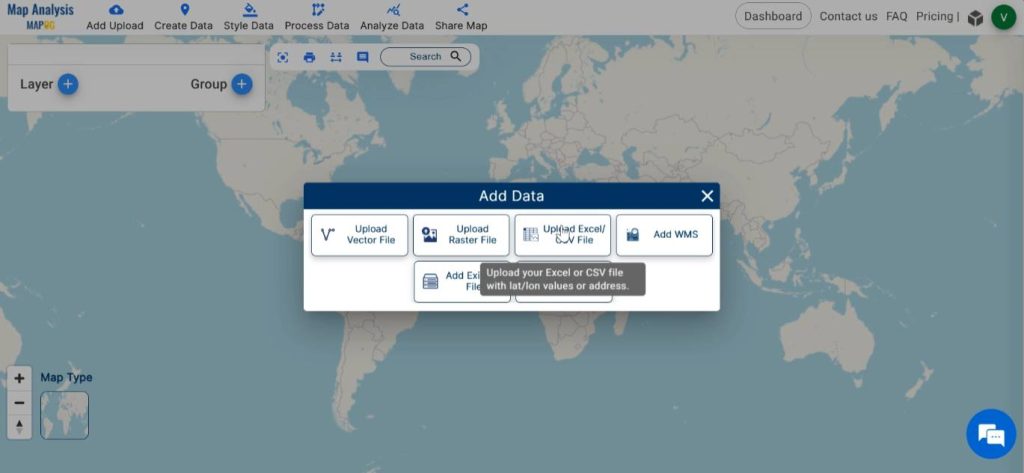
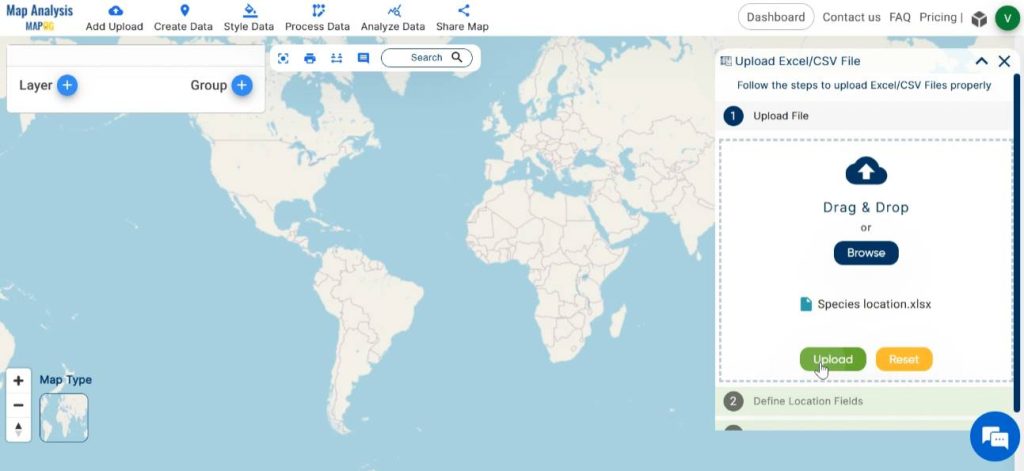
Browse for the file containing species data in the system, open the file and click on upload.
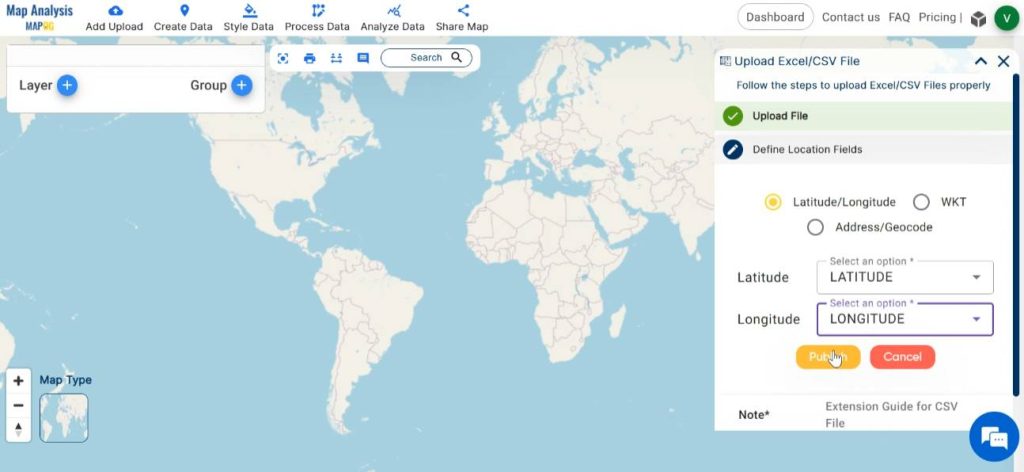
The location information may be included in the file as latitude-longitude, WKT, or addresses. Based on the type of information present in the file, select the appropriate format in the Define Location field. Next, identify and select the column header in the Excel sheet that contains the relevant data. Finally, click on publish.
Step 3: Save map
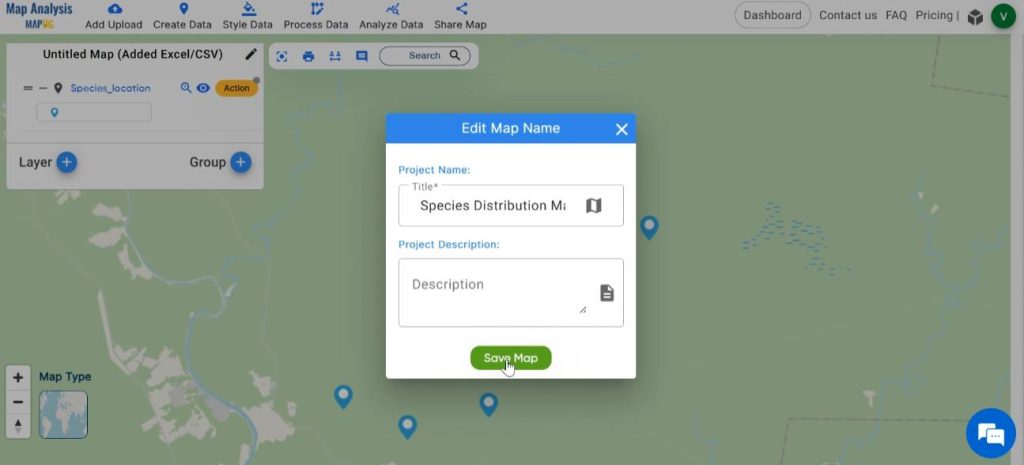
Next, save the map with a name you prefer. For this, click on the pencil icon near the “Untitled Map” text. Enter a suitable name, and if desired, provide a brief description of your project. Finally, save the map by clicking on the “Save Map” button.
Step 4: Convert points to polygon
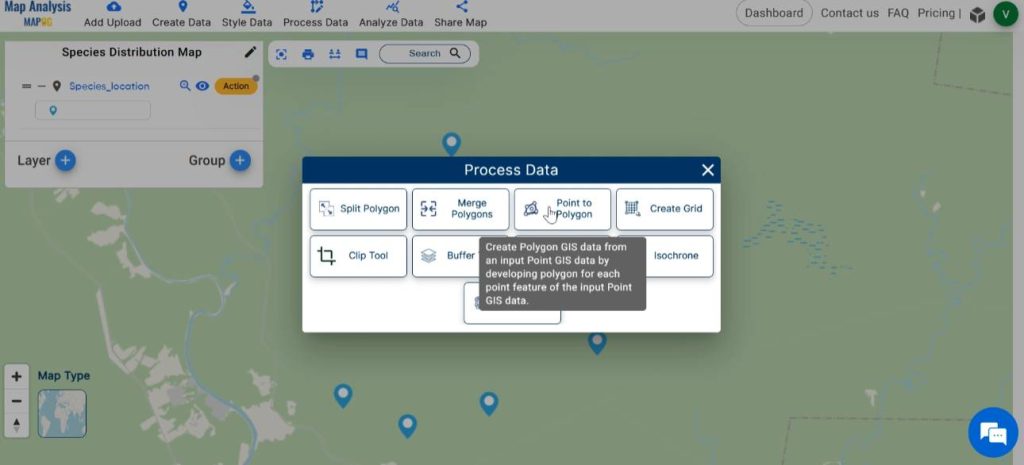
Now, we can identify the species distribution by converting the points to polygons. In order to do this, click on Process Data and select the Point to Polygon tool.
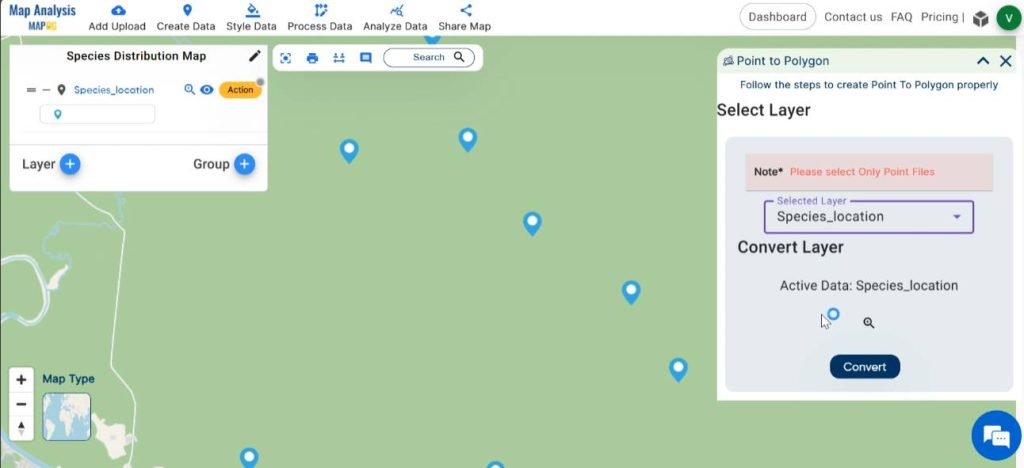
Select the species location layer and just click on convert.
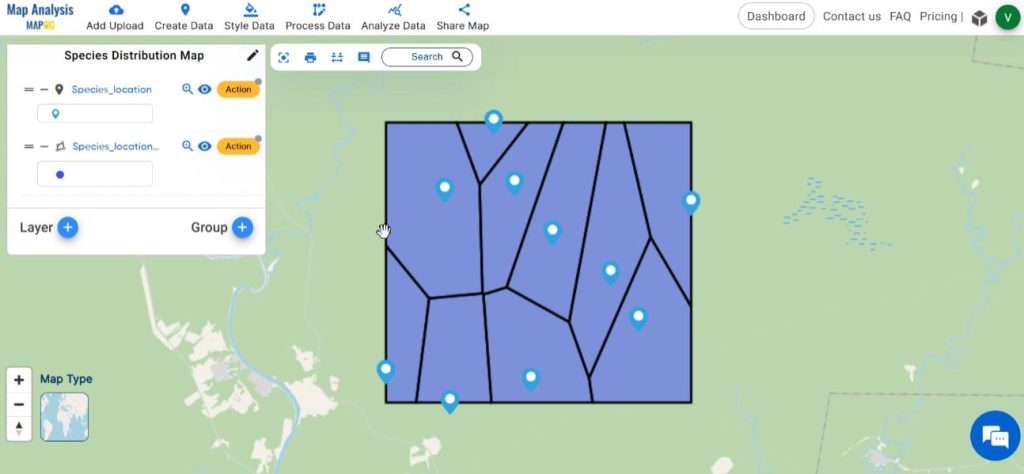
Now the points are converted to polygons.
Step 5: Style the Map
For enhancing the visual presentation of the map, click on Process Data and select Basic Style.
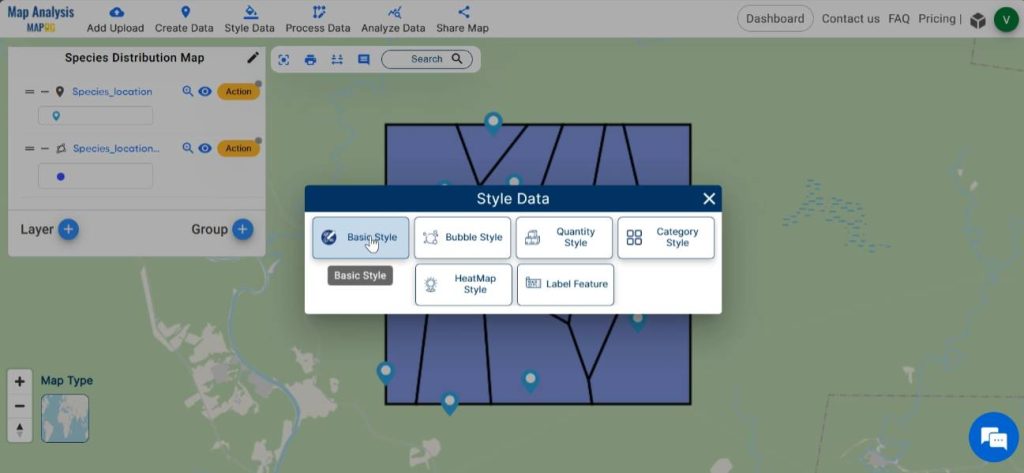
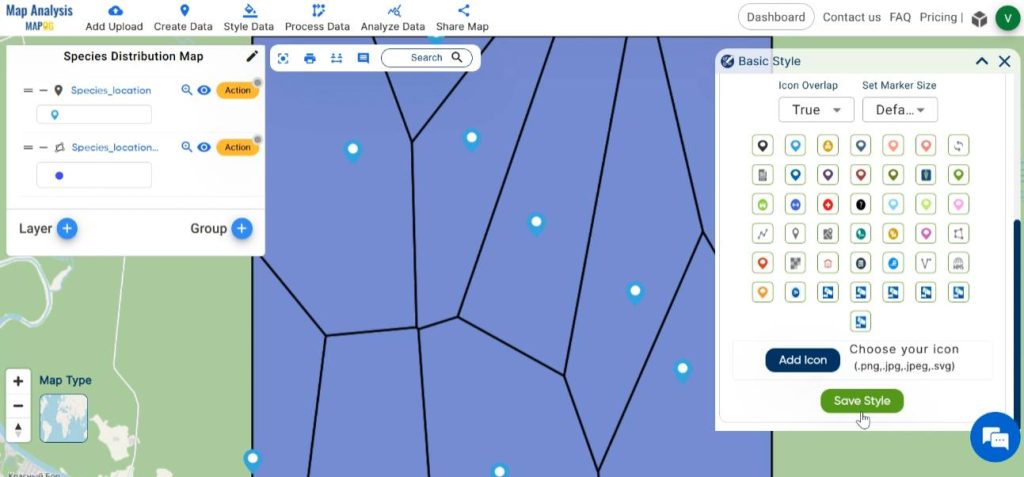
Choose the layer to be styled. Select a suitable icon for your layer from the given list. Save the changes by clicking on save style.
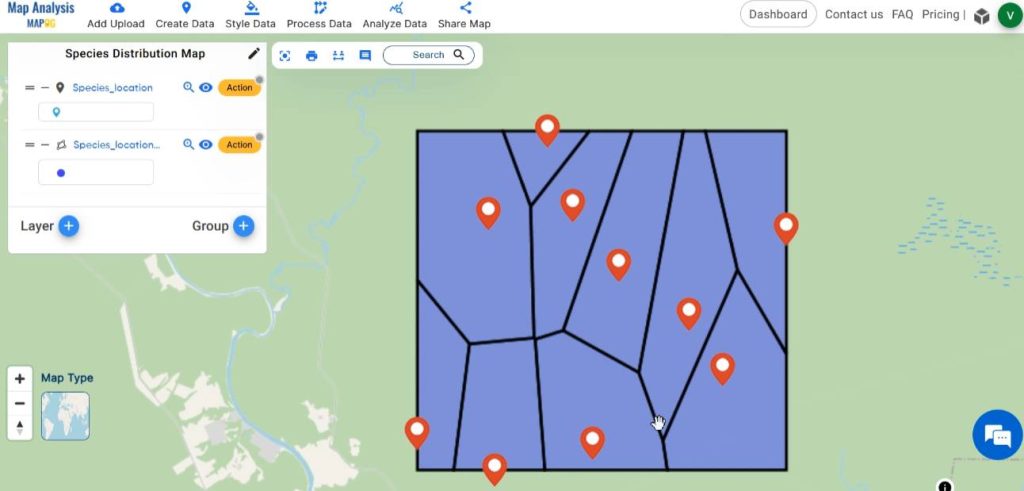
Thus finally, we’ve generated a map where individual points denote recorded species locations, while the polygon illustrates a vivid depiction of the species distribution within this region.
Major Findings
- Biodiversity Hotspots: Identifying areas with high species richness and diversity, which are crucial for conservation efforts
- Species Range Limits: Defining the boundaries of where certain species are found, which can inform species management and protection strategies.
Industry and Domain
- Ecologists: They can use the map to study species distribution patterns, habitat preferences, and potential areas for conservation efforts.
- Environmental Organisations: Organisations focused on wildlife conservation can utilise the map to identify key habitats and prioritise conservation actions.
- Researchers: They can use the map for policy-making, land-use planning, and regulatory purposes.
Conclusion- Mapping Species Distribution
In conclusion, the Point to Polygon tool in MAPOG serves as a cornerstone in geospatial analysis, empowering analysts to transform disparate point data into actionable insights encapsulated within polygonal boundaries. Its applications span a myriad of domains, ranging from environmental research to urban planning and disaster management. By harnessing the capabilities of this tool, we can unlock the full potential of spatial data and drive informed decision-making processes.
Explore more content on our blog:
Protecting Wetlands: Guide to Create GIS Map for Nature
GIS Analysis in Urban Planning: Reshaping Transportation Future Insights of state/city
Fast Emergency Response: Using GIS and Isochrone Maps for 10-Minute Ambulance Arrival