Navigating airport data has never been easier! Plotting Airports on MAP Plotting With MAPOG, seamlessly upload Excel files to ensure precise plotting. Enhance visual clarity and user experience by incorporating captivating new icon styles. Revolutionize airport mapping with these intuitive tools, simplifying logistics, travel planning, and urban development.
Key Concepts of Plotting Airports on MAP
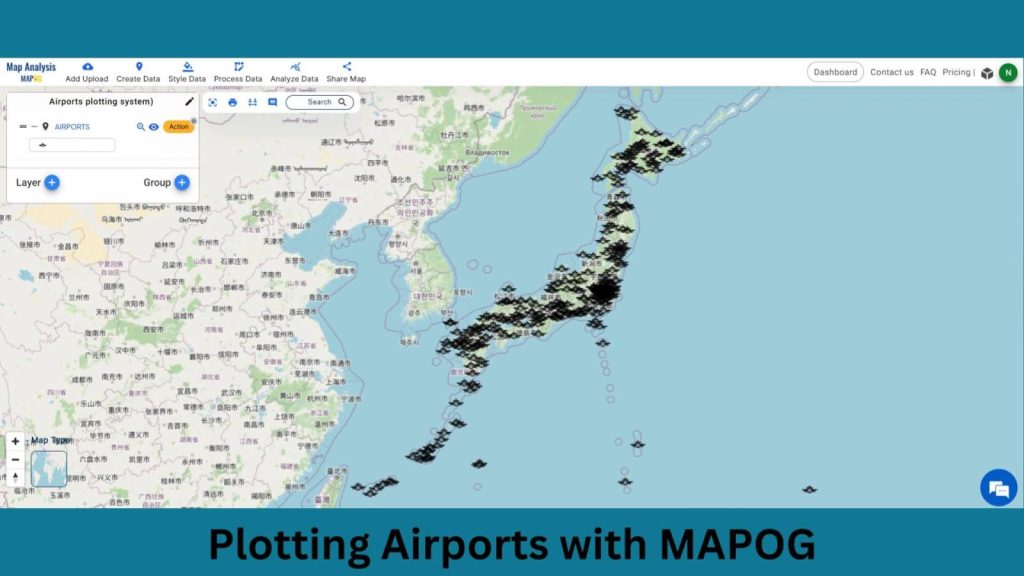
This is the comprehensive output map for the “Plotting Airports with MAPOG” that we will see at the conclusion of the project. Our goal is to Utilize MAPOG to plot airport locations from an uploaded Excel file, facilitating spatial visualization for efficient air navigation. This map’s thematic structure is undoubtedly what gives it it’s fascinating details. Join us as we walk you through the process of making this effective map on the MAPOG. Let’s get started!
Steps for Plotting Airports on MAP
Step 1: Add Data
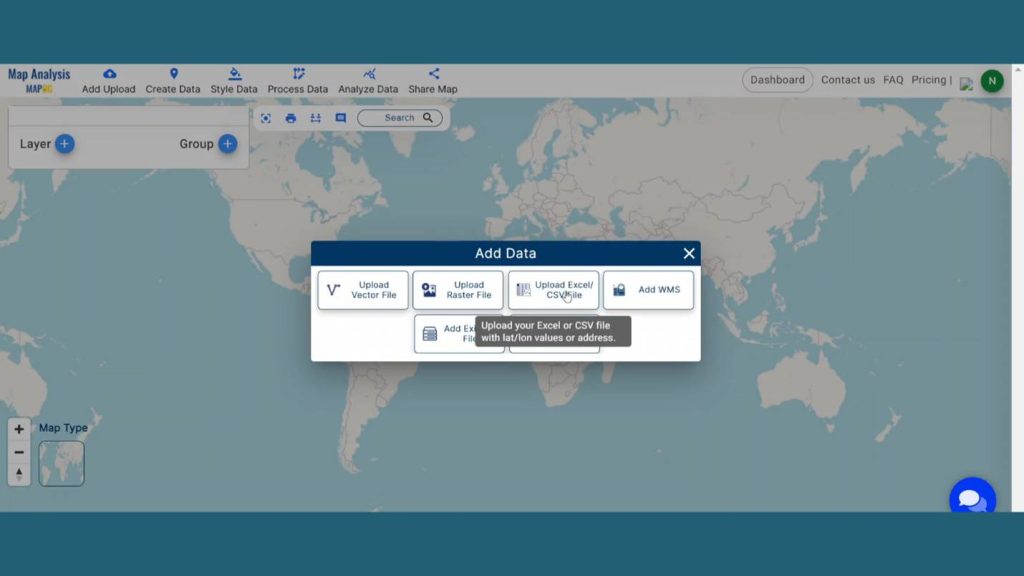
Now, open map analysis interface. Then click on Add Upload button from header. A dialogue box will open. Click on Upload Excel/CSV file to upload the data.
A box will open on the right side of the screen, select browse option to browse the data & click Upload to upload the data.
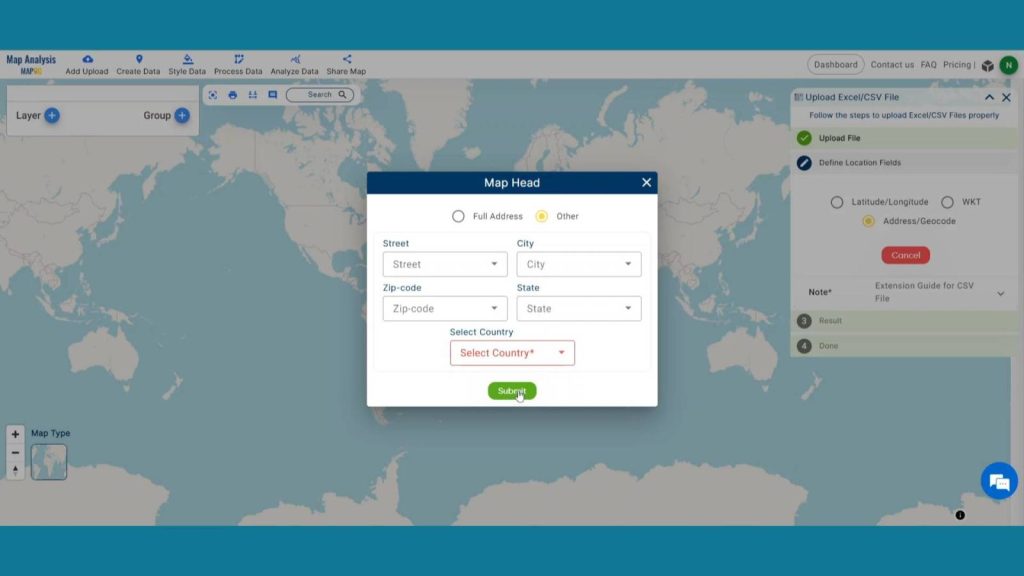
Then in Locational field there has 3 options. Select the Latitude and Longitude option if your file contains Latitude and Longitude data’s. Map o g gives opportunity to upload WKT attributes and Address and geocodes also. In full address select the proper address from drop down or in other option if user have all these information available, they can even select these easily.
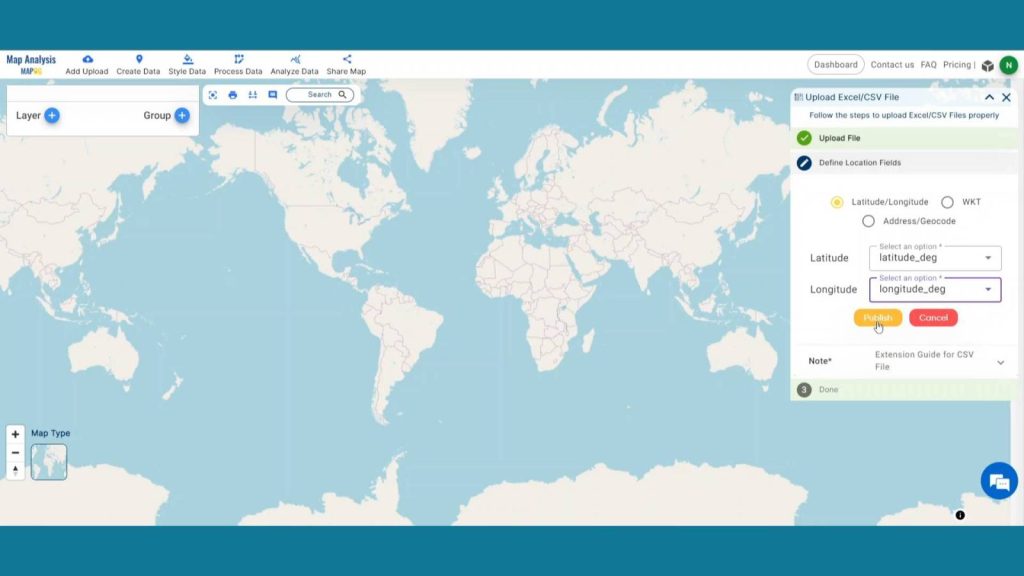
Here we have Latitude and Longitude data. So, we are going to choose that option select Latitude & Longitude the options from drop down menu and publish it.
Unlock the power of convenience! Plot ATM locations on a map and embed on your website, leveraging point data creation and styling for enhanced user experience and accessibility.
Step 2: Save Map
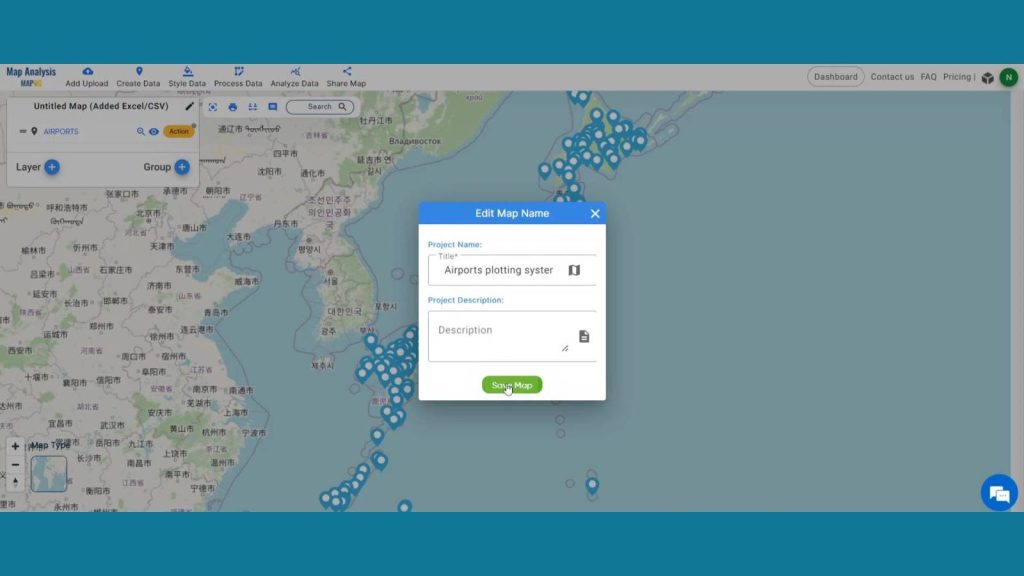
Now, click on the pencil icon situated right after the “Untitled Map” text to save the project. In the dialogue box write proper name and description that describe the project accurately. And click on Save map option. Your project will be saved.
Step 3: Add New Icons
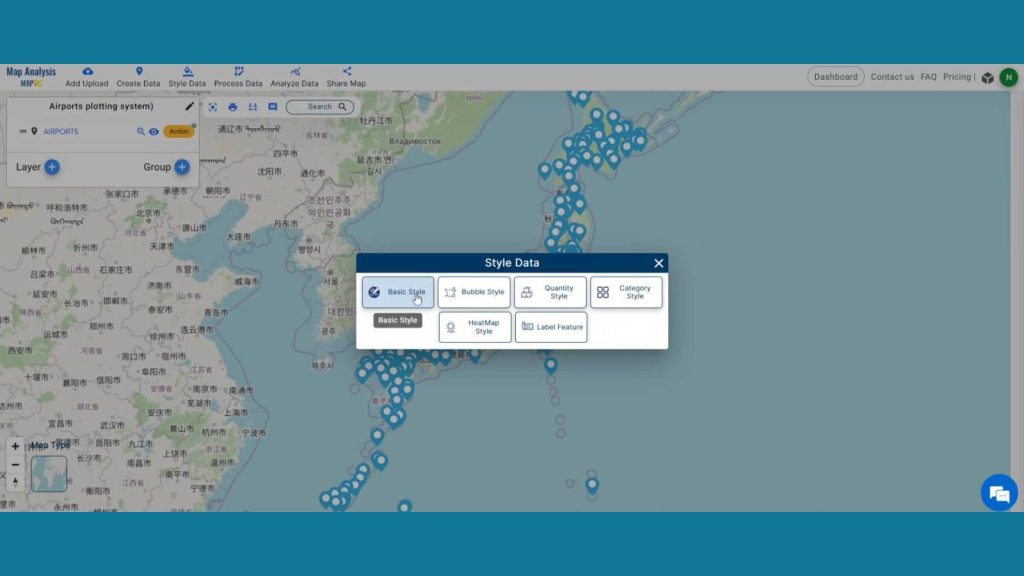
After saving the map go to the Style data option at the top to enhance visualization. Then click basic style data.
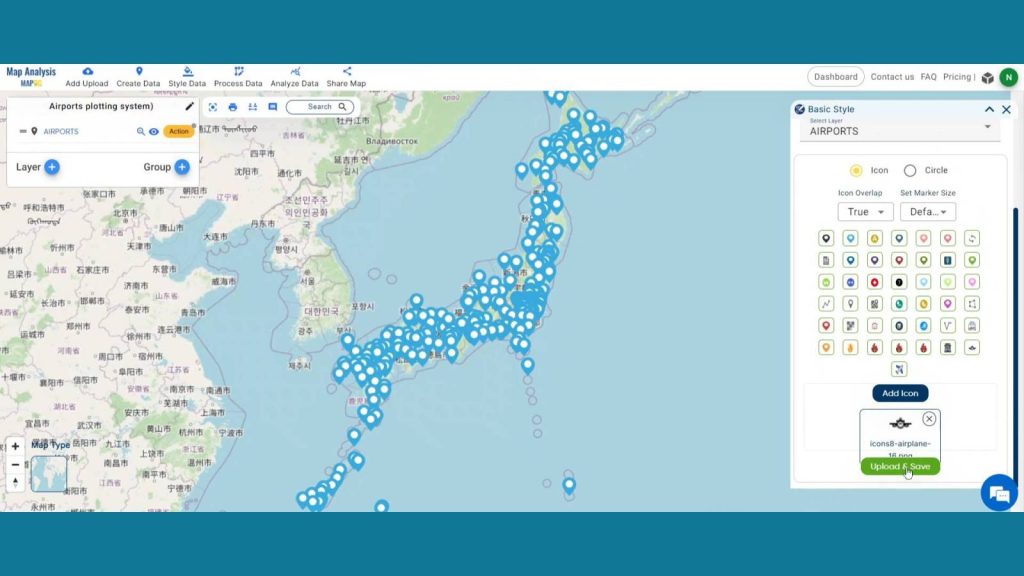
In the edit layer option select the layer to be published. To take this map in a new level let’s add new icons to it. MAPOG already has numerous icon styles but it lets you add new icons to make those maps more personalized. Click on the add icons option placed at last. Then browse your desired icon. Then upload and save it.
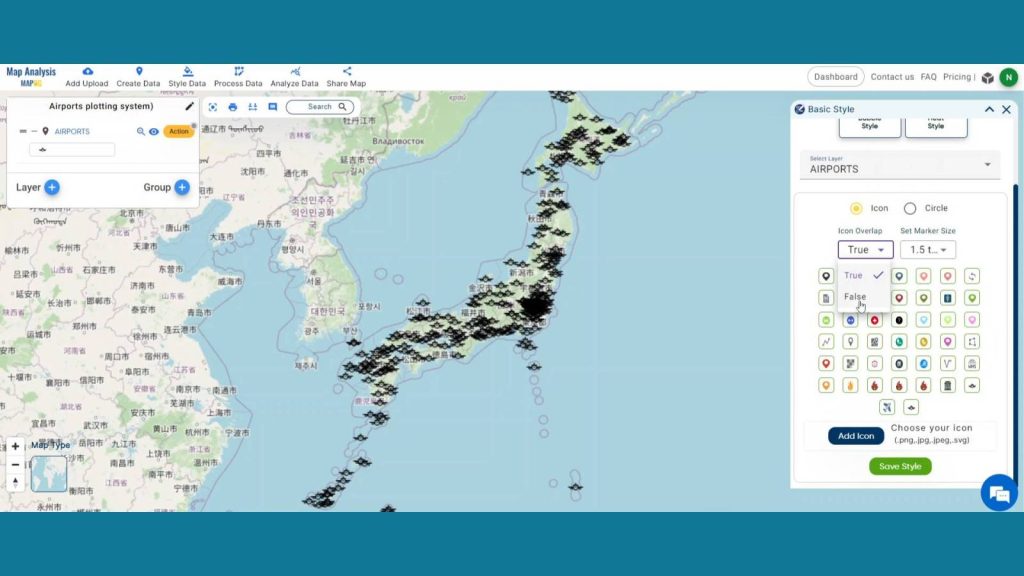
For better visualization purpose MAPOG gives the opportunity to change the size of these icons. In icon overlapping section you can either choose true and false for icon overlapping purpose. Lastly, save style.
Unlock the key to efficient e-commerce delivery with Strategic Logistics Mapping! Explore how isochrone analysis revolutionizes route optimization, ensuring faster and more reliable deliveries for customers, in ‘Strategic Logistics Mapping: Optimizing E-commerce Delivery with Isochrone Analysis‘.
Step 4: Results & Analysis
MAPOG’s integration of Excel file uploads simplified the process of inputting airport data, saving users time and reducing errors. The introduction of new icon styles enhanced the user experience by providing clearer and more intuitive representations of airports on the map, thereby improving navigation and usability. Overall, these enhancements contributed to a more efficient and user-friendly airport plotting experience.
Enhance airport and infrastructure security with buffer maps! Explore how “CREATING BUFFER MAPS TO IMPROVE THE SECURITY OF AIRPORTS AND OTHER INFRASTRUCTURES” ensures enhanced protection and risk mitigation, safeguarding against potential threats and vulnerabilities.
Major Findings
1. Increased Accuracy: Excel file uploads ensure precise airport data integration, reducing mapping errors and improving data integrity.
2. Enhanced Visual Clarity: Introduction of new icon styles facilitates quicker identification of airports on the map, improving user navigation and interpretation.
3. Streamlined Workflow: Integration of Excel uploads and new icon styles optimizes the airport plotting process, saving time and enhancing overall efficiency for users.
Domain and Industry
For the aviation industry, travel and tourism, logistics and transportation, and other fields, this map is a very useful tool.
Questions
- How does MAPOG handle the integration of Excel files for plotting airport locations, and what advantages does this offer in terms of data management and accuracy?
- Can you elaborate on the process of implementing new icon styles in MAPOG for airport representation, and how does this contribute to enhancing user experience and visual clarity?
- In what ways does the digital mapping of airports with MAPOG facilitate logistical operations for airlines and cargo companies, and how does this impact overall efficiency?
- How does MAPOG’s capability to plot airports contribute to urban planning initiatives, and what potential benefits does this offer for city infrastructure development and transportation network optimization?
Conclusion
In conclusion, integrating Excel file uploads and implementing new icon styles in MAPOG revolutionizes airport plotting, enhancing accuracy and visual appeal. This advanced functionality not only streamlines operations but also enriches user experience, marking a significant stride in efficient mapping technology.
Here are some other blogs you might be interested in
1 thought on “Plotting Airports on MAP: Simplifying Logistics and Planning”