In the modern world, electricity is the lifeline powering various infrastructures, industries, and households. But power lines are vulnerable to damage from various natural and anthropogenic factors, with vegetation interference being a significant concern. In this scenario, we can utilise MAPOG to conduct power line vulnerability analysis. This article explores the identification of high-risk vegetation intersections along powerlines using MAPOG tools, enhancing maintenance and risk mitigation strategies.
Key Concept– Power Line Vulnerability Analysis
Vegetation encroachment on power lines poses a substantial risk, potentially leading to the risk of outages, equipment damage, and even safety hazards such as wildfires. The MAPOG proximity analysis tool enables the precise mapping and analysis of the proximity between power line infrastructure and vegetation features, by highlighting the points of their intersection. This power line vulnerability analysis facilitates data-driven decision-making by identifying and addressing vegetation-related risks to power line infrastructure. Moreover, we encourage readers to explore further articles on our blog encompassing diverse facets of energy industry, such as Create Map – DIGITIZING SOLAR, HYDROELECTRIC, WIND AND BIOMASS POWER PLANTS – RENEWABLE ENERGY, and also within other realms like Mapping Tourist Spots Reachable Within an Hour with Isochrone Maps and Mapping highway Buffer and Building Overlap Analysis – Extend Roads Width. The links for GIS Data which we are using here are mentioned at the end of the article.
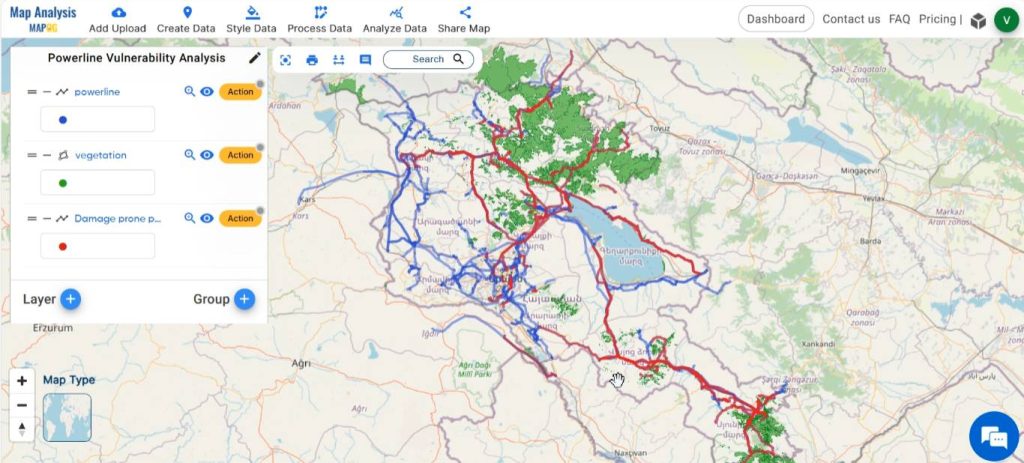
Follow the below process Step-by-step for Power Line Vulnerability Analysis
Step 1: Open Map Analysis
Open Map analysis interface from MAPOG platform.
Step 2: Upload data
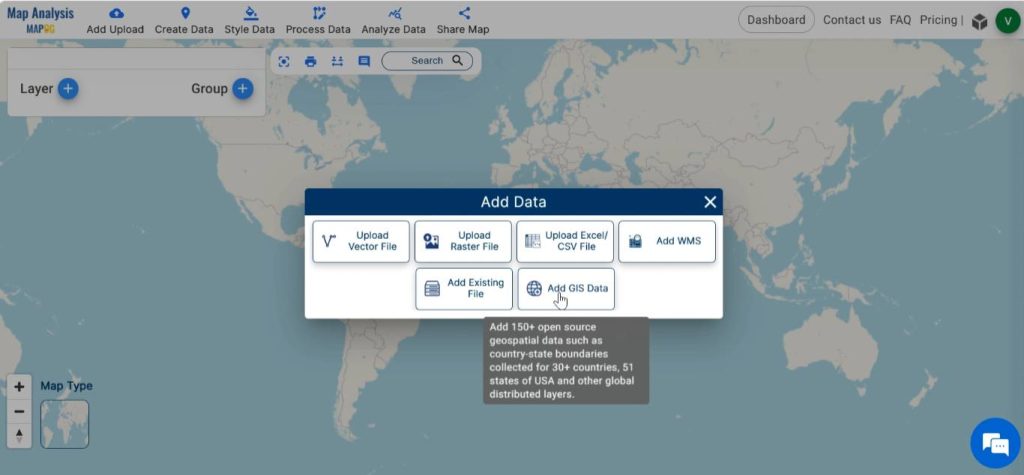
At first add all the data required for the analysis. For this click on the Add Upload option from the menu bar at the upper left end, and then go to the Add GIS Data option.
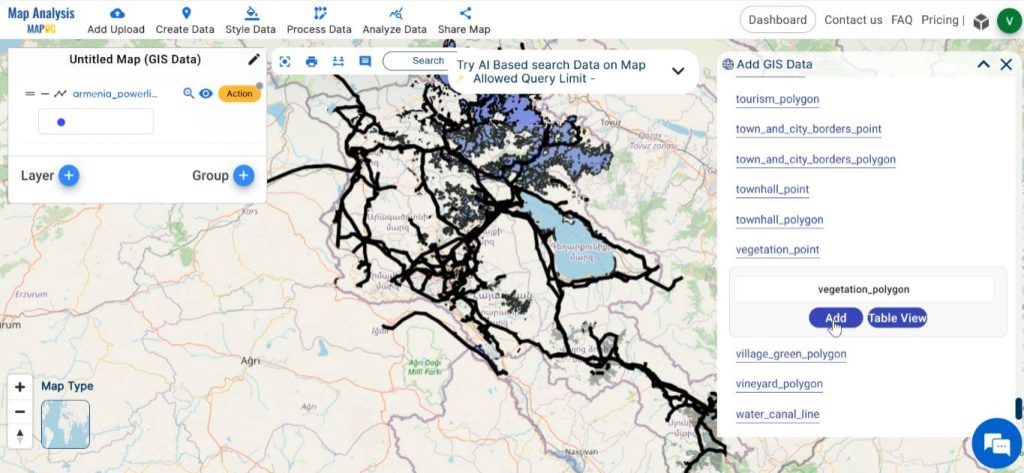
Select the country of your preference from the GIS data. Scroll down and Add power line data and vegetation polygon. Table view option facilitates the preview of the data table of the chosen layer.
Step 3: Save map
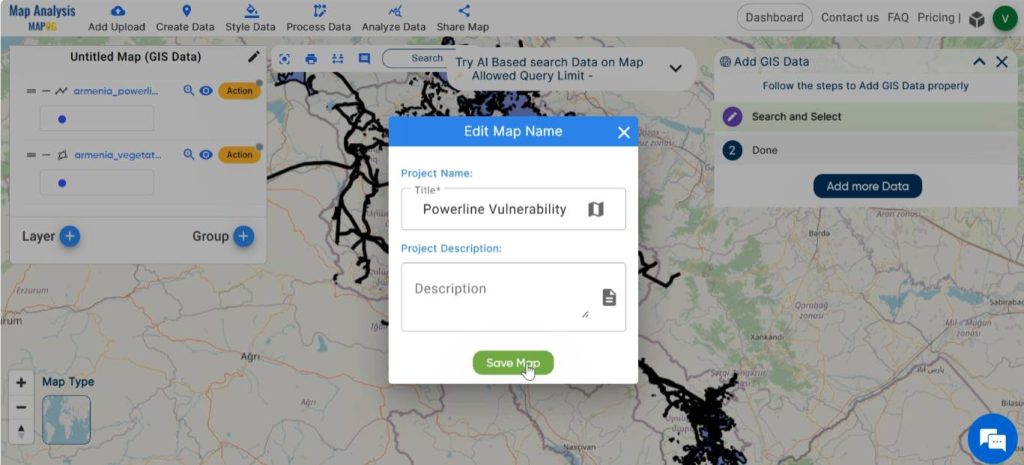
Then appropriately name and save your map. For this, click on the pencil icon near the “Untitled Map” text. Enter a suitable name, and if needed, provide a brief description of your project. Finally, save the map by clicking on the “Save Map” button.
Step 4: Rename Layer
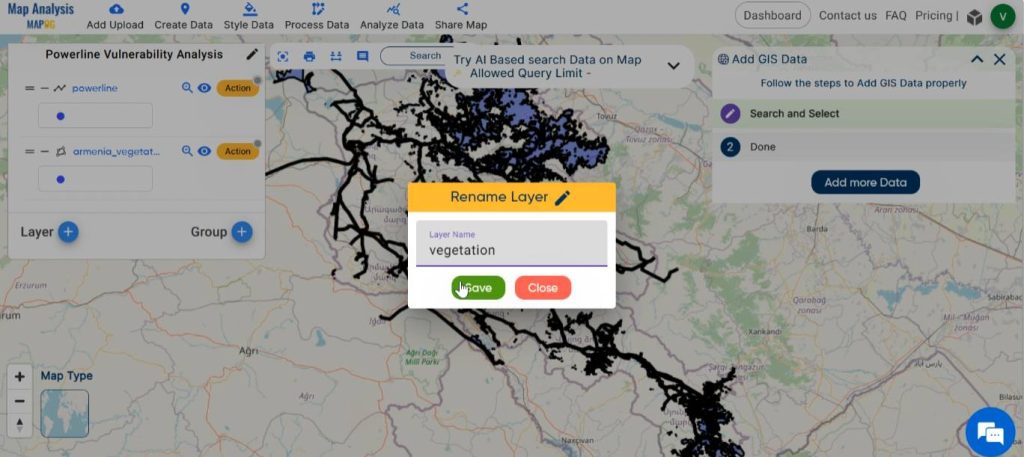
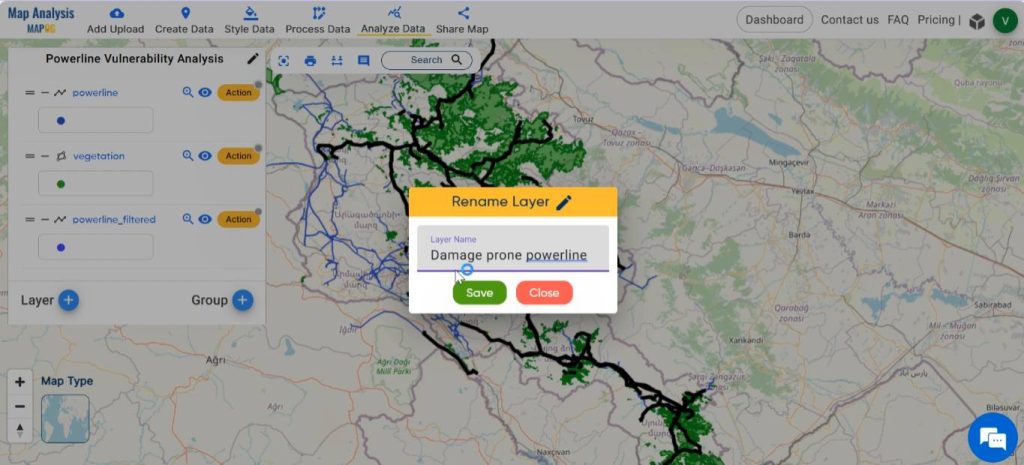
Click on Action near the layer and select the pencil icon to edit the name of the layer. Enter a suitable name. Then, click on save.
Step 5: Style the layers
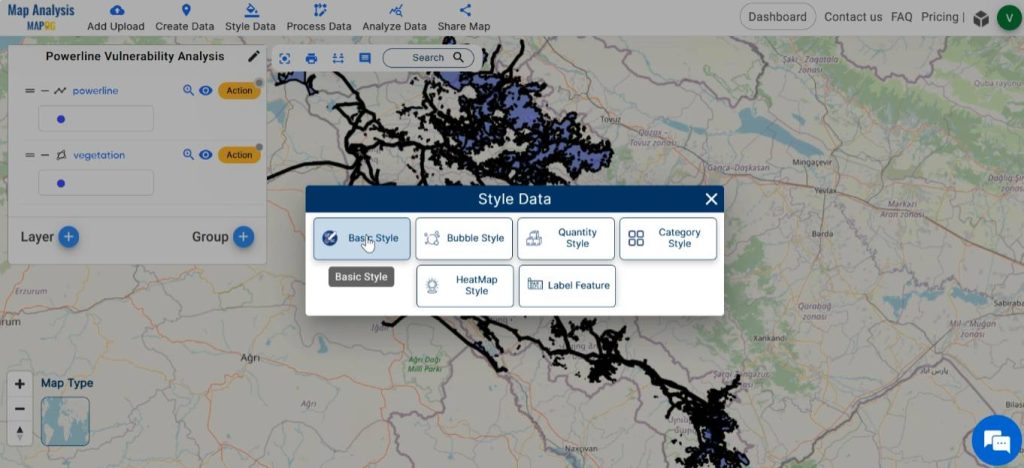
For enhancing the visual appearance of the map, style the layers with various colours. In order to style, click on Style Data in the menu bar and select Basic style. On the other hand, this can be also done by selecting Basic Style from the Action.
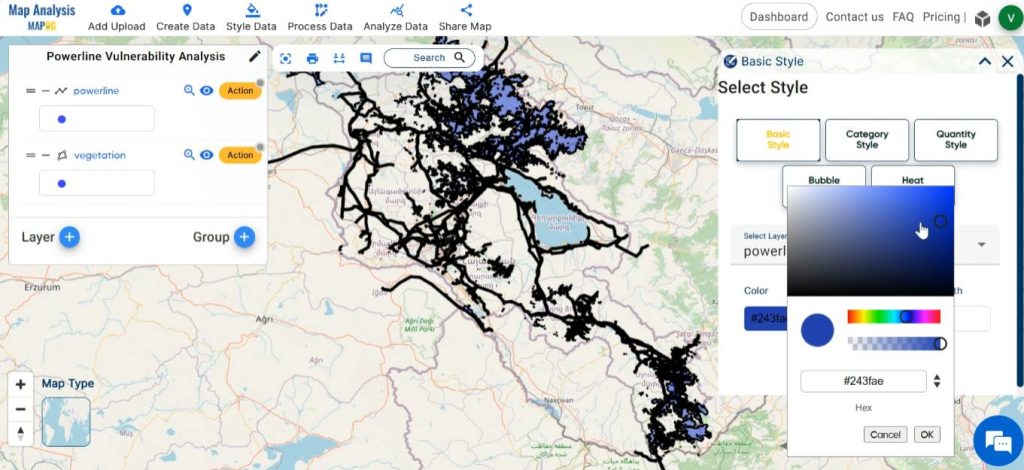
Choose suitable colour gradients and finally save your changes by clicking on Save style.
Step 6: Identify Areas of Vegetation Crossing Power Lines
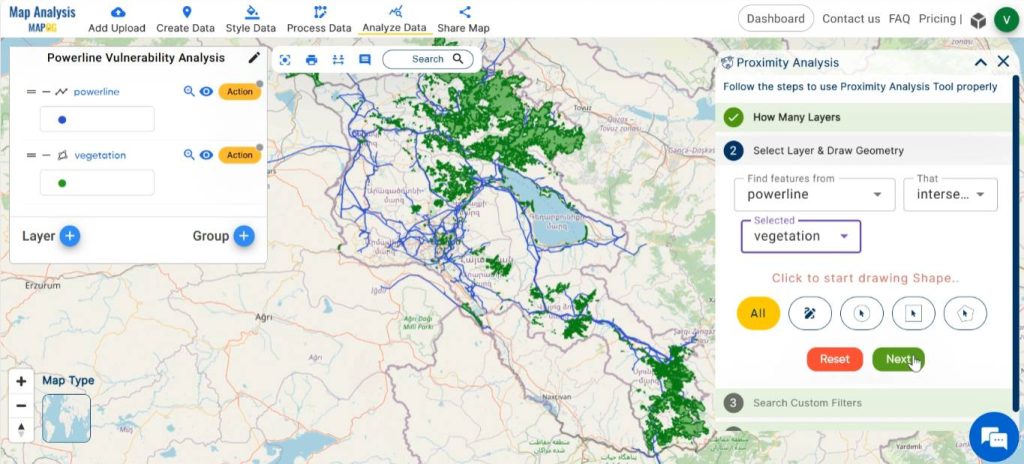
To identify the areas where power line sections intersect with vegetation, select Analyze data from the menu bar. Then select the Two layer option.
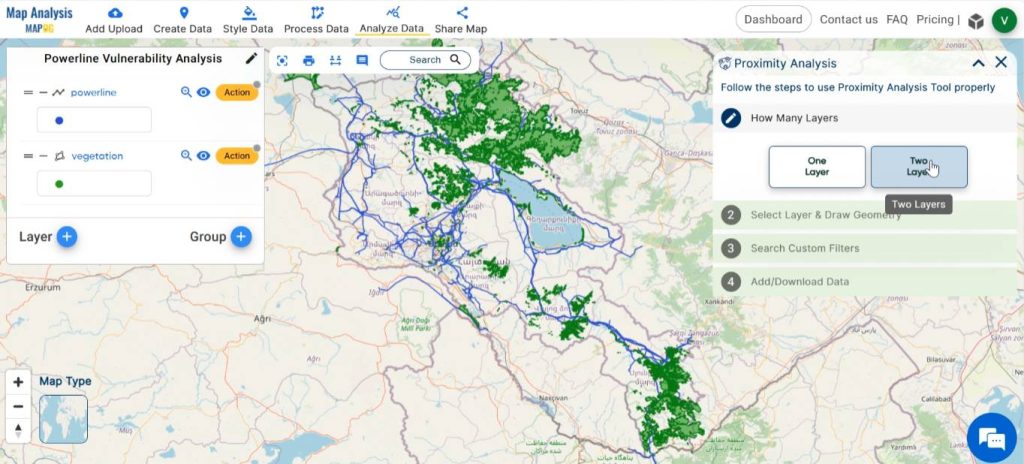
In the “find features” tab, choose the power line layer. Next, Specify the option “that intersects”. In the following tab, select the vegetation layer. After selecting the accurate data, click on Get Results.
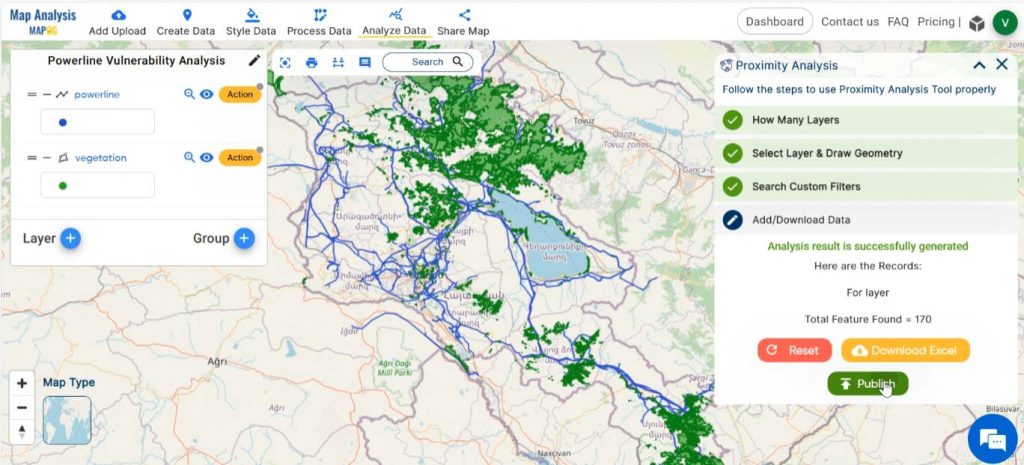
After the analysis, the number of results found is displayed in the window. Now, the result can be downloaded as an excel file with the option Download Excel or can be displayed in the map using the Publish option.
Step 7: Modify the filtered layers
By clicking on the pencil icon in the Action, rename the filtered-out layer.
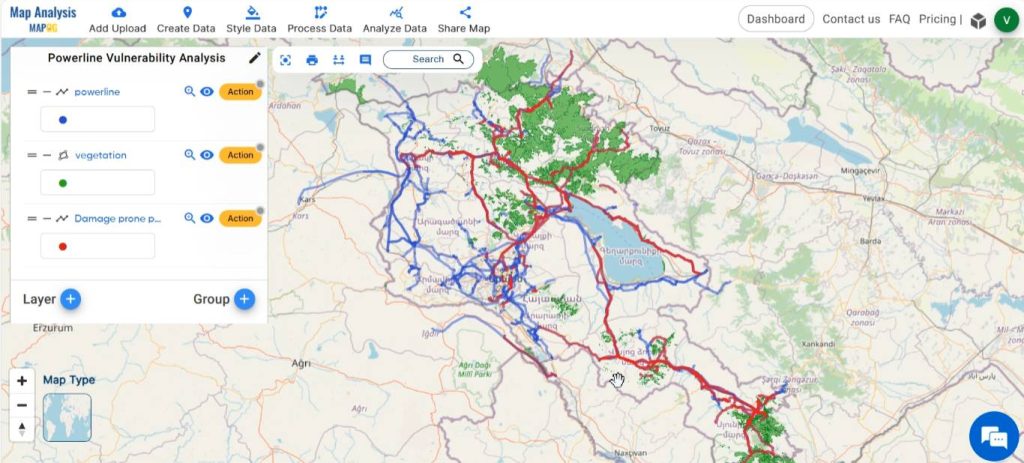
For a better visualisation, style the filtered layers with basic style. Choose appropriate colour gradients to enhance the layer representing damage prone power lines. At last, click on save.
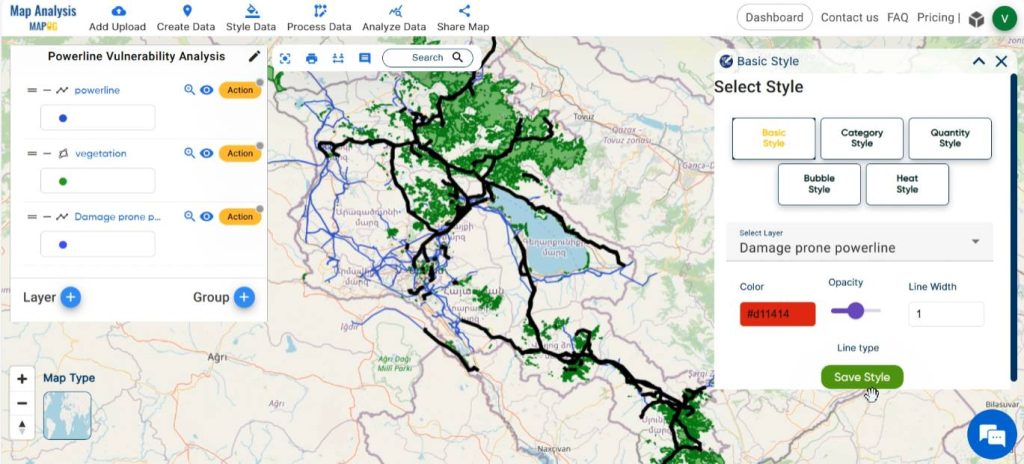
Finally, we have created a map for power line vulnerability analysis highlighting the regions where power lines are intersecting with vegetation, thus making the power lines highly vulnerable to damage.
Step 8: Share Map
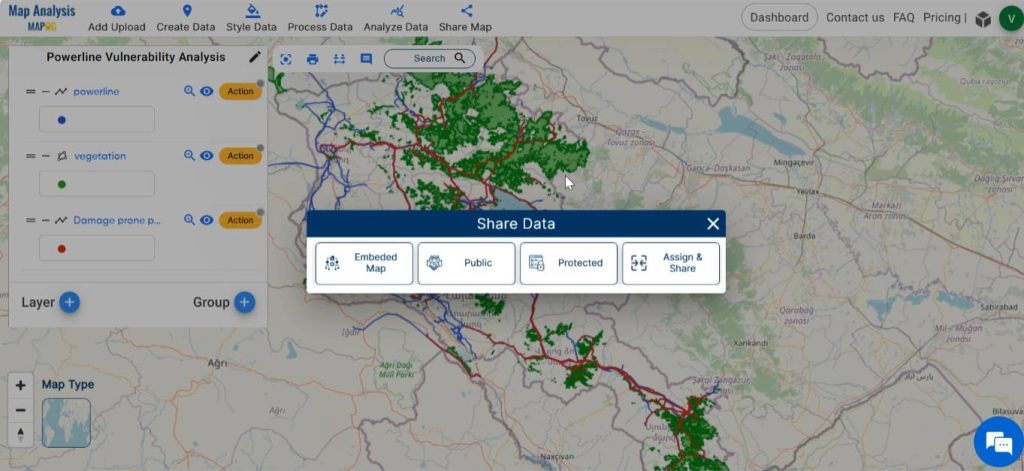
Using the Share tool, share the map or post it on social media.
Major Findings of Power Line Vulnerability Analysis
- High risk zones: Identification of specific geographic areas where power lines intersect with vegetation, indicating potential vulnerabilities to damage or disruption.
- Proactive maintenance: By identifying sections of power lines vulnerable to damage due to vegetation interference, utilities can prioritise maintenance efforts to mitigate potential risks before they cause costly failure.
- Enhanced reliability: Improves the reliability of power distribution networks by reducing the likelihood of outages.
- Visual presentation: This map visually represents the spatial distribution of vegetation intersecting with power lines, facilitating the identification of priority areas for targeted vegetation management activities.
Industry and Domain
- Utility companies: This facilitates identification of sections of power lines at high risk of damage and where vegetation intersects with power lines. Thus, helps to prioritise maintenance efforts, reducing downtime, and improving overall reliability.
- Government Agencies: They can use it to ensure that utility companies are effectively maintaining their infrastructure and meeting safety standards. Additionally, this can inform policy making related to vegetation management around power lines to reduce the risk of wild fire.
- Emergency response teams: This helps them to develop more effective emergency response plans and allocate resources efficiently during natural disasters or other emergencies.
- Environmental Organisations: Power line-vegetation intersection data helps them to advocate for environmentally friendly vegetation management practices.
- General Public: Ultimately, the general public benefits from improved reliability and safety of the power grid.
Conclusion– Power Line Vulnerability Analysis
MAPOG is a powerful tool in power line vulnerability analysis, particularly concerning vegetation interference. By accurately identifying high-risk vegetation intersections, MAPOG proximity analysis tool enables utilities to prioritise maintenance activities and optimise resource allocation. Through proactive management strategies informed by MAPOG, the resilience of power line networks is strengthened, ensuring reliable electricity supply for communities.
GIS Data Links
Explore more content on our blog:
Protecting Wetlands: Guide to Create GIS Map for Nature
GIS Analysis in Urban Planning: Reshaping Transportation Future Insights of state/city
Fast Emergency Response: Using GIS and Isochrone Maps for 10-Minute Ambulance Arrival