Welcome to our wind energy exploration journey with MAPOG, our trusty map analysis tool! Today, we’re on a mission to find the perfect locations for wind turbines, ensuring efficient energy production. Join us as we witness how MAPOG simplifies this process of Selecting Windmill Sites Based on Key Factors. Let’s dive into the world of wind energy optimization!
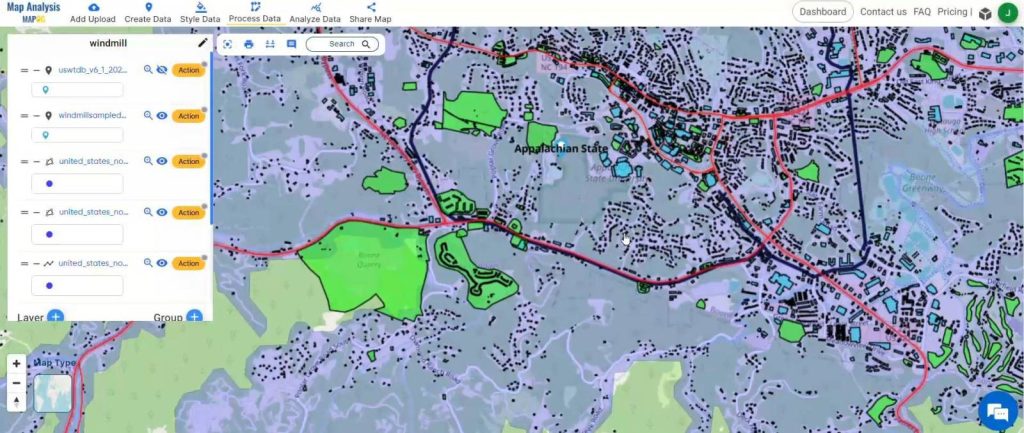
Key Concept
In wind energy optimization, MAPOG offers a groundbreaking solution for site selection of wind turbines, seamlessly integrating vital data layers like land use, buildings, roads, and powerlines. This advanced GIS Data tool simplifies the process, ensuring efficient energy production while considering key factors. Moreover, MAPOG extends its versatility beyond wind energy, catering to various use cases such as agriculture, route compass, urban planning, and buffer tools. This comprehensive approach underscores MAPOG‘s role as a multifaceted solution provider, driving innovation across diverse industries and applications.
Step-by-Step Process for Selecting Windmill Sites with MAPOG:
Step 1: Access MAPOG Platform
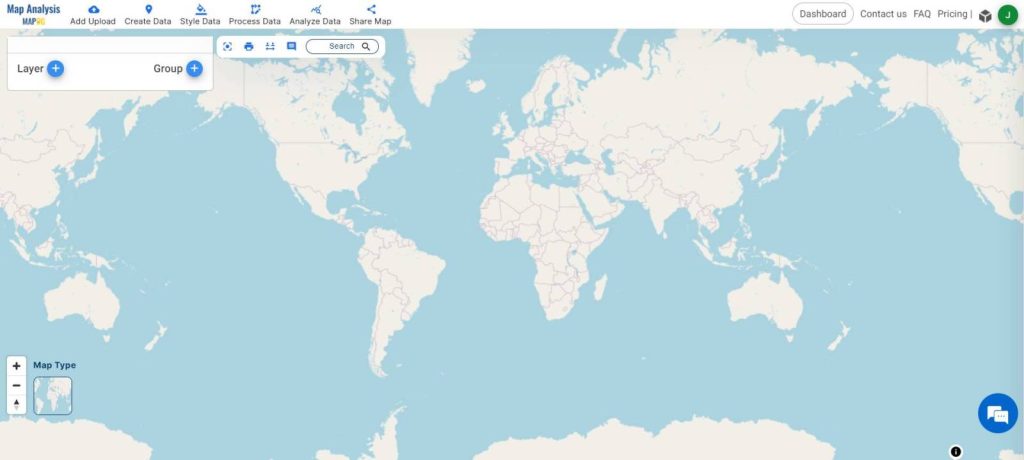
Log in to the MAPOG platform, your go-to solution for wind energy optimization and map analysis.
Step 2: Upload Windmill Data
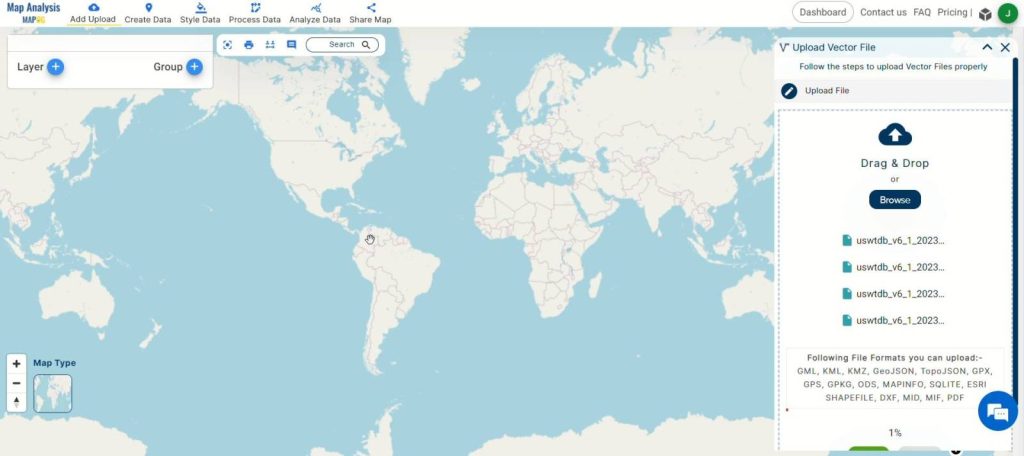
Initiate the process by clicking on “Add Upload” and selecting “Upload Vector File.” Upload your windmill data and clip out a specific region for analysis.
Step 3: Utilize GIS Data Tool
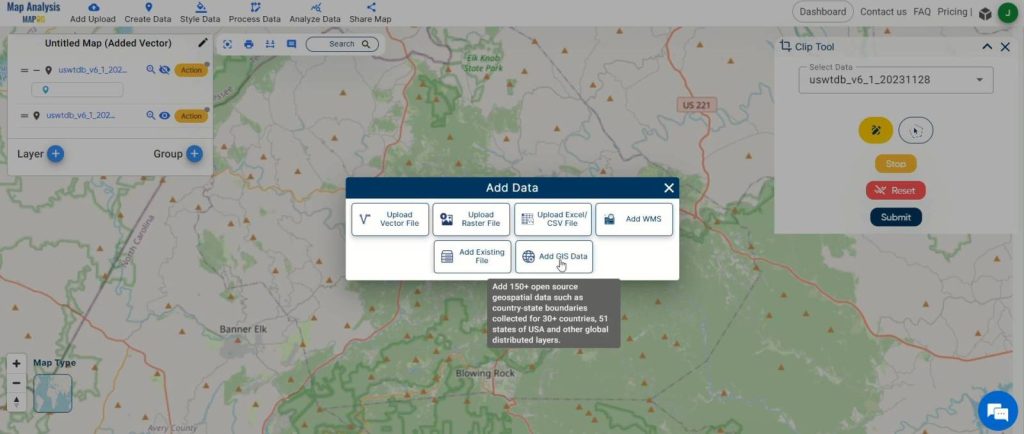
Within the “Add Upload” option, utilize the GIS Data tool to select layers such as land use, buildings, roads, and powerlines. Seamlessly clip the specific region for detailed analysis.
Step 4: Process Data with Isochrone Tool
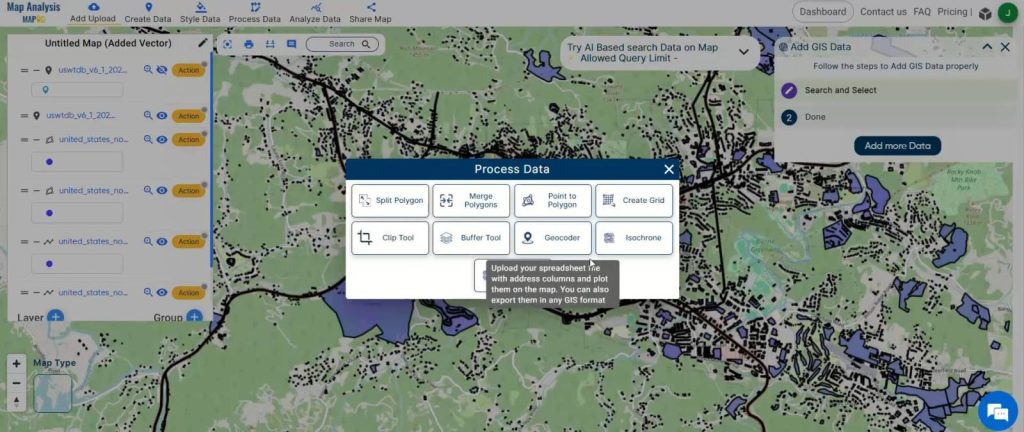
Access the map analysis tool and click on “Process Data.” Choose the Isochrone tool to discover potential windmill sites within your preferred travel time.
Step 5: Customize Preferences
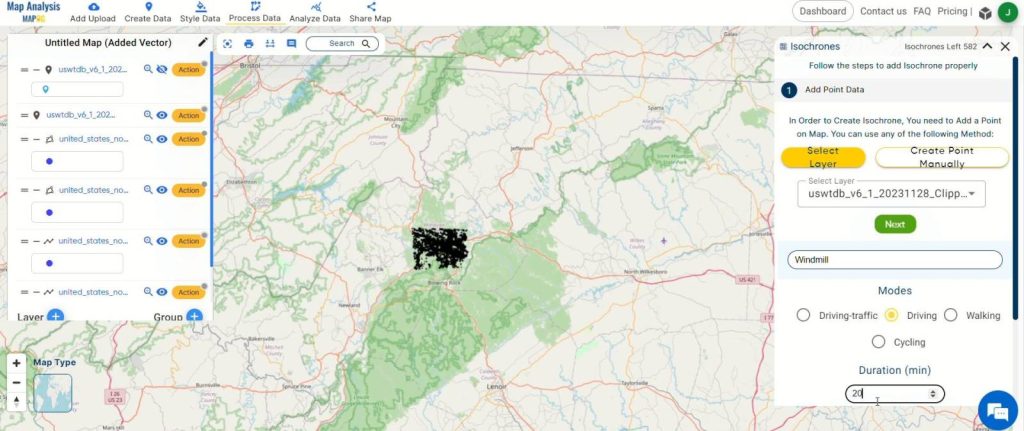
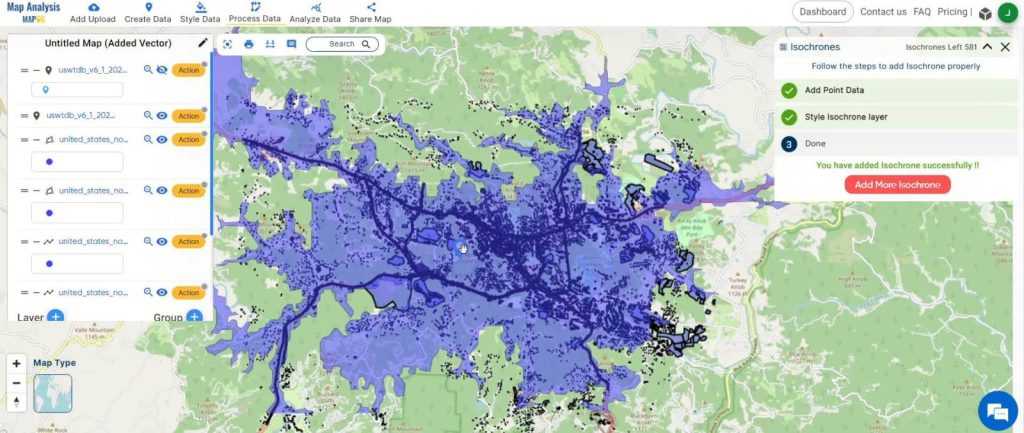
Within the Isochrone tool, select the windmill data layer. Customize preferences by choosing modes of transportation and the desired duration for accurate site selection.
Step 6: Adjust Layer Appearance
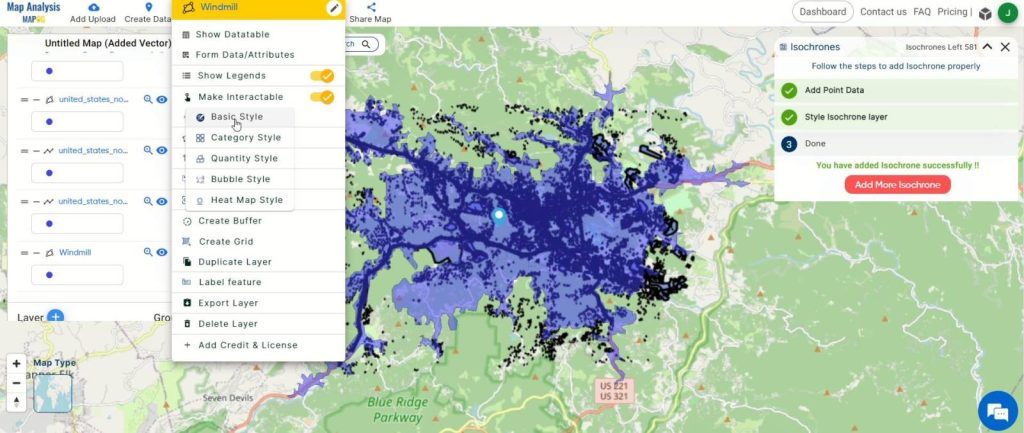
Access the action button to adjust the appearance of created layers. Choose “Edit Style” and opt for the basic style for a simplified visual representation.
Step 7: Label Windmill Points
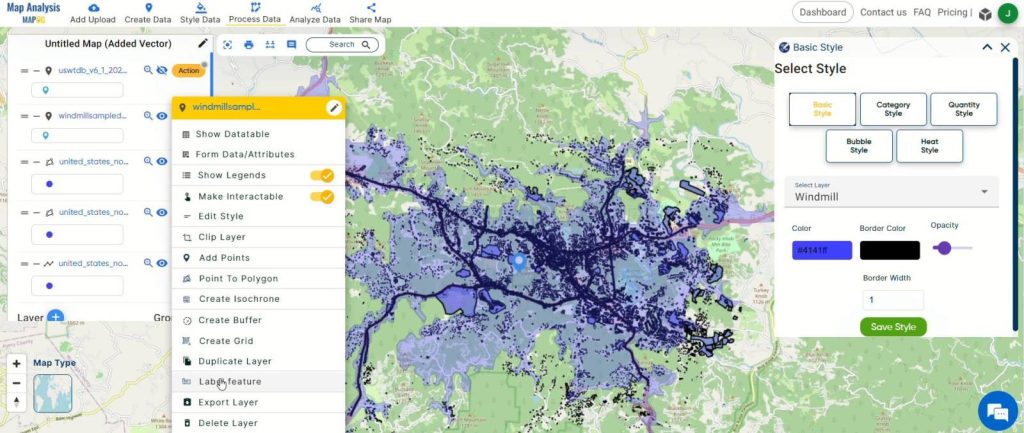
Ensure user-friendliness by labeling windmill points using the “Label Feature” option in the action button of the windmill layer.
Step 9: Organize and Save
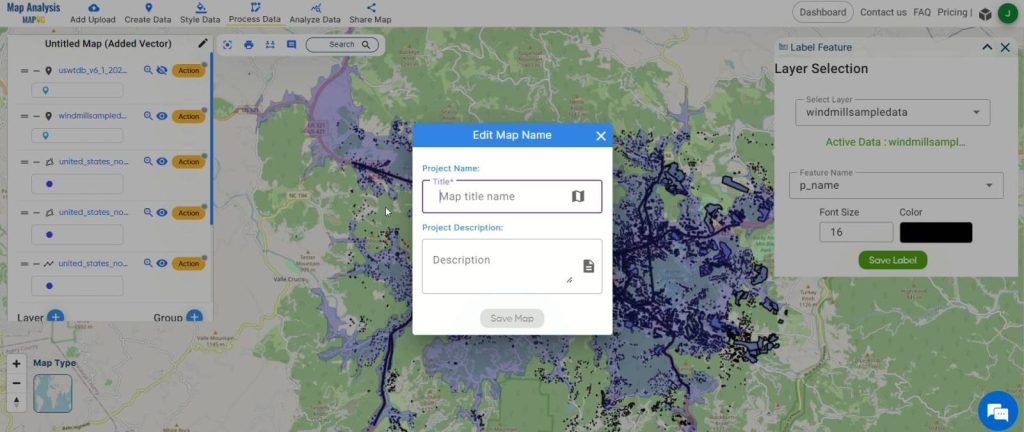
Keep your project organized by renaming your map. Click the pencil icon and choose a fitting name. Hit “Save Map” to apply changes and streamline your project.
Step 10: Effortless Sharing
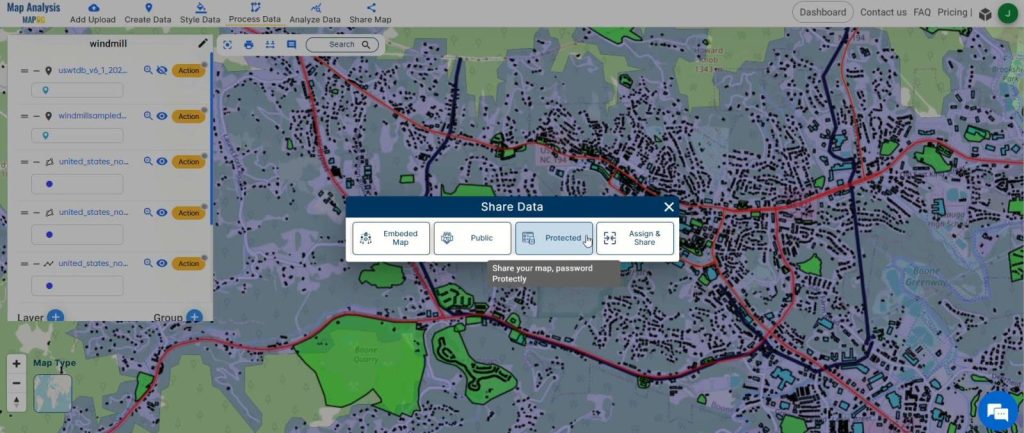
Share your findings effortlessly with colleagues or stakeholders to collaborate effectively.
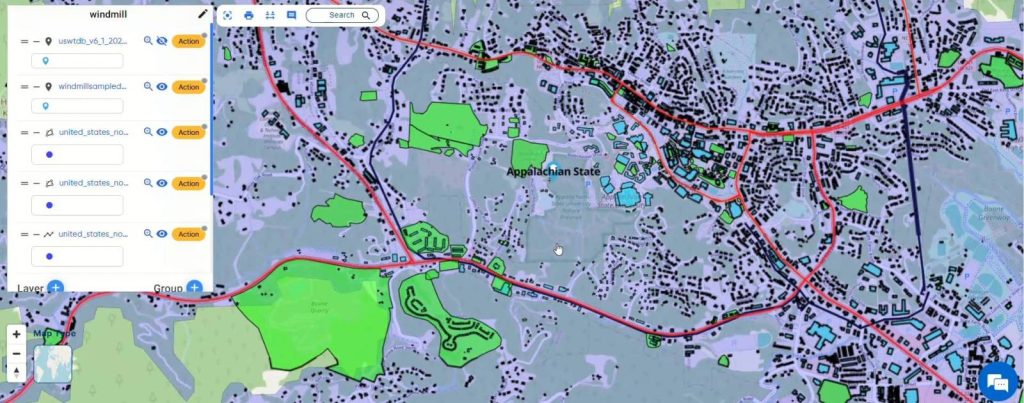
Explore the potential of wind energy optimization with MAPOG‘s step-by-step process, ensuring efficient site selection for windmill installations.
Major Findings in Selecting Windmill Sites with MAPOG
In selecting windmill sites using MAPOG, several key findings have emerged. MAPOG effectively identifies optimal locations by considering factors like land use and powerlines. The integration of data layers is seamless, simplifying the site selection process. Customizable preferences ensure accuracy, while user-friendly features facilitate navigation. Organized project management aids in efficient decision-making. MAPOG‘s analysis capabilities revolutionize site selection, promoting informed decision-making and efficient energy production. Easy sharing of findings fosters collaboration among stakeholders.
Domains and Industries Benefiting
- Renewable Energy
- Engineering and Construction
- Environmental Conservation
- Government and Policy
- Energy Utilities
- Academic and Research Institutions
- Economic Development
- Agriculture and Land Use Planning
- Urban Planning and Development
- Technology and Innovation
Conclusion
In conclusion, windmill site selection with MAPOG offers significant benefits across industries. By identifying optimal locations, MAPOG enhances renewable energy production while minimizing environmental impact. It streamlines development processes, informs policy decisions, fosters economic growth, and promotes sustainability in urban and agricultural planning. For further inquiries or assistance, feel free to reach out to us at support@mapog.com. MAPOG‘s role in driving renewable energy initiatives and sustainable development is pivotal.
Other Articles
- Create Map on Literacy Rate
- Create Map – DIGITIZING SOLAR, HYDROELECTRIC, WIND AND BIOMASS POWER PLANTS – RENEWABLE ENERGY
- Create a Map to find suitable sites for constructing a new house
- Create Map for Analyzing Water Quality using Heat Map Style
- Create Map – School Map Area Coverage Through Buffer Analysis
- Mapping Safety Create GIS Map : Game-Changing Approach to Hospital Risk Analysis
- Create Map for Real Estate Developer for Best Site Selection
- Create Map for Landfill Optimization: Spatial Analysis Approach
- Create Off-Road Hiking Routes: Using Bearing Angles and Distances
- Creating Safe Routes for Armies and Rescue Teams