In today’s digital age, mapping accommodation types has become an essential tool for travelers, city planners, and businesses alike. By utilizing MAPOG’s category style feature, we can represent each accommodation type with variant colors, simplifying the process of identifying and understanding the diverse range of accommodations available.
If you are interested in habitat mapping, then check our article ‘Map habitat locations of endangered animals & keep track of their living‘.
Key Concept for Mapping Accommodation Types
By utilizing MAPOG’s category style, accommodation types such as houses, apartments, and hotels are distinguished by vibrant colors on the map. This simple yet effective method allows for easy identification and understanding of the diverse range of accommodations available in any given area. The link for GIS data is available at the end of this article.
For more information on fast emergency response, check out our article ‘Fast Emergency Response: Using GIS and Isochrone Maps for 10-Minute Ambulance Arrival‘.
Steps for Mapping Accommodation Types
Step 1 Upload the data
Navigating to the MAPOG map analysis tool, add the GIS data for our needs.
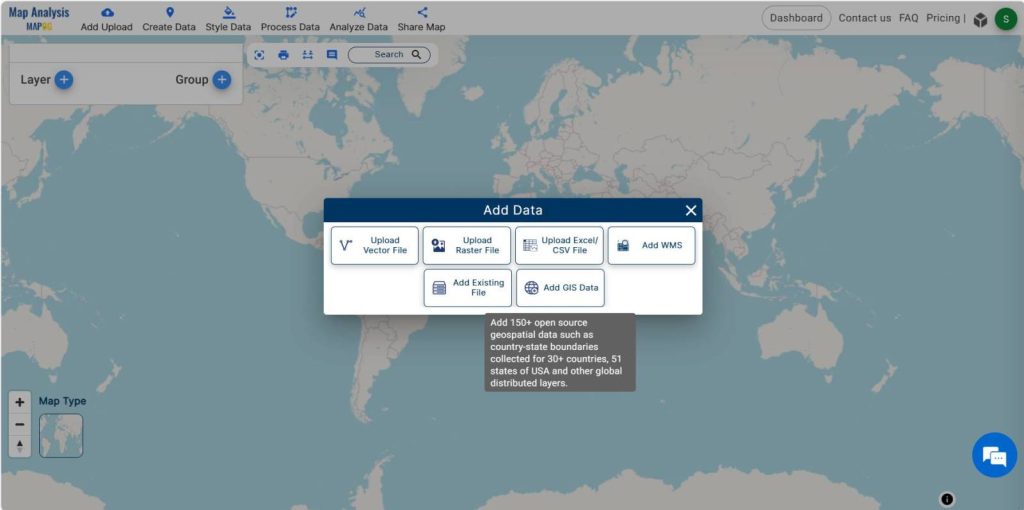
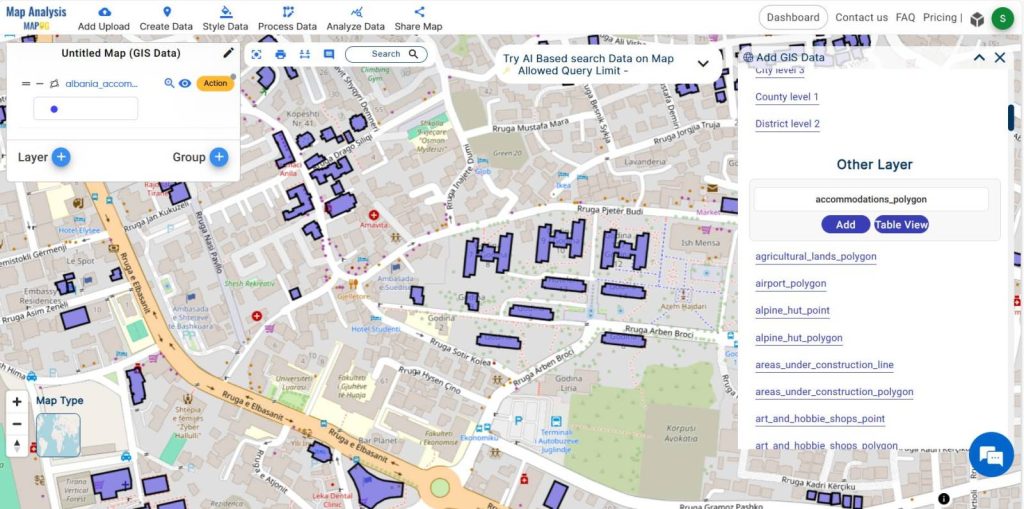
Here, the accommodation data is added to this platform. For that move on to Add upload option and select the Add GIS Data option and add the data. Now the data is visible in the layer option.
Step 2 Project Title
We successfully added accommodation data. Now, we need to rename the untitled project and provide a project description in the description box.
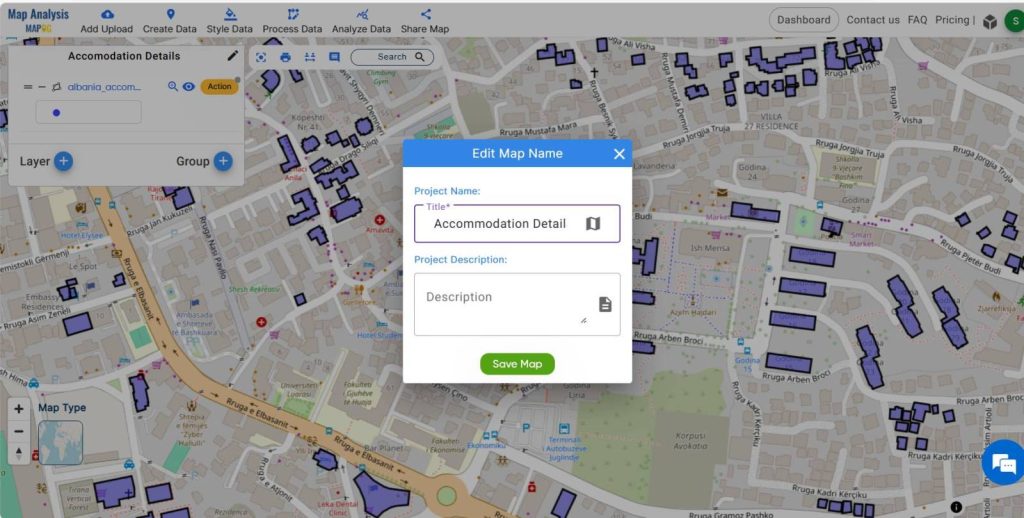
Additionally, we should proceed to the next step by ensuring the project has an appropriate title and detailed description entered in the designated fields.
Step -3 Rename the layers
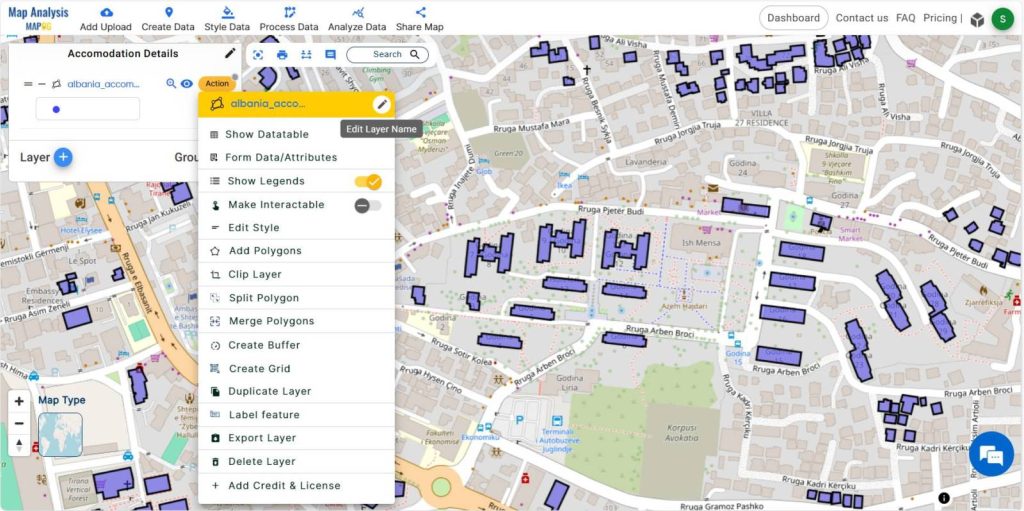
To improve comprehension, select the action button linked to the data layer and proceed to rename the accommodation data layer if necessary.
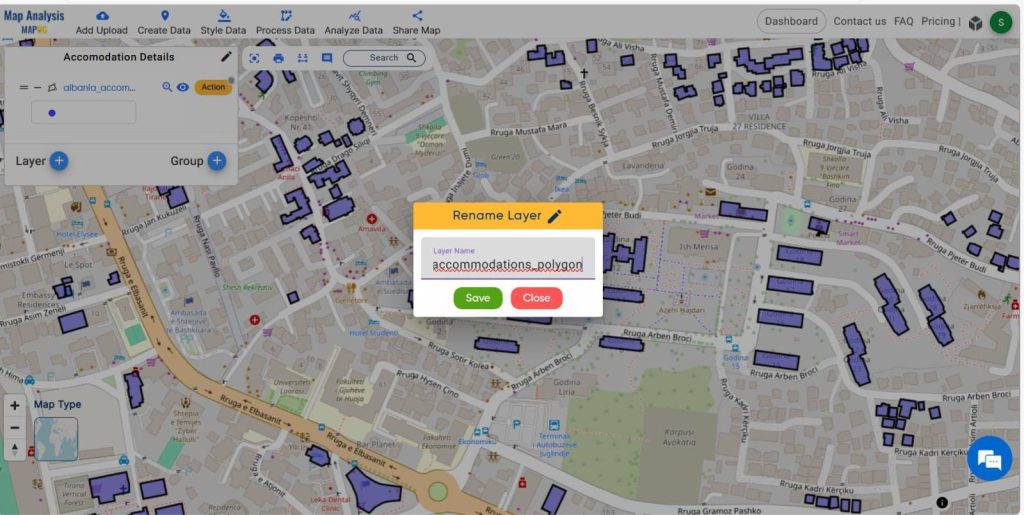
Step -4 Styling
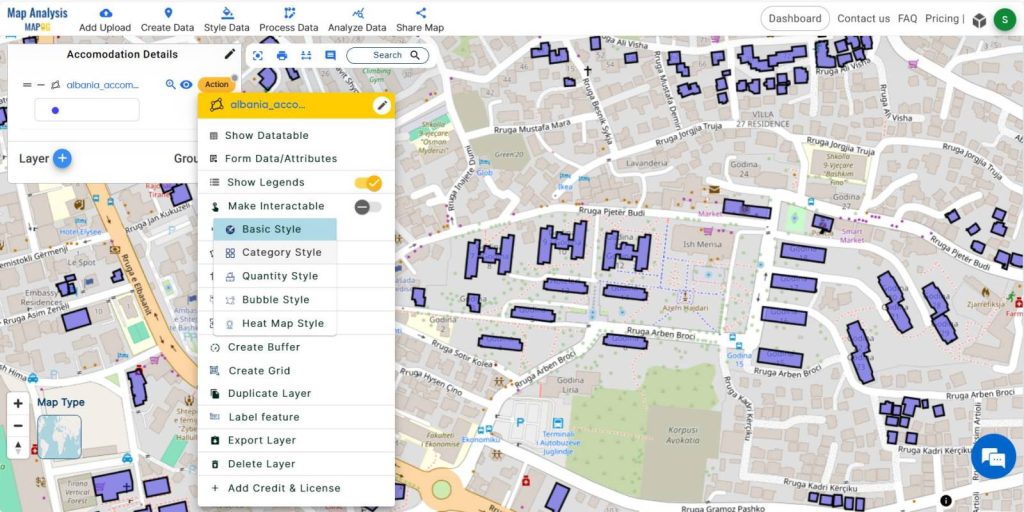
To visualize the accommodation data based upon the area, move on to the action button associated with the data layer, then select the category style.
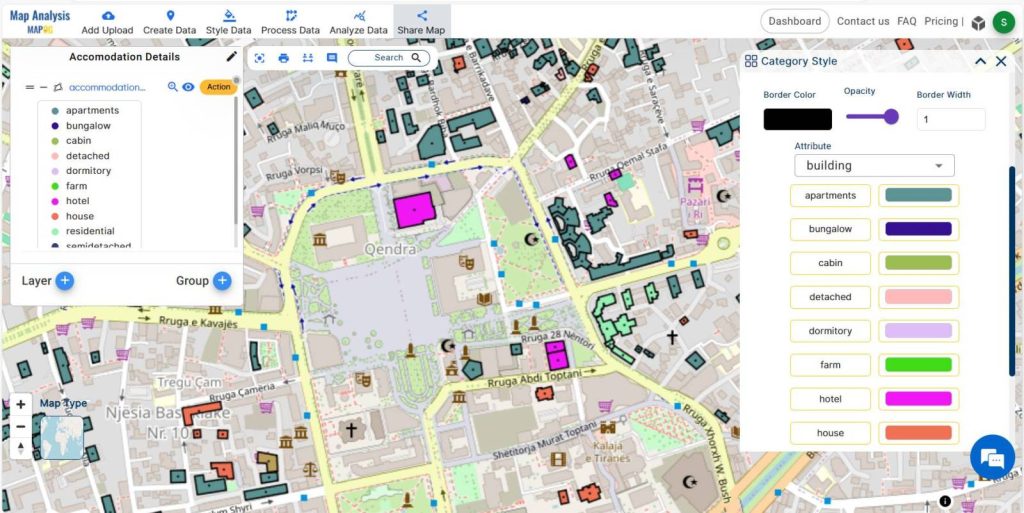
Choose the data layer, then adjust the border color, width, and opacity according to our requirements. Select the attribute as“buildings”and configure the color gradients before submitting it.
Step 6- Export the layer
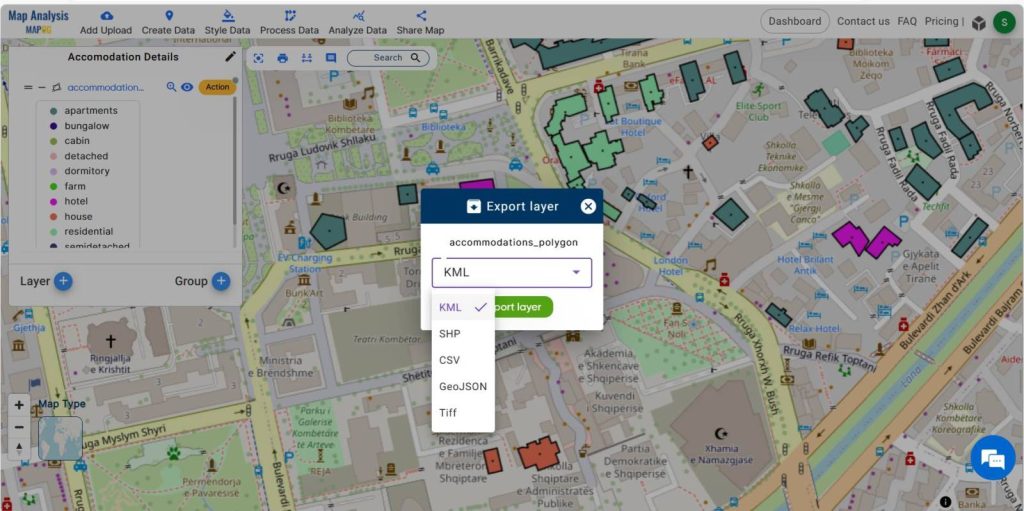
You can export the layer to CSV, SHP, KML formats using export layer option if necessary. For that click on the action button associated with the data layer and select Export layer option.
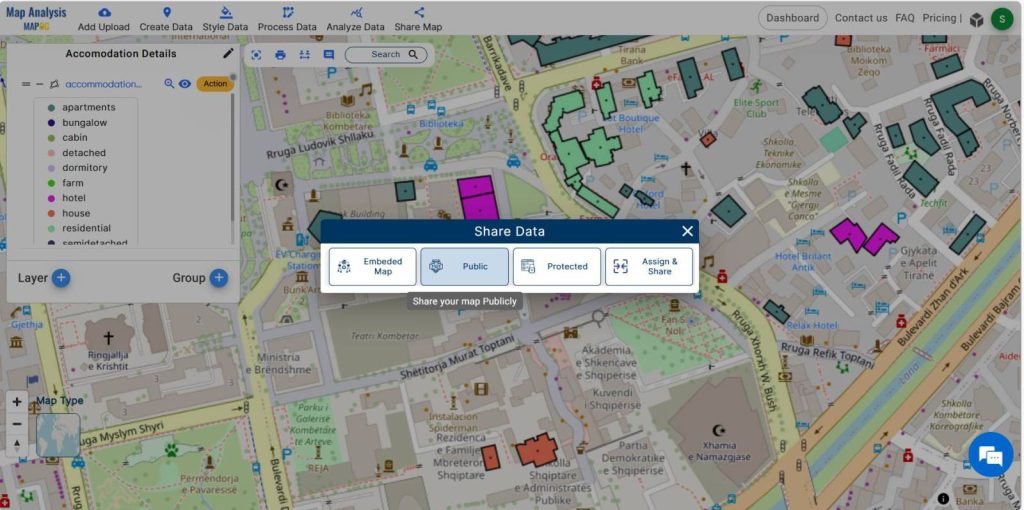
Step 6-Share the map
Share this map to the public using the share data menu.
Major Findings
- Visual Clarity
- Decision Support
- Marketing Insights
- Competitive Analysis
- Stakeholder Engagement
Domain and Industry
In the domain of tourism and hospitality, MAPOG plays a pivotal role in providing valuable insights into accommodation distribution and trends. Tourism agencies, hospitality businesses, and urban planners can utilize MAPOG to make informed decisions regarding accommodation placement, marketing strategies, and infrastructure development.
Conclusion
The use of MAPOG’s category style option revolutionizes the way accommodation data is represented and analyzed. With MAPOG, the journey to understanding accommodation diversity has never been clearer.
You can also go through other works related to wetland conservation.
GIS Data Links-Accommodation Polygon data