Discover the game-changer for post office site selection! MAPOG, the navigator of choice, blends data and strategy to get Suitable Site Selection for Post Office. Bid farewell to long distances and hello to conveniently placed post offices—where seamless service meets you at the perfect spot, transforming mail experiences everywhere.
Key Concepts for Suitable Site Selection for Post Office
The project aims to identify areas lacking post offices in Cambodia and find suitable spaces for new ones using a comprehensive output map. For explaining this use case we’re taking Cambodia as an example. The map’s thematic structure provides fascinating details. Join us on MAPOG for more information. The links for GIS DATA which we’re using here are mentioned at the end of the article.
Get an in-depth understanding of the changing realm of urban planning by reading “GIS Analysis in Urban Planning: Reshaping Transportation Future Insights of state/city” and see how GIS can play a revolutionary role in maximizing transportation for a sustainable and connected future.
Steps to create Suitable Site Selection for Post Office
Step 1: Add GIS Data
First, navigate to the Map Analysis interface. Then click on the “Add upload” button in the upper left corner. A dialogue box will open. Click on “Add GIS Data” to add data.
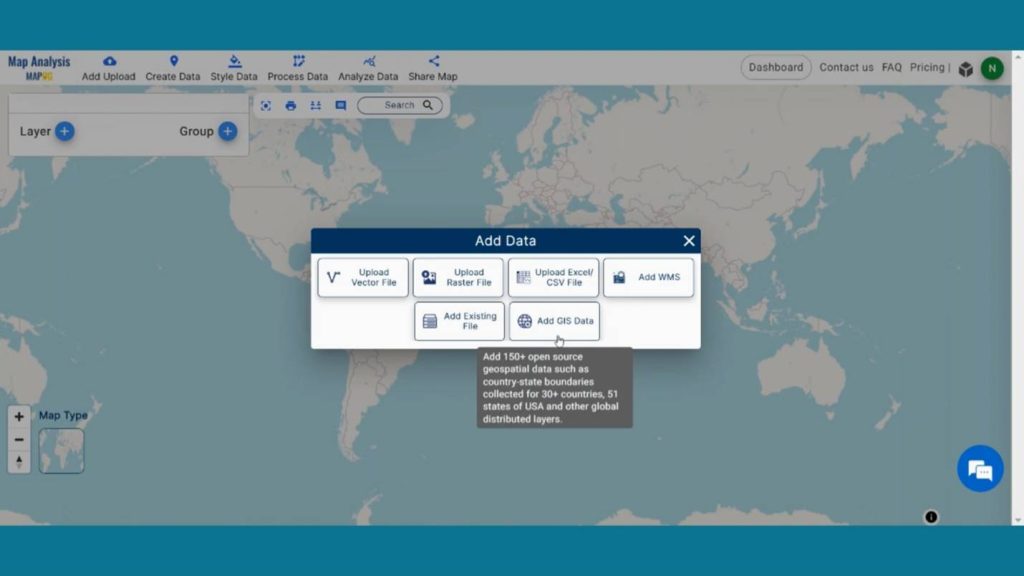
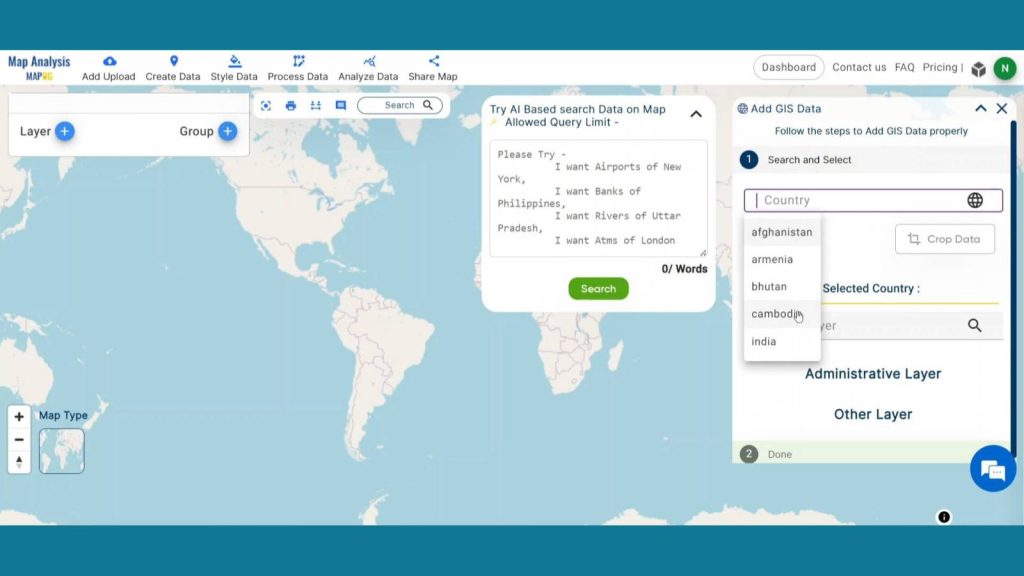
In the right corner box Provide the country name.
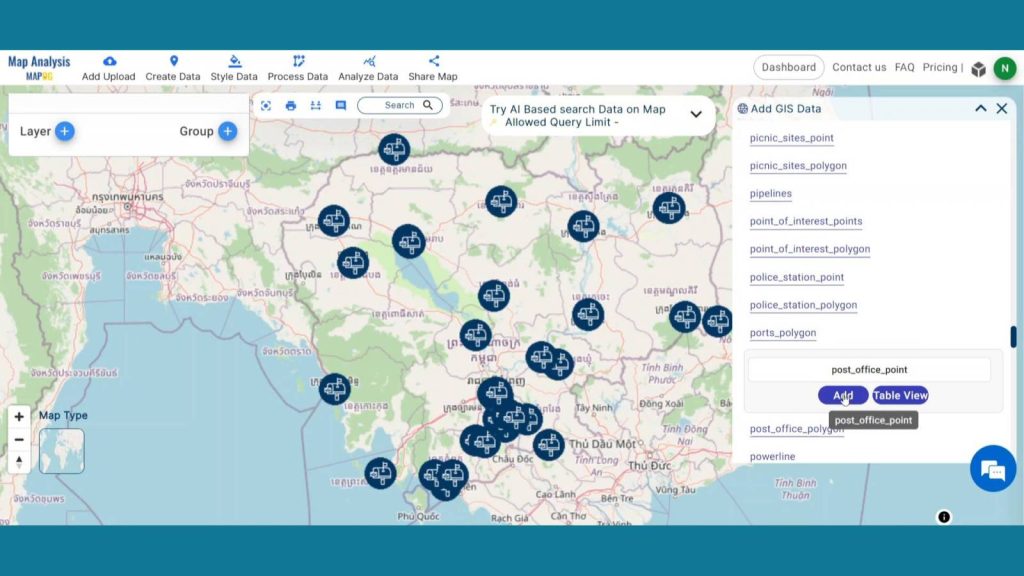
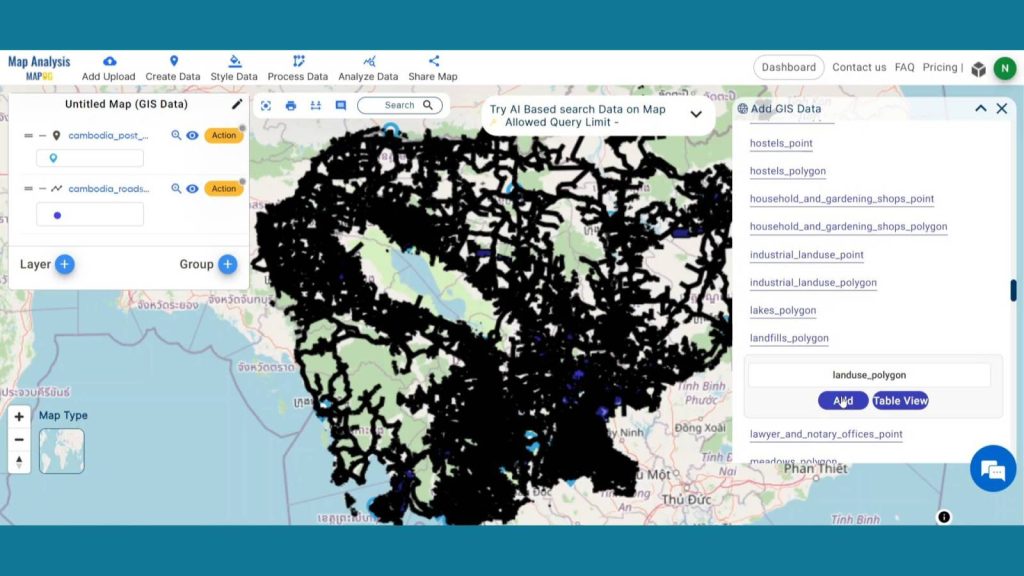
Now, in the other layer option search for post office layer and by clicking Add option add this layer to map canvas.
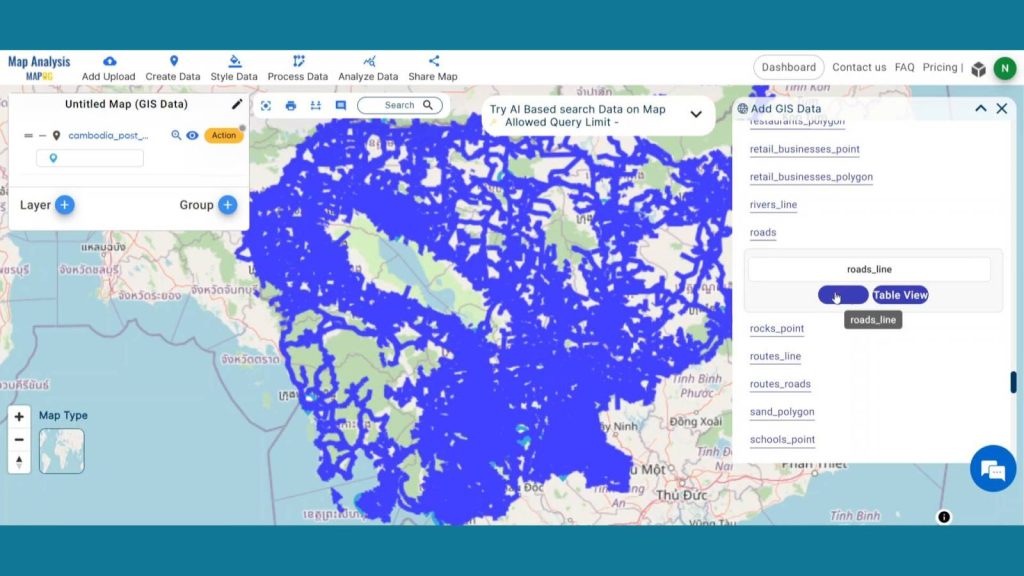
Now, search for Road lines layer and add it.
Lastly, search for land use polygon layer and add it to map canvas.
Step 2: Rename Layer
Now click the Action Button of the Post office layer and click on that pencil icon and rename that layer as Post Office.
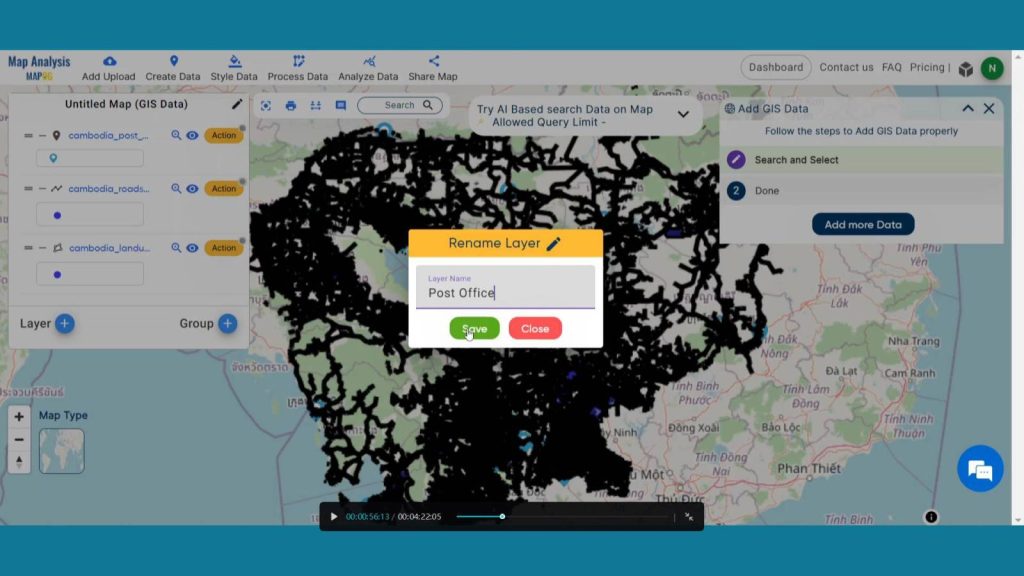
Rename the Road lines as Roads and Land use Polygon as Land use by going through the same process for understanding purposes.
Step 3: Extract Trunk Roads
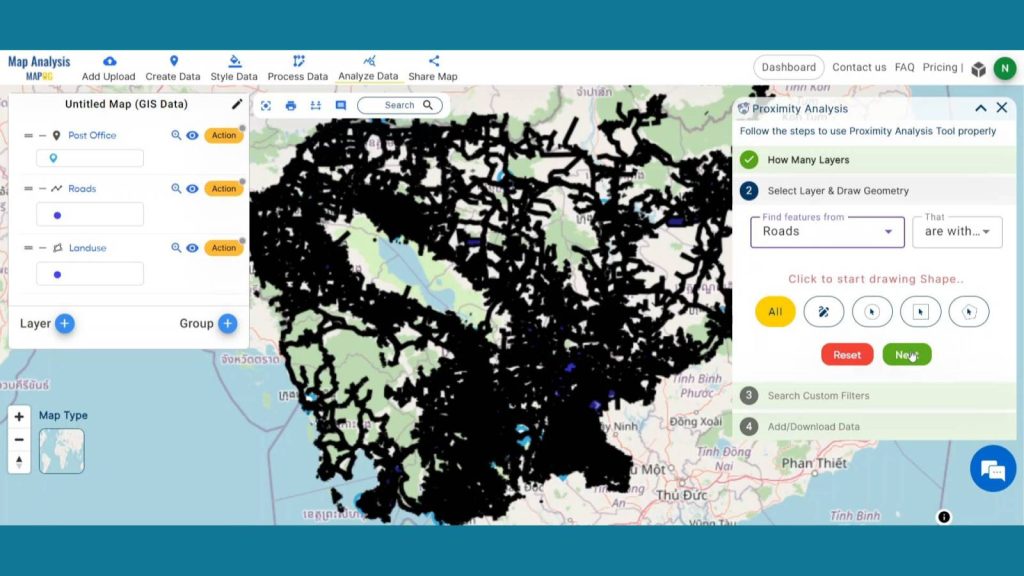
Now, let’s extract Trunk Roads from road Lines. To do that head to Analyze Data from header and click on One Layer option. Select the Road Lines data and click on next.
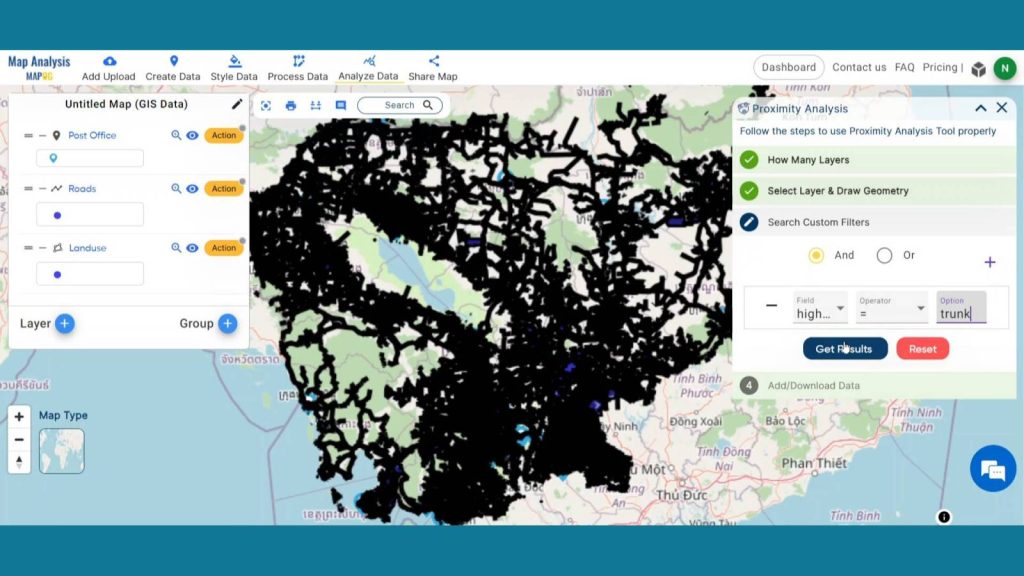
After that click on “And” option. Select the High Roads from fields and set the operator as “=” and type Trunk in option. Hit Get results and publish. Your data will be added in map canvas.
Now, Rename the new layer as trunk Road.
Step 4: Enhance Visualization
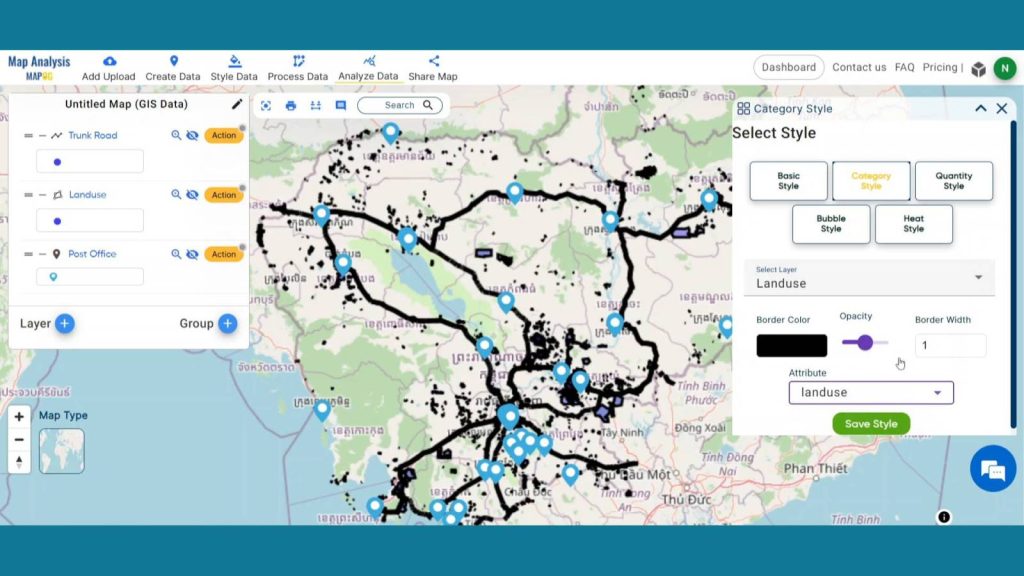
Now, let’s add thematic styling to enhance the visualization of those layers. To style the Land Use data go to the action button of that layer and select the Category style to visually interpret the data. In the attribute option select “Land use” and save the style.
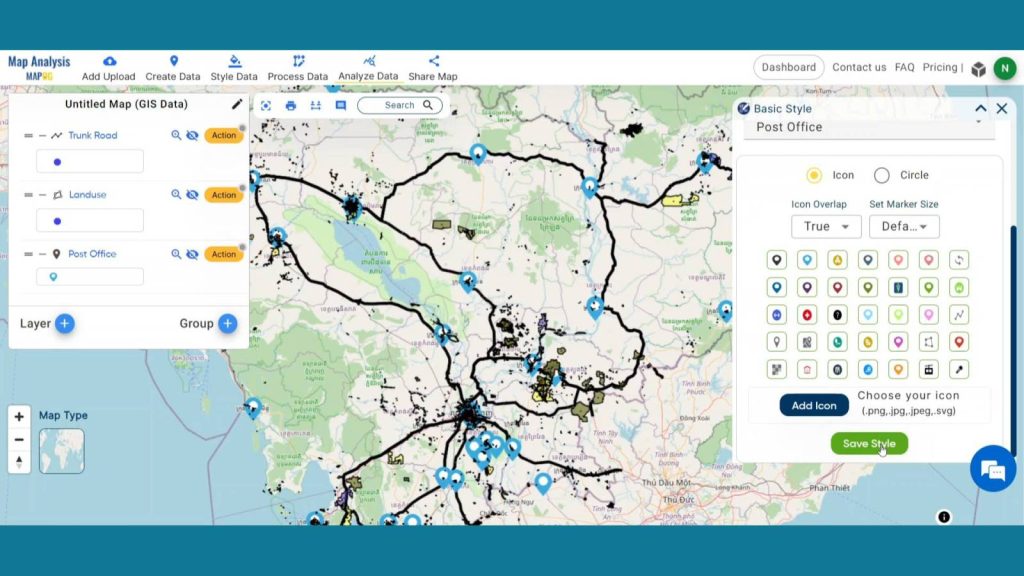
Select the Basic Style option from the action button of Post Office layer, in edit layer option, select size & icon and save style.
Step 5: Create Buffer Zone
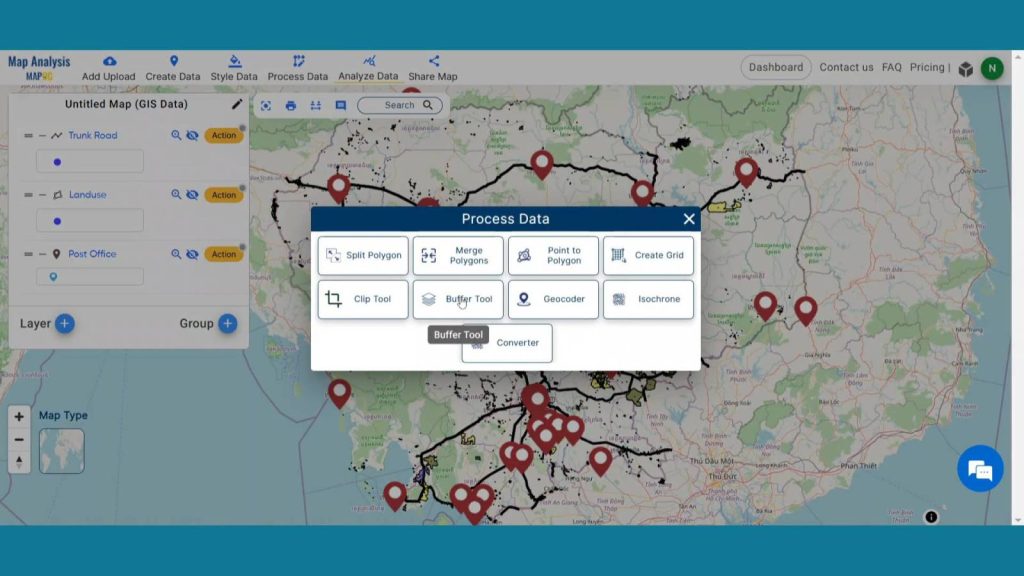
Now to prepare the buffer zone click on Process Data and click on Buffer Tool.
In the select layer option Select the Trunk Road layer and click on next. After that in the range option write 200 as we are creating a 200-meter buffer zone around the layer. Keep the Dissolve toggle on and hit the submit button. Rename the new buffer layer as “Road Buffer 200 meter”.
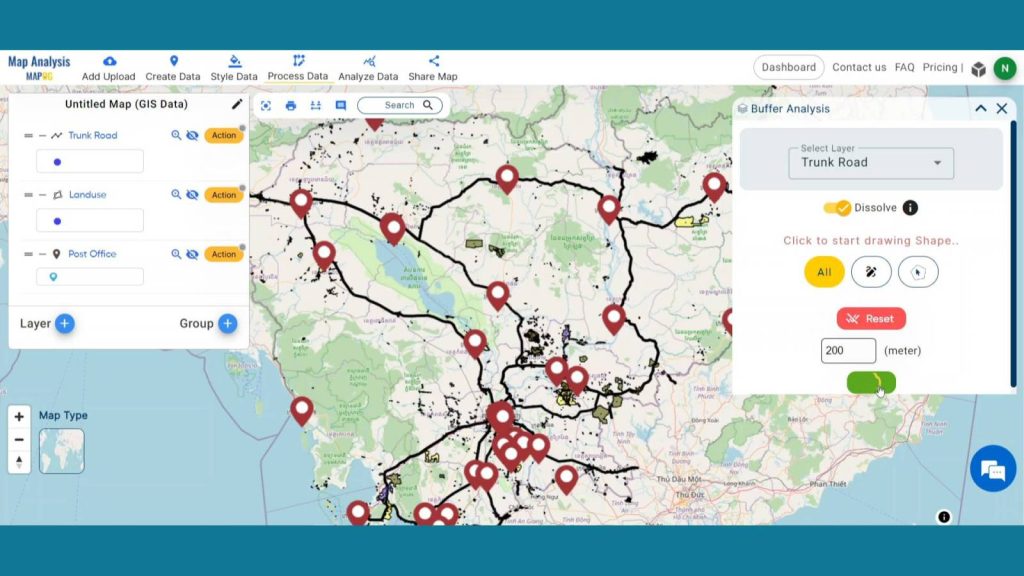
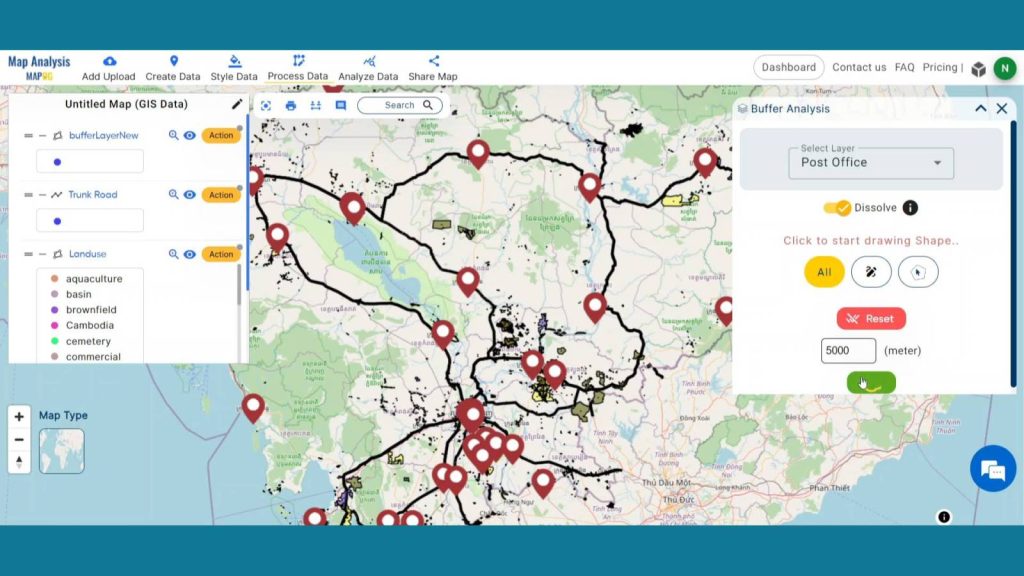
After creating the first buffer zone, create the next buffer zone. Select the Post Office Layer with a range of 5000 meters. Keep the Dissolve toggle on and click on submit button. Rename the new buffer layer as “Post Office Buffer 5 KM”.
Step 6: Add Thematic Style
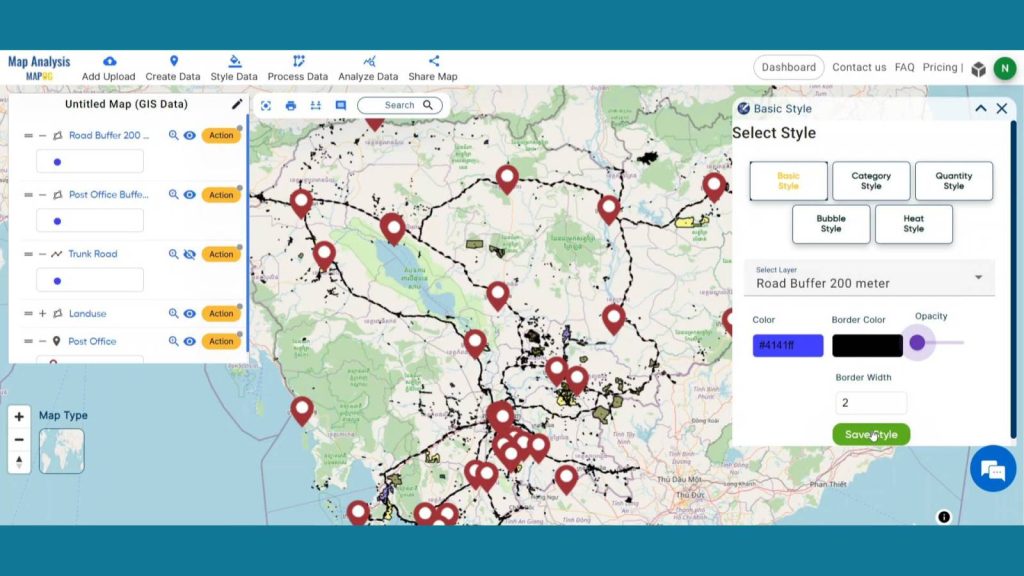
Enhance the visualization of buffer layers using style data option in the header. Select the Road Buffer 200-meter Post Office 5km Buffer from select layer drop down menu. Then come to the opacity section and set the opacity as zero and save style.
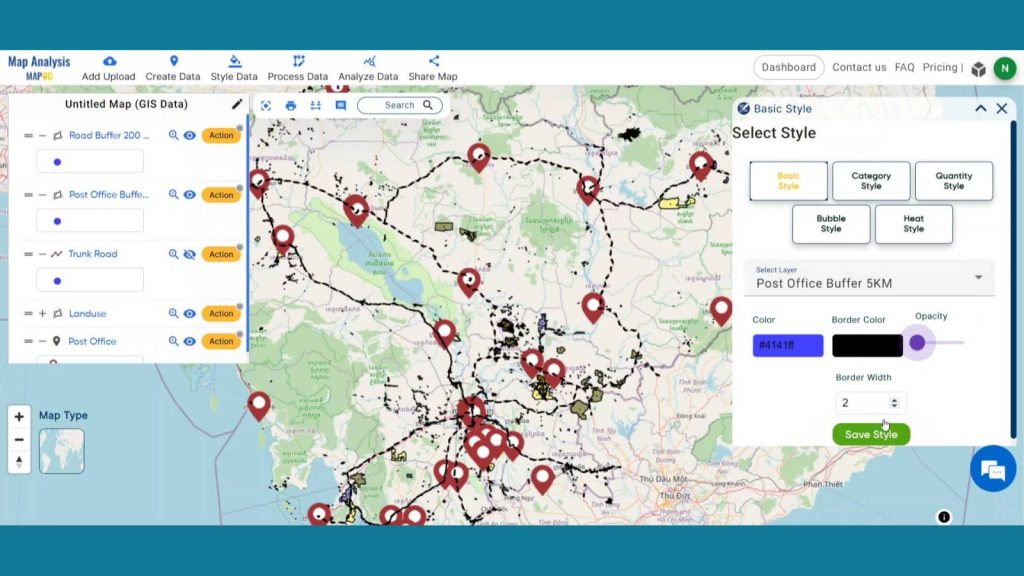
Like that change thematic styling for Post Office 5km Buffer. By setting the opacity as zero both layers will become transparent, and we will be able to see the land use layers underneath it.
Step 7: Create New Locations
Click on Create data and then click on Create Point Data to plot suitable post office locations.
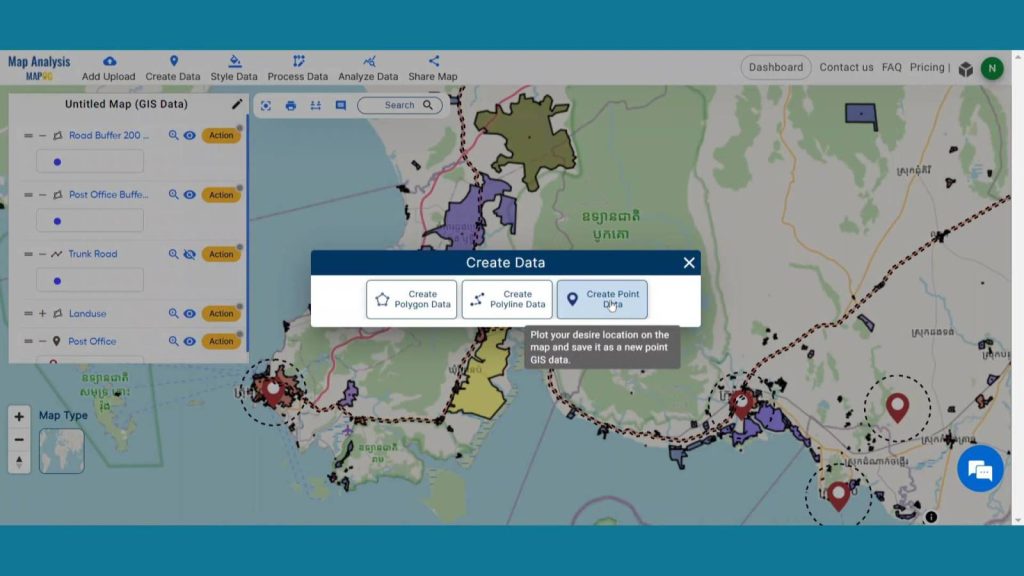
Change the layer name to proposed Post Office and click on save.
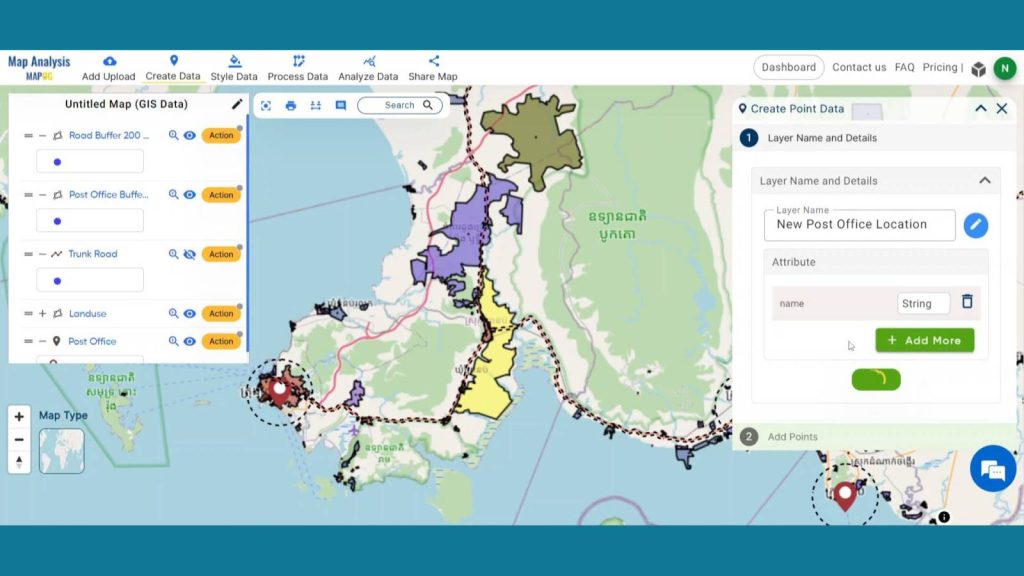
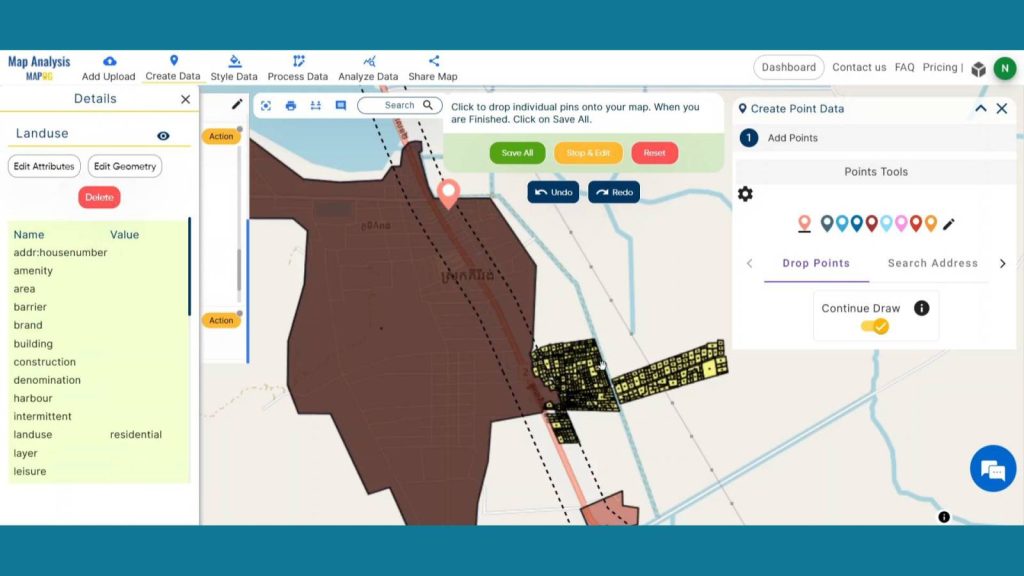
Now, in point tool option by clicking the pencil icon change the icon style and after that toggle on continue draw from Drop points. Now, navigate to the map canvas and look for acceptable large residential areas that are not inside the 5000-meter post office buffer zone but are still within the 200-meter road buffer zone. Locate locations such as that, then drop points there. Your proposed post office layer should be saved once you drop a few points and select Save All.
Step 8: Save Project
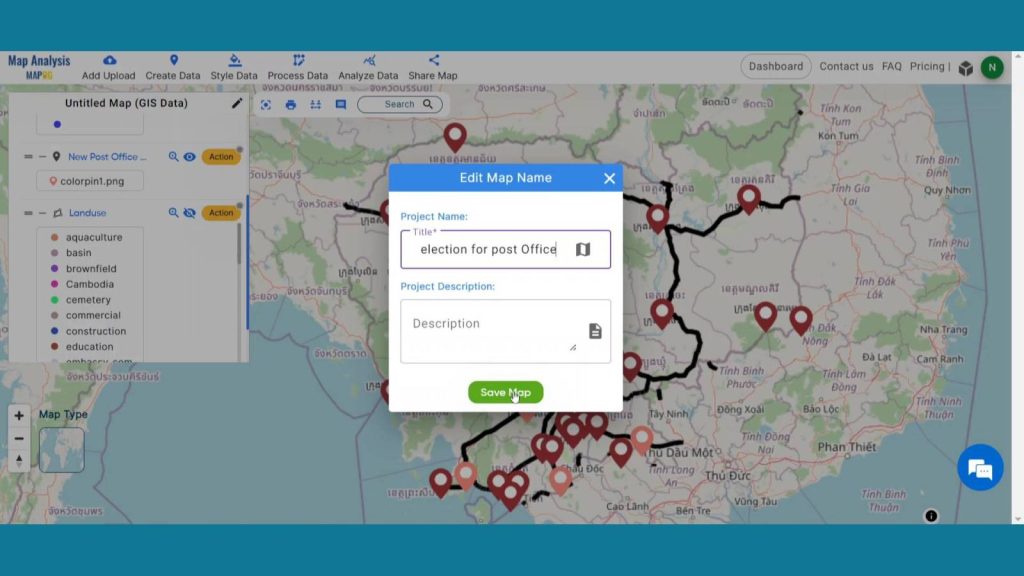
Now, click on the pencil icon situated right after the “Untitled Map” text to save the project. In the dialogue box write proper name and description that describe the project accurately. And click on save map option. Your project will be saved.
Step 9: Results & Analysis
With our map now enriched with details, let’s make those final adjustments. MAPOG considers accessibility, population density, and connectivity, ensuring strategic locations that enhance efficiency, convenience, and seamless postal services for all.
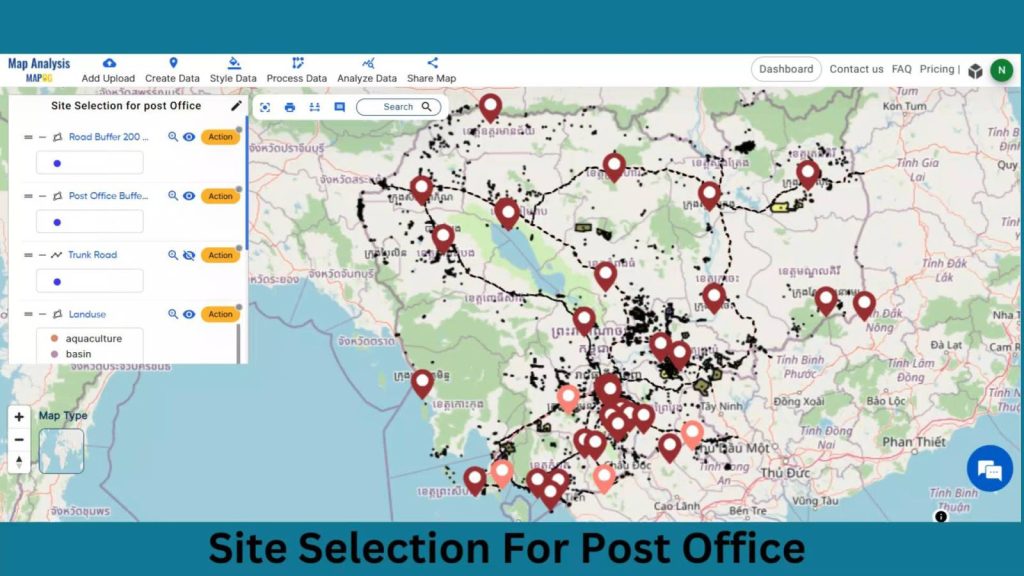
Major Findings
Demographic Hotspots: MAPOG identifies areas with high population density, allowing post offices to cater efficiently to communities, enhancing accessibility.
Optimal Traffic Connectivity: Analyzing traffic patterns, MAPOG helps choose locations with easy road access, streamlining mail delivery and customer visits.
Competitive Edge: MAPOG’s insights give post offices a competitive advantage by positioning them strategically, ensuring they outshine competitors and meet customer needs effectively.
Domain and Industry
This map is a powerful tool for E-commerce, Financial Services, Urban Planning, Government Services and beyond. Suitable Site Selection for Post Office, a valuable asset for Enhanced Accessibility, Operational Efficiency, Customer Satisfaction and beyond.
Explore the world of emergency response as the story progresses by reading “Fast Emergency Response: Using GIS and Isochrone Maps for 10-Minute Ambulance Arrival“
Conclusion
In conclusion, MAPOG transforms how post offices choose their homes, bringing them closer to communities. With data-driven precision, it ensures accessibility, convenience, and improved services. The days of long trips to mail a letter are over, thanks to MAPOG’s smart site selection – a win-win for post offices and their customers.
LINKS FOR THE DATA 👍
Here are some other blogs you might be interested in
- Protecting Wetlands: Guide to Create GIS Map for Nature
- Mapping Tiger Attack Hotspots – Create an Online Map and Share
- Make Routes for Military Aerial Planning- Through Bearing angle and Distance calculation – Online Route Compass
- Mapping Healthcare Efficiency: GIS Buffer Analysis of Hospital Locations
- Add WMS- Two step online view of WMS layer on a map
- Plot ATM locations on a map and embed on your website
- Map habitat locations of endangered animals & keep track of their living