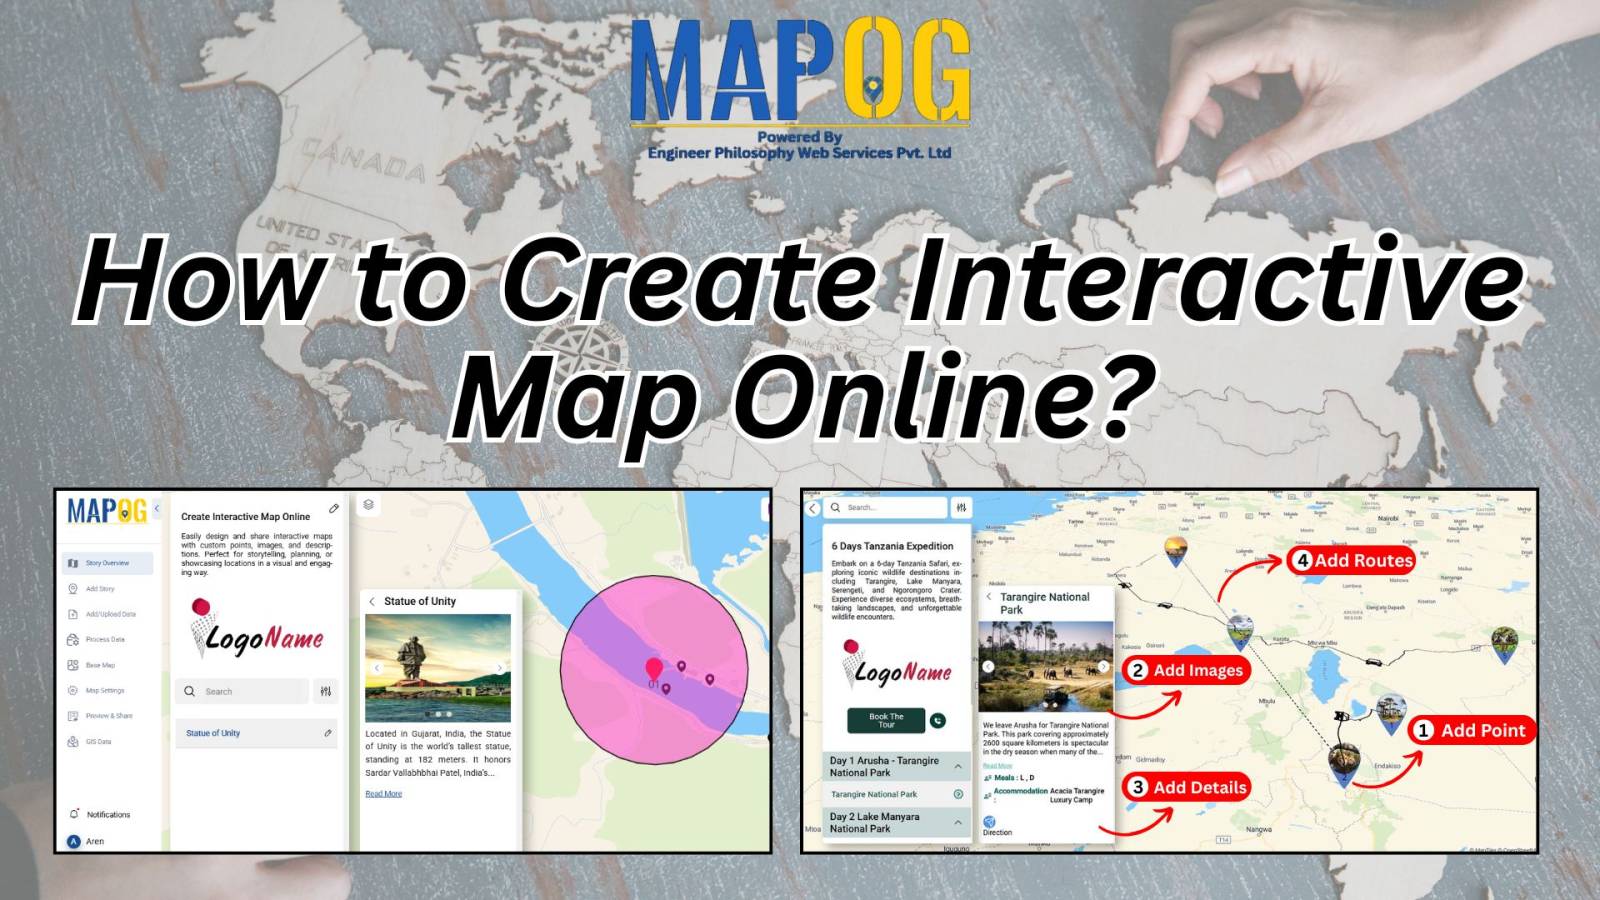
Virtual Tour Maps: Create Engaging, No-Code Experiences
In an increasingly digital-first world, how we explore, explain, and experience places is changing rapidly. Today, virtual tour maps are not just tools for navigation—they’re powerful platforms for creating engaging, interactive experiences. Whether you’re in Tourism, Real Estate, Education, Retail , or Culture , virtual tours built with interactive maps are transforming how audiences engage … Read more