#DataVisualization

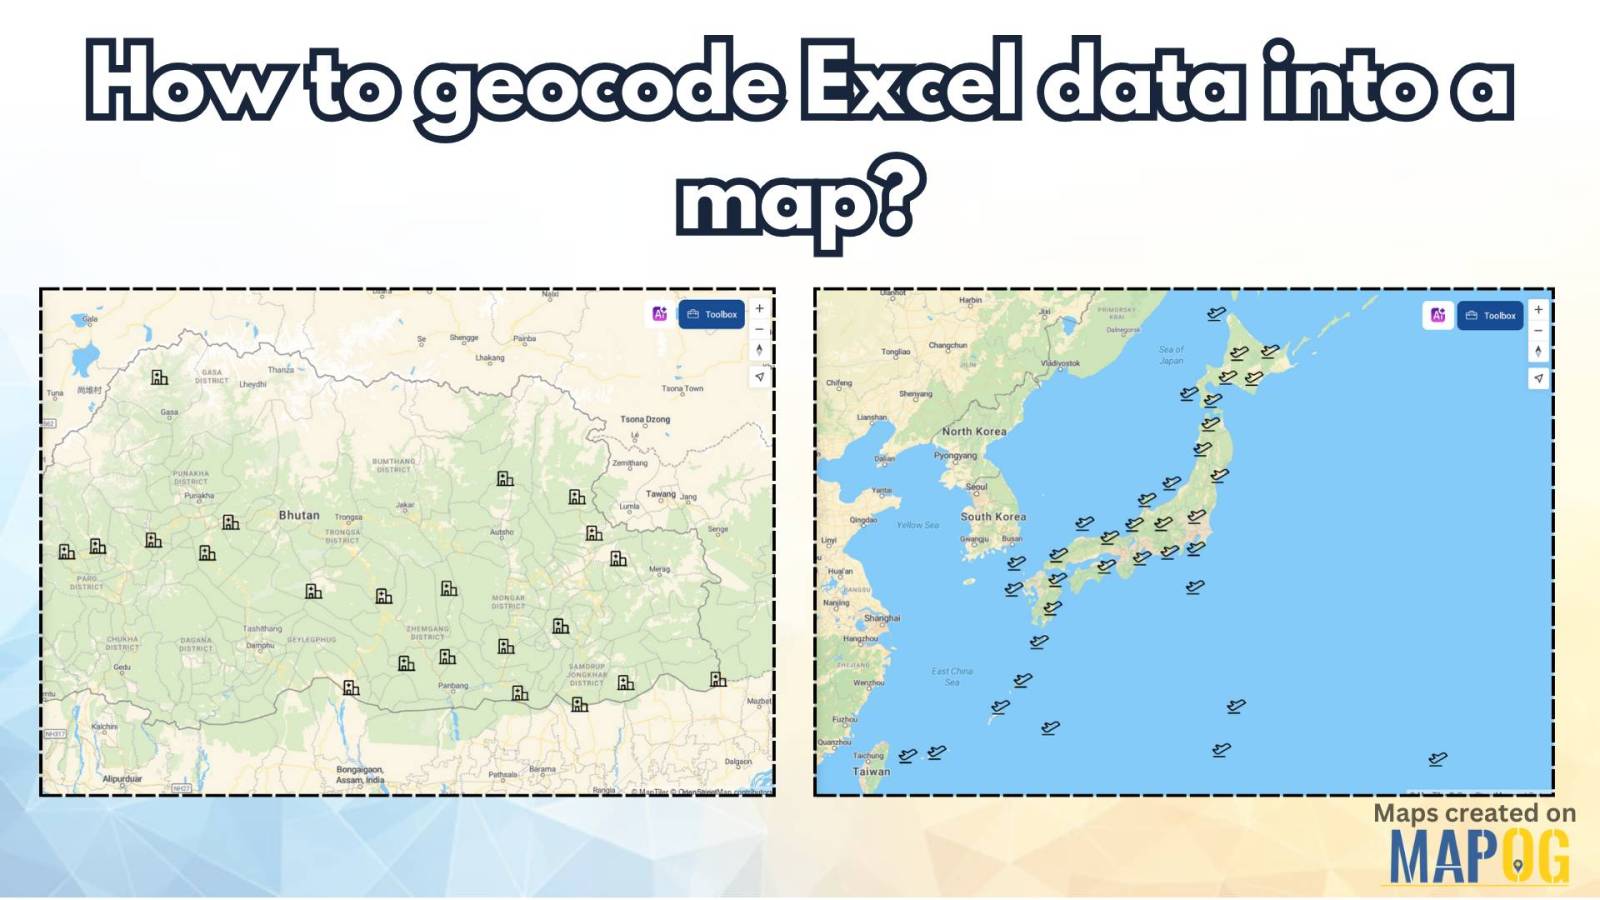
How to Geocode Excel Data and Create an Interactive Map (Step-by-Step Guide)

Have a spreadsheet full of addresses or coordinates and wondering how to plot them on a map? Geocoding Excel data into an interactive map can transform raw location information into valuable insights. Whether for business analysis, logistics, or research, mapping your Excel data helps visualize trends and make data-driven decisions. This guide will walk you … Read more

Best GIS Tools for Healthcare Analysis: Enhancing Accessibility & Resource Allocation

Healthcare is an industry in which the basis for many decisions could be driven by data. For instance, healthcare services can be effectively analyzed with spatial insight into resource allocation and disease distribution, which, in turn, determines the accessibility of care. Therefore, this article presents some of the best GIS tools available for healthcare professionals … Read more

Thematic Mapping for Data Analysis: Visualizing Trends with Bubble Maps

Thematic Mapping for Data Analysis is a powerful technique used to visualize complex datasets by representing geographic patterns through color-coded maps and scalable symbols. One of the most effective methods in thematic mapping is Bubble Thematic Mapping, where data points are displayed as bubbles of varying sizes, proportional to a specific attribute such as population … Read more

County-Wise Income Analysis: Thematic Mapping for Better Insights & Decision-Making

The difficulty of visualizing and analyzing earnings data is addressed in “Easy Income Analysis Using Thematic Maps for County-Wise Insights,” where we use quantity thematic styling to depict earnings across several geographic counties. Key Concepts Using quantity thematic design to visually display the income distribution across geographic blocks, the county-Wise Earnings Analysis in MAPOG offers … Read more

How to Use Isochrone Maps for Business Growth & Location Planning

In today’s fast-paced world, businesses need tools that help them make data-driven decisions. Isochrone maps, which visualize areas accessible within a certain time or distance, can be a game-changer. They provide insights into customer reach, delivery zones, and more. This article explores how isochrone maps can benefit your business and use MAPOG to create meaningful … Read more

A Beginner’s Guide to Mapping GIS Data Online

With the advancements in today’s digital world, GIS data is a necessary element for any professional or enthusiast in urban planning, environmental monitoring, or simply the creation of a visual story. The integration of GIS data with an online map is, thus, an indispensable skill. In the following pages, we shall describe how to incorporate … Read more

How to Create Energy Maps for Unpowered Settlements Step-by-Step Guide to Identifying Energy Gaps

How to Create Energy Maps for Unpowered Settlements: Step-by-Step Guide to Identifying Energy Gaps

In an era where energy plays a pivotal role in shaping the economic and social landscapes, equitable distribution of power is paramount. “Creating Energy Maps: Unpowered Settlements”, This article delves into the realm of MAPOG Map Analysis to identify potential energy deserts—areas where settlements lack the crucial infrastructure of energy power lines or towers. By … Read more