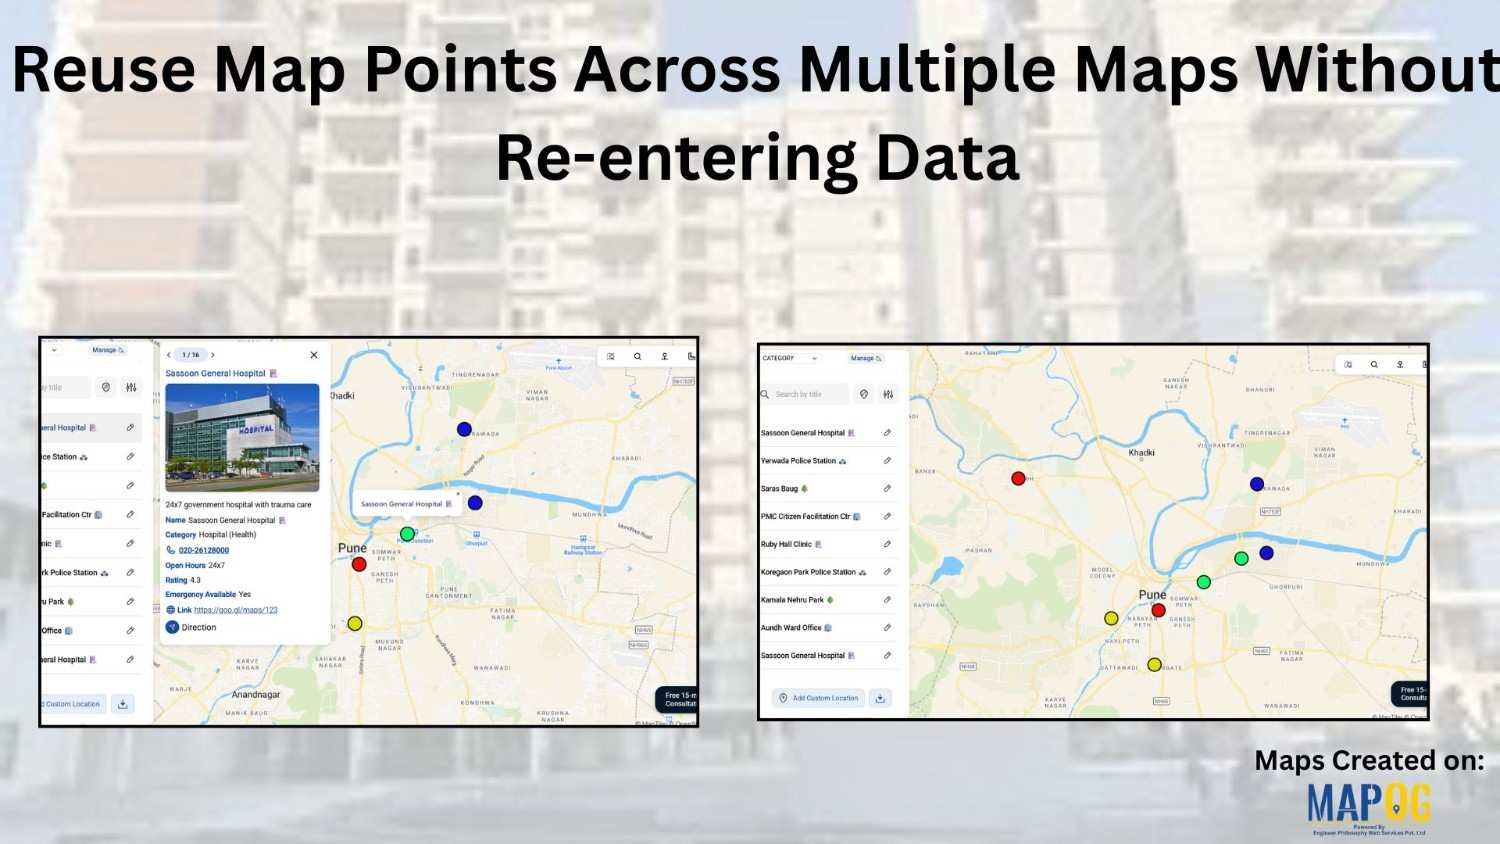
#GISMapping

How to Plot Borewell Data on a Map All at Once Without Manual Entry

In water resource projects, visualizing borewell data is crucial for informed decision-making. Manual plotting, however, is tedious and error-prone. The ability to plot borewell data on a map simultaneously, without manual entry, makes the process faster and more reliable. MAPOG simplifies this through features like “Add by uploading CSV/Excel” and integrated task management. This then … Read more

How to Filter Your Map Points Easily Using Category Filters

In a world where maps have become increasingly interactive and data-rich, organizing your map points is no longer just a “nice-to-have” feature — it’s essential. Whether you’re building a travel guide, a real estate visualization, or even a business dashboard, learning how to Filter Your Map Points easily using category filters can, therefore, make your … Read more

Control Who Can View or Edit Your Map (Public, Private, Team)

In a data-driven landscape, controlling access to your interactive maps is crucial for collaborative projects and client solutions. Unlike static images, interactive maps offer real-time information sharing. MAPOG  facilitates this by allowing users to view or edit your Map & provide permissions through its Preview & Share and add user features, ensuring secure and efficient … Read more

Track Task Progress on a Map

Track Task Progress on a Map Dashboard (Completed vs Pending)

Tracking everyday projects on spreadsheets often turns messy, especially when tasks spread across different teams and locations. Instead of flipping through endless reports, a smarter way is to track task progress visually on a map dashboard. This approach gives you an instant view of what’s done and what’s pending while also keeping everything more organized. … Read more

Measure Distance & Area on a Map (Free Online Tool)

Measure Distance & Area on a Map (Free Online Tool)

Measuring distance and area is a fundamental tool with a wide range of applications like calculating land parcels, determining the lengths of roads and rivers. Leveraging MAPOG one can measure distance and area enabling to analyze and manage geospatial data for more informed and efficient decision making. Key concept and importance The key concept of … Read more

Share an Interactive Map with Teammates (View or Edit Access)

Best Way to Share Interactive Maps Online with View and Edit Access

Today, readers and team members expect more than just static information when exploring content or managing data online. Whether it’s tracking locations, updating details, or monitoring progress, interactive maps make collaboration simple and engaging. With MAPOG, you can easily share an Interactive Map with teammates, assigning view or edit access to ensure the right people … Read more

How to Map Drainage Points & Stormwater Drains for Smarter Urban Maintenance

How to Map Drainage Points & Stormwater Drains for Smarter Urban Maintenance

To Map Drainage Points effectively is one of the most critical parts of urban infrastructure, since clogged or damaged drains often remain unnoticed until monsoons cause flooding. For example, during heavy rains, municipal teams in many cities spend hours locating hidden or encroached drains before cleaning begins—by then, water logging has already disrupted traffic and … Read more

Edit and Update Point Information After Uploading Data

Edit and Update Map Data for Fire Safety and Infrastructure Projects

When managing urban infrastructure projects, uploading data to a map is only the beginning. The real value emerges when teams can edit and update point information after uploading data seamlessly. For example, a fire safety company that installs alarms every month needs to keep its records accurate and current. While uploading installation data offers an … Read more

Draw & Style Property Boundary Polygons on a Map

Draw & Style Property Boundary Polygons on a Map

With the help of GIS, professionals Draw and Style Property Boundary Maps to visualise, manage, and analyze land ownership clearly and efficiently. Whether you are a city planner, a surveyor, a real estate professional, or simply someone trying to understand land parcels in your community, drawing and styling property boundary mapping with GIS includes polygons … Read more

Embed a Live Interactive Map on Your Website or WordPress

Embed a Live Interactive Map on Your Website or WordPress

Today, readers expect more than plain text when exploring content online. To begin with, a simple list of destinations, business locations, or data points often fails to hold attention. This is why the ability to embed a live interactive map makes a difference. Instead of static descriptions, maps let audiences explore places visually, click on … Read more