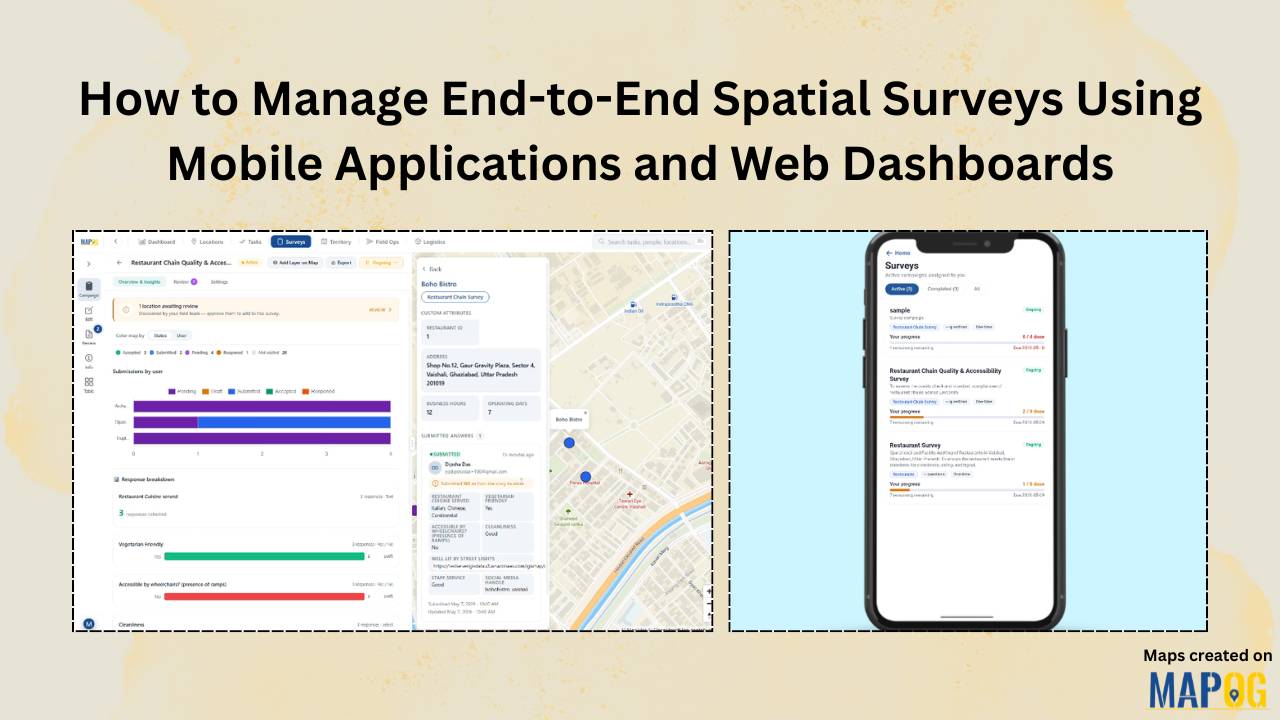
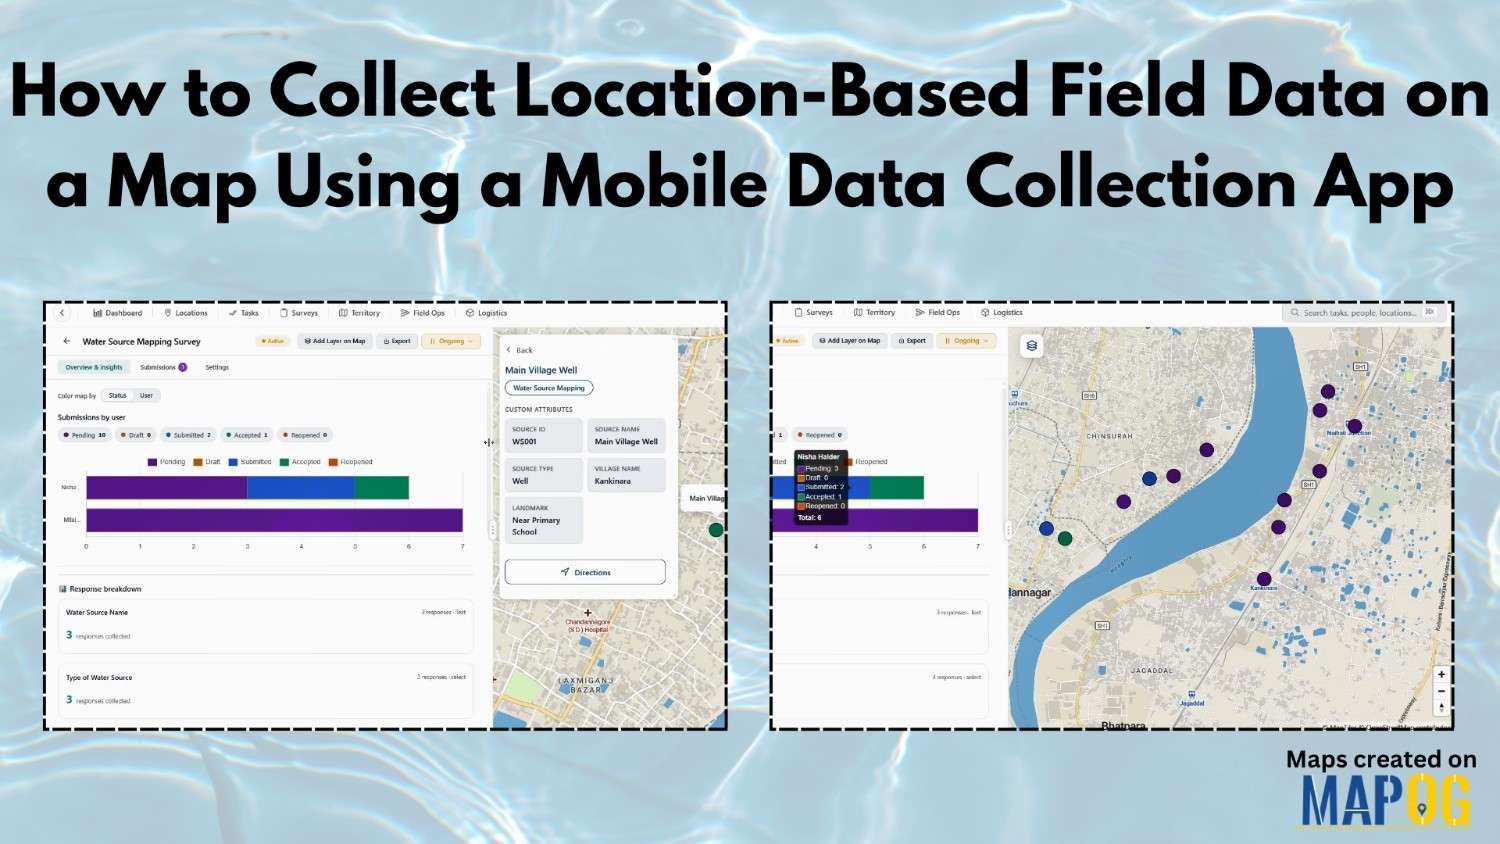
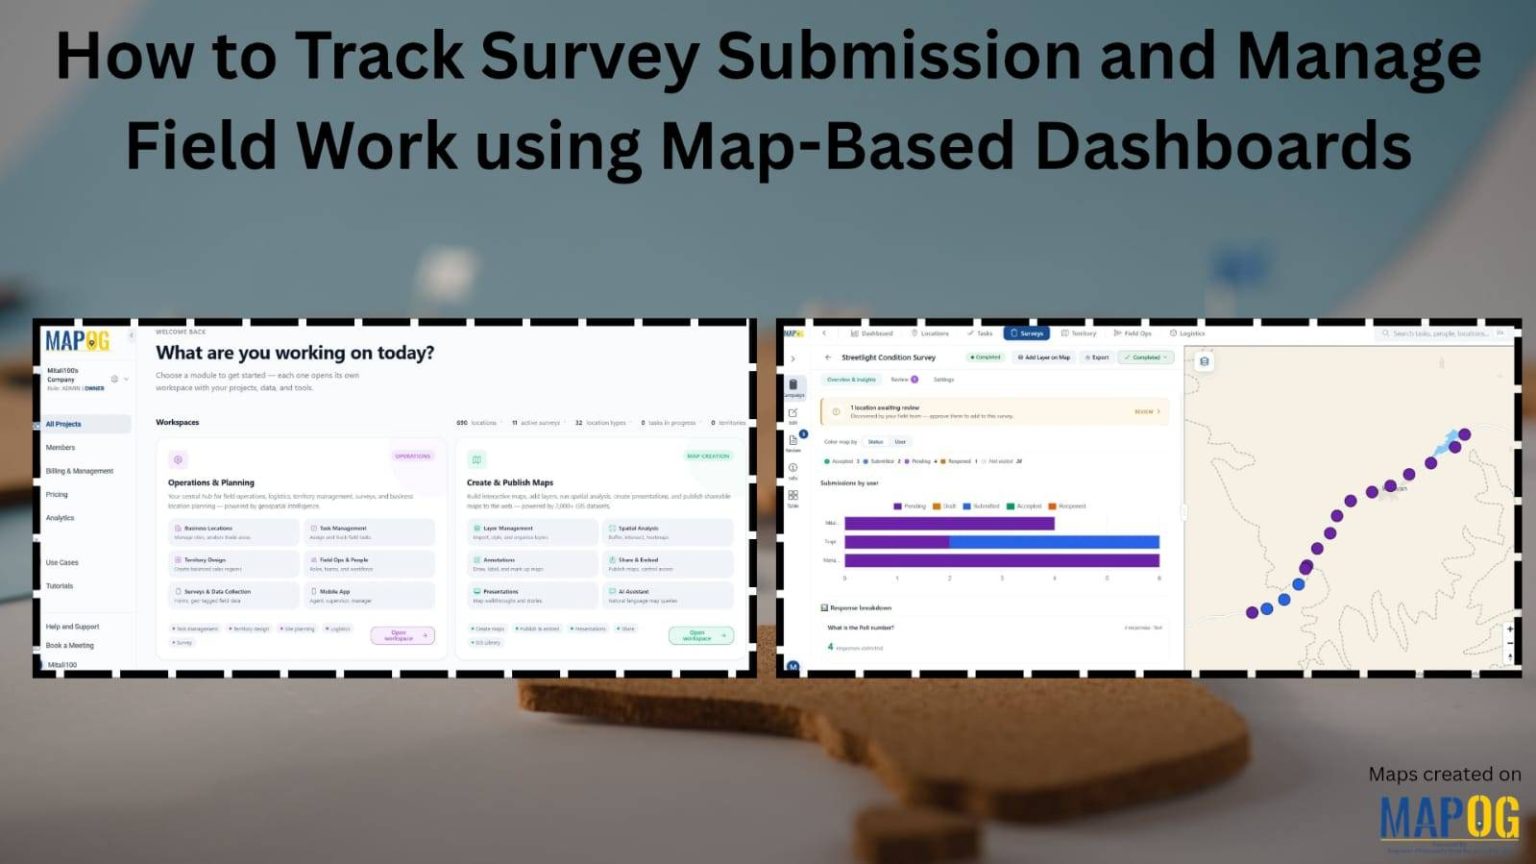
MAPOG

How to Draw 3D Buildings

How to Draw 3D Buildings on a Live or Dynamic Map

In the world of digital mapping, the concept of 3D mapping has changed how we visualize spaces. MAPOG is a mapping tool which allows users to draw realistic 3D buildings with ease, specifically for urban planning, real estate visualization, or educational use. Key Concepts of 3D Buildings You Should Know Drawing 3D buildings on a … Read more

How to Map Your Customers Using Interactive Layers

Map Your Customers with Interactive Layers: Visualize Buying Patterns, Performance & Growth in Minutes

Map your customers with interactive layers turns plain data into clear business insights. In fact, this approach visualizes buying patterns, engagement, and regional performance. Moreover, it helps identify loyal customers, new prospects, and high-value areas instantly. Key Concept: Map Your Customers Interactive customer mapping merges sales, location, and engagement data into one dynamic platform using … Read more

3 Easy Ways to Add Story Points and Narratives to Your Map

Adding story points and narratives to your map transforms it from a simple visual into an interactive story. Rather than displaying locations, you connect each point with details like descriptions, photos, etc. MAPOG, provides 3 easy ways to add story points making it easy and flexible; you can do it by uploading Excel or CSV … Read more

How to Create a Shareable Map Portfolio from Excel/CSV Data

Create a shareable map portfolio from Excel/CSV data to bring your projects to life in a visually compelling way. Although spreadsheets are excellent for storing detailed information, they often fall short in conveying the scale, diversity, and geographic reach of your work. While using MAPOG, you can transform that same data into an interactive map … Read more

Creating 3D Building Maps

Creating 3D Building Maps for Your Real Estate Project

In the real estate industry, clients often struggle to understand brochures or flat layouts because they don’t provide enough clarity about building height, structure, or availability. 3D Building Maps can enhance communication by providing realistic height visualizations, property details, floor plans, and furnishing status for buildings. MAPOG make this process more intuitive through features such … Read more

final visuals of GeoJSON data on an interactive map

How To Visualize GeoJSON Data On Interactive Maps

Trying to visualize GeoJSON data can be challenging when moving from raw spatial data to an interactive map. Although GeoJSON is widely used to store geographic features and attributes, it lacks built-in styling and interactivity. This makes raw files difficult to interpret, especially for non-technical audiences. Moreover, converting GeoJSON into a usable map often requires … Read more

Cover image showing how to create 3D building maps online without coding.

How to Create 3D Building Maps Online Without Coding

To create 3D building maps online without coding once felt out of reach, especially for field teams or planners without access to costly software. Yet in disaster-prone or rapidly changing areas, visualizing buildings in 3D is often essential. It helps people assess risk, communicate clearly, and act faster. That’s where MAPOG comes in: a GIS … Read more

Download Your Mapped Data in Different Formats

Download Your Mapped Data in Different Formats

Interactive maps do more than just visualize locations—they also store valuable data that can be exported, shared, and analyzed across multiple platforms. For instance, whether you’re tracking coffee shops, field points, real estate listings, or even survey data. MAPOG lets you download your mapped data layers in formats like CSV, XLS, JPG, KML, or SHP. … Read more

Why Every Business Needs a Visual Map, Not Just a Dashboard

Why Every Business Needs a Visual Map, Not Just a Dashboard

Dashboards summarize numbers, but visual maps reveal where and why things happen. Business Needs a Visual Map for example, a coffee chain can use MAPOG to see café locations, spot top performers, and analyze competitor proximity in one interactive platform. Moreover, visual maps also help real estate, logistics, healthcare, and many other industries turn complex … Read more

5 Inspiring Examples of Interactive Dynamic Maps You Can Create Online

Interactive and dynamic maps not only transform data into actionable visuals but also let users explore, interpret, and share insights. With MAPOG, you can not only map portfolios, campuses, routes, or stores but also organize, analyze, and visualize trends; moreover, this enables clearer, faster, and connected decisions. Key Concept: Why Create Interactive Dynamic Maps? Interactive … Read more