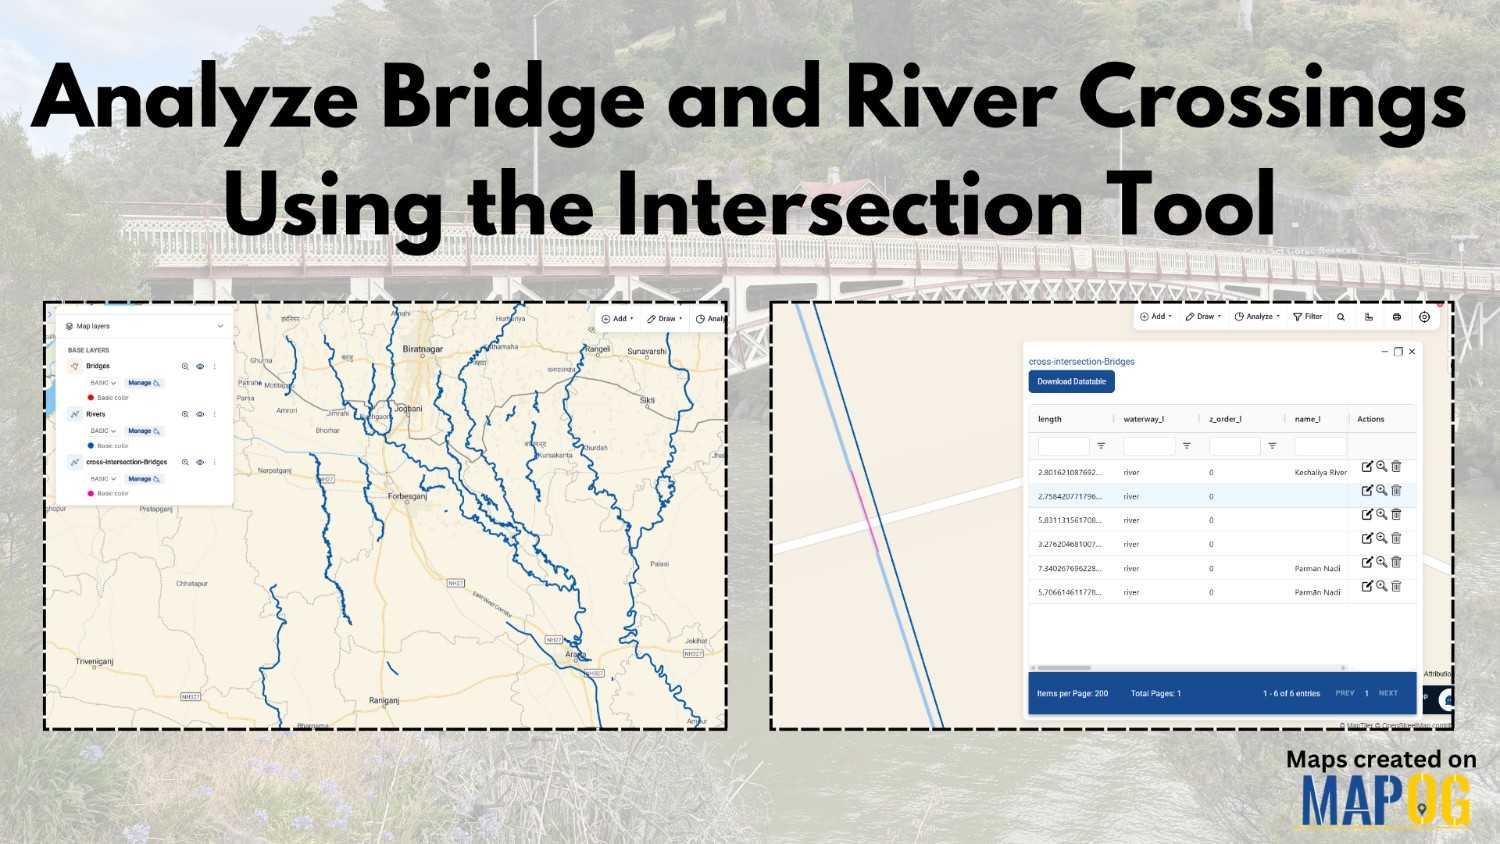
Creating Connectivity: A Spatial Analysis of Urban Accessibility
Creating Connectivity: A Spatial Analysis of Urban Accessibility links bus stops and healthcare, revealing areas and strategic real estate opportunities within 20 minutes.
Welcome to MAPOG, where we address flood risks with innovative solutions along the Rivers. This example demonstrates how MAPOG‘s tools can map and analyze flood risks, providing valuable insights for strategic planning. Join us as we navigate through this use case, showcasing MAPOG‘s capabilities in mapping and addressing flood risks. Key Concept Within this key … Read more
MAPOG‘S Navigating Mining Area Safety with Route Compass utilizes virtual reality technology to ensure site safety in traditional mining operations areas. This innovative technology creates an artificial environment, safeguarding people and equipment, and facilitating regulation observance. Immerse yourself in the dynamic landscapes of urban planning through “GIS Analysis in Urban Planning: Reshaping Transportation Future Insights … Read more
Creating Maps: River-Dam Relationships MAPOG geospatial analysis, aiding hydroelectric power, agriculture, and urban planning.
Create Map for Smart Farming. MAPOG’s innovative map creation process integrates agriculture and river data, offering actionable insights for smart farming.
MAPOG’s population density map illuminates spatial patterns, guiding urban planning, healthcare, and policy decisions.
“Creating Cross-Country Routes by Distance and Bearing Angle” by MAPOG’s Route Compass simplifies cross-country route planning.
Mapping COVID-19 Impact: This analysis identifies hotspots, low case areas, and trends over time, aiding in effective resource allocation and policy-making.
Learn how to map provincial boundaries using MAPOG. Understand border intersections for urban planning, environmental management, and political geography.
Carbon Stock Mapping – Incorporate bubble style for visualize the data – Add labels showing the values of carbon stock