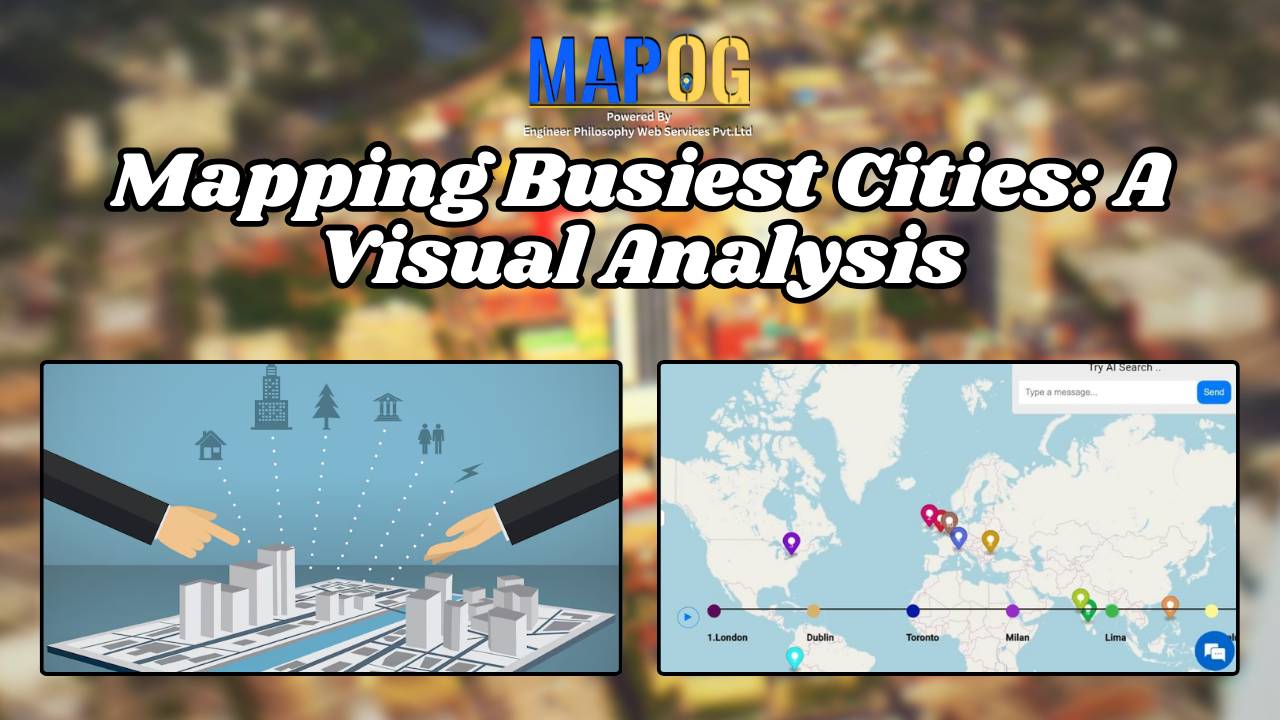
Mapping Busiest Cities: A Visual Analysis
This analysis yields insights into urban trends, spatial patterns, infrastructure needs, land use planning, equity, sustainability, and resource allocation.
This analysis yields insights into urban trends, spatial patterns, infrastructure needs, land use planning, equity, sustainability, and resource allocation.
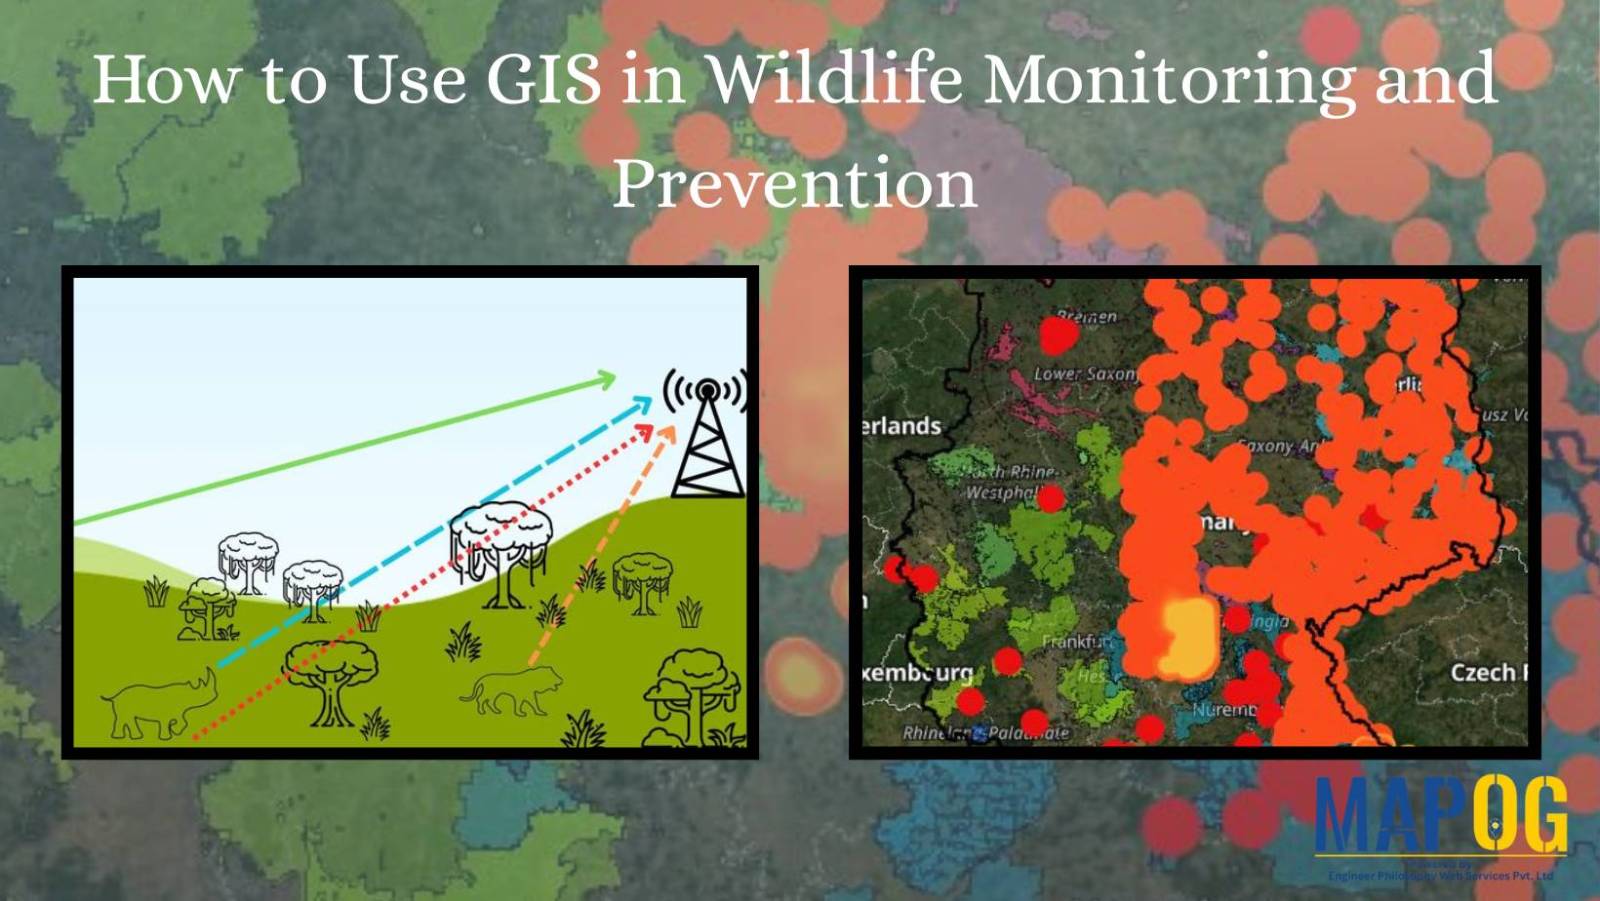
As biodiversity faces unprecedented loss, conservationists are using advanced mapping technology to fight back. Geographic Information Systems (GIS) have evolved into powerful tools for wildlife monitoring and protection, enabling teams to plan migration corridors, predict poaching hotspots. This technology is empowering rangers and researchers to make faster, smarter decisions, helping reverse biodiversity loss. Key Concept … Read more
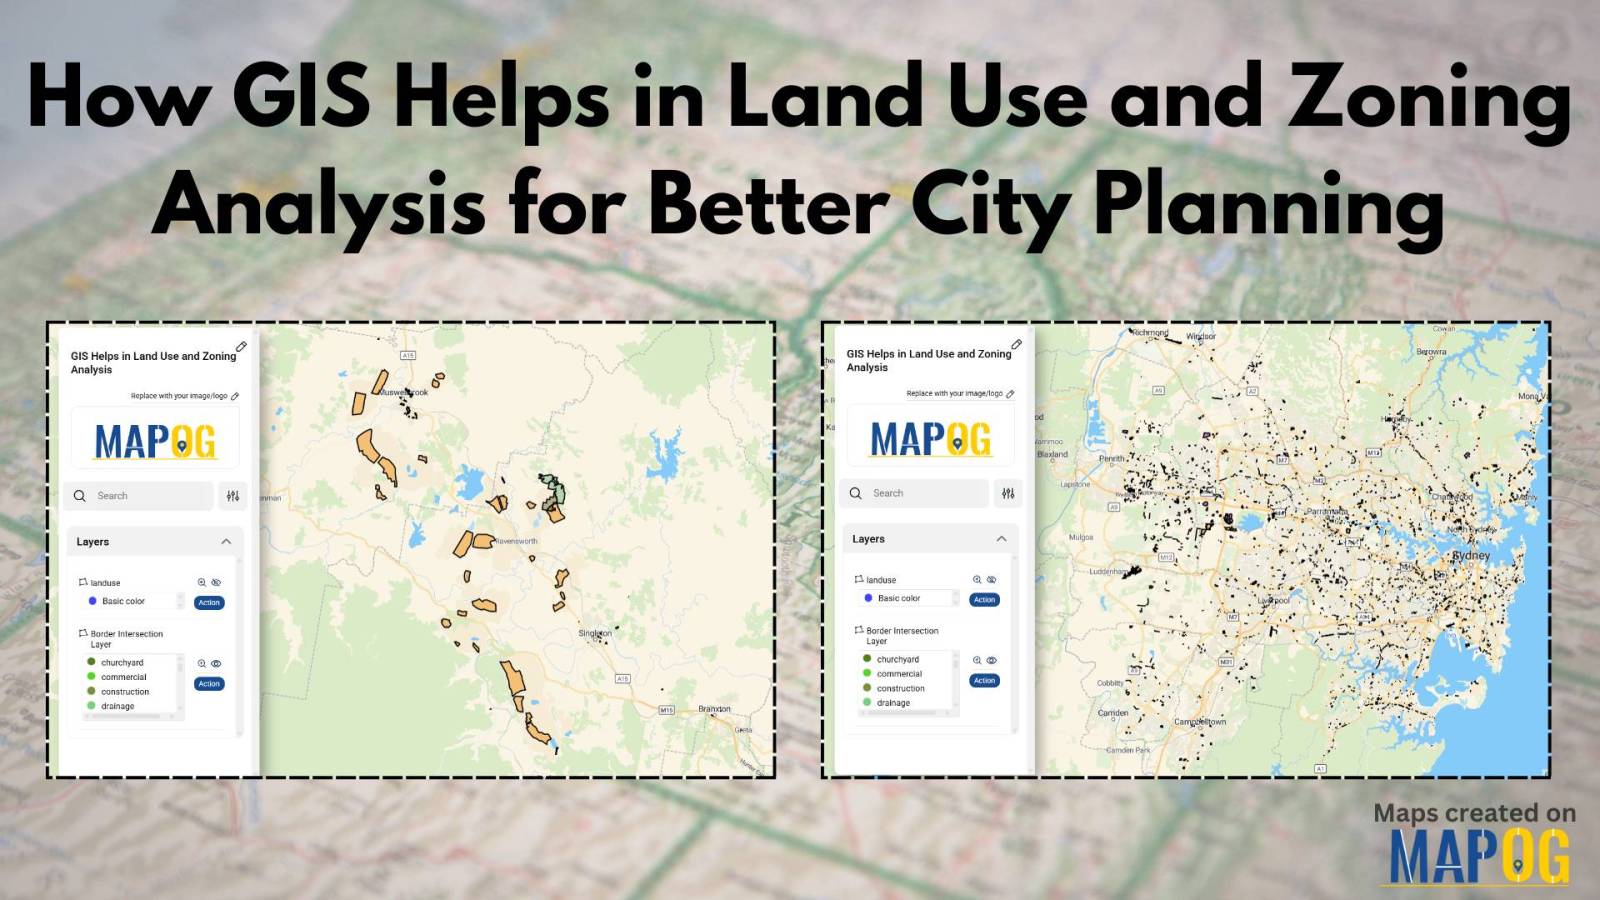
In today’s fast-changing urban landscape, GIS in land use and zoning analysis for better city planning plays a vital role in shaping smarter, more livable cities. Whether it’s managing population growth, conserving green spaces, or optimizing infrastructure, city planners increasingly depend on GIS to make informed decisions. This article explores how GIS tools enhance zoning … Read more
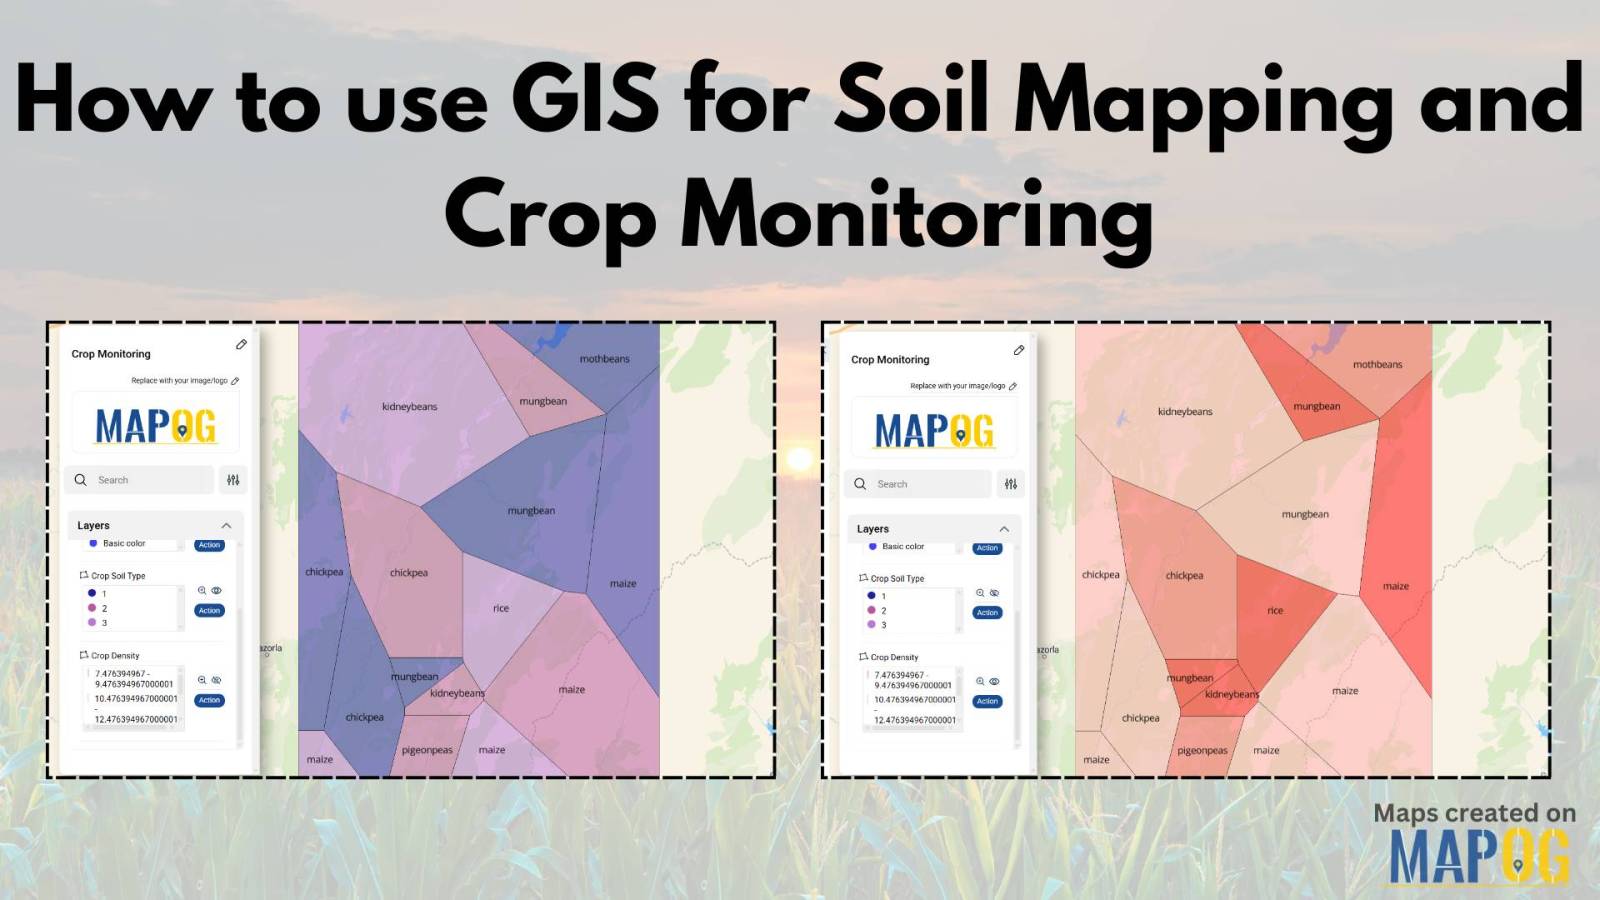
GIS is crucial in agriculture for soil mapping and crop monitoring, enabling informed decisions to improve yield, optimize land use, and ensure sustainable farming. It helps identify soil types, track crop density, and enhance precision farming by processing and visualizing soil and crop data. Key Concepts in GIS for Soil Mapping and Crop Monitoring GIS … Read more
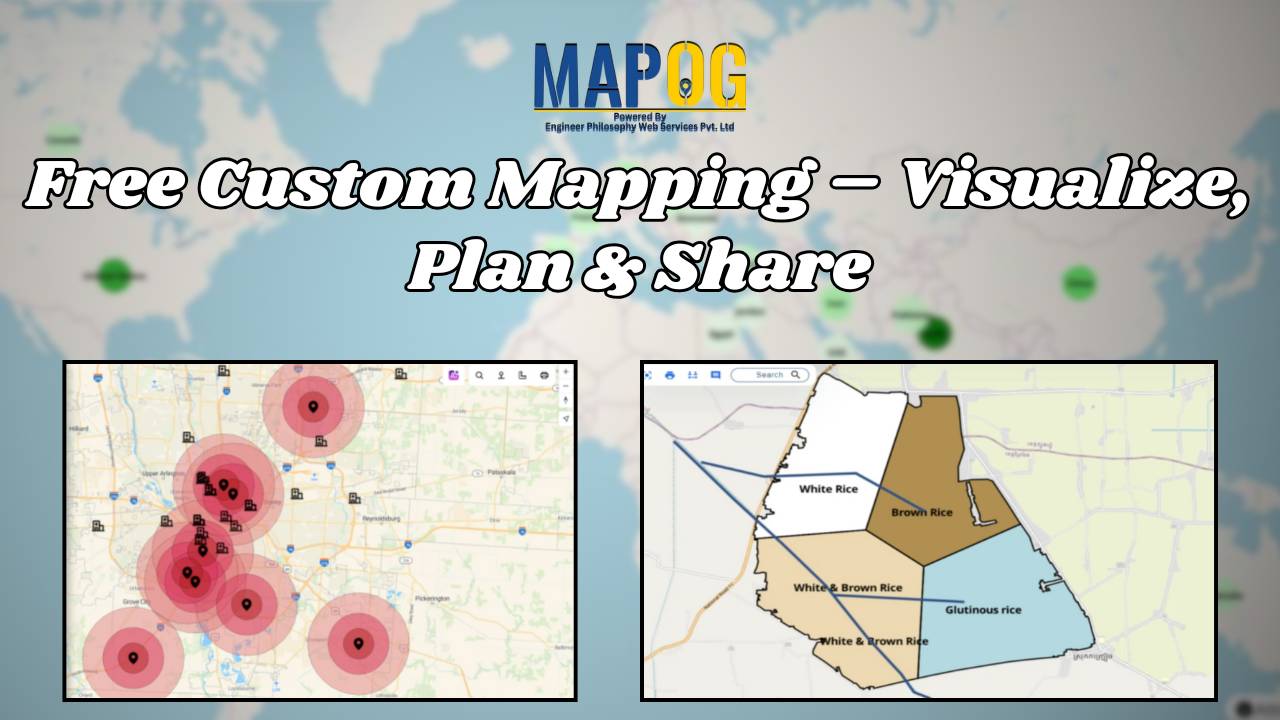
Mapping is a powerful tool that helps individuals and businesses visualize data, plan strategies, and share insights. With free custom mapping solutions like MAPOG, you can create interactive and free custom maps that bring data to life. MAPOG allows users to integrate GIS data seamlessly, customise maps, and share them effortlessly. Whether for Travel Planning, … Read more
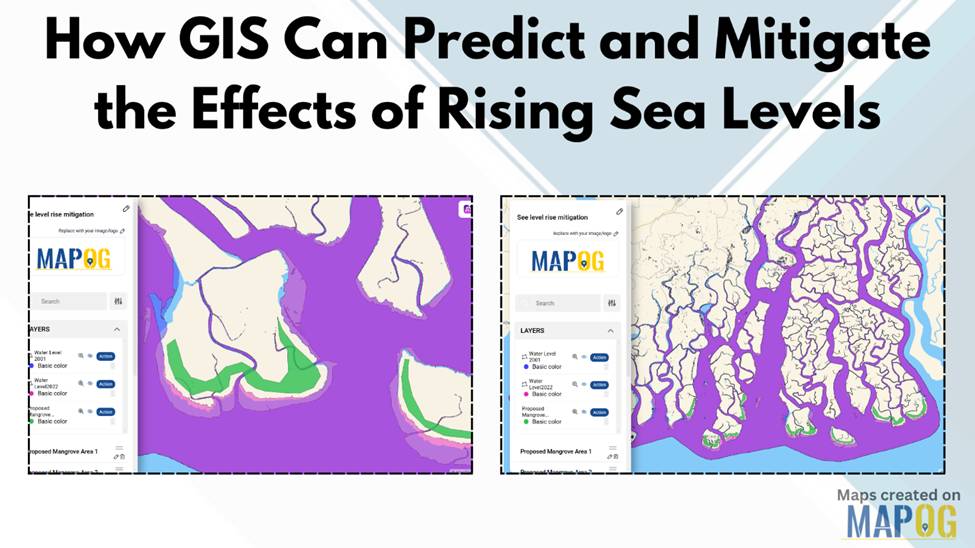
Rising sea levels pose a significant threat to coastal communities, ecosystems, and infrastructure. Geographic Information Systems (GIS) offer a powerful way to predict and mitigate the effects of rising sea levels by analyzing past water level data, modeling future changes, and planning mitigation strategies. By leveraging GIS technology, decision-makers can visualize vulnerable areas and implement … Read more
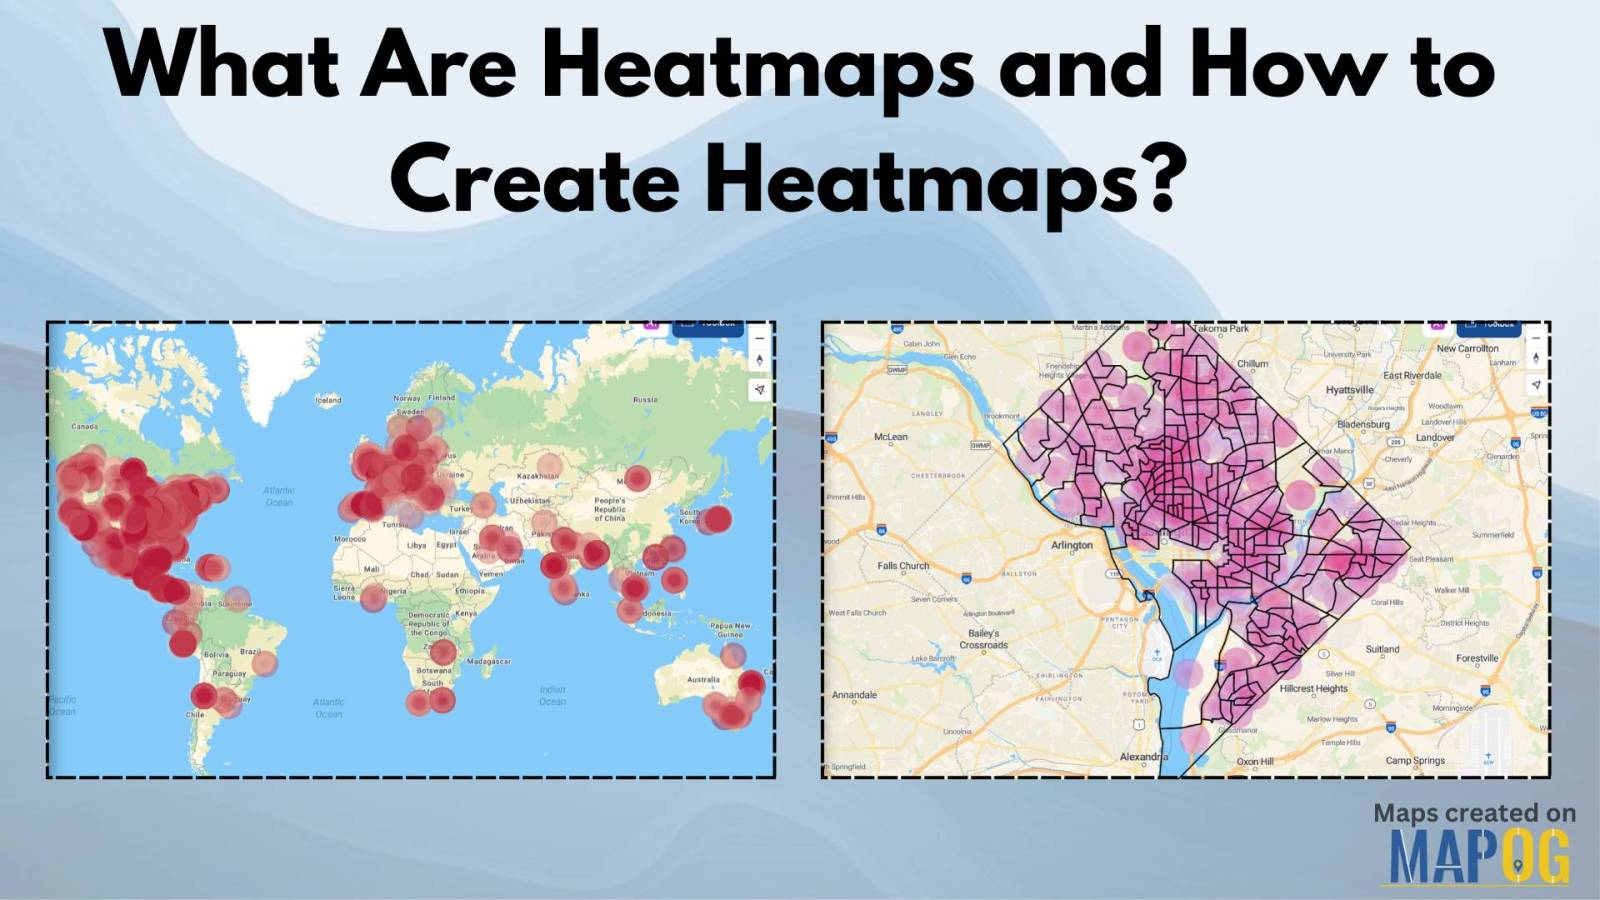
Ever wondered how to visualize data patterns effectively? Heatmaps are an excellent way to analyze trends, highlight intensities, and make data-driven decisions. Whether for website analytics, business insights, or geographic trends, heatmaps simplify complex datasets into easy-to-understand visuals. The best part? You can create heatmaps for free using tools like MAPOG’s Heat Map Style. Let’s … Read more
In today’s data-driven world, maps are no longer just tools for navigation, they are powerful instruments for analysing patterns, making informed decisions, and solving complex problems. Whether Tracking Population and Literacy Data Attribute , Thematic Mapping for Data Analysis or a researcher visualising data, MAPOG is your go-to platform for creating professional, insightful maps. In … Read more
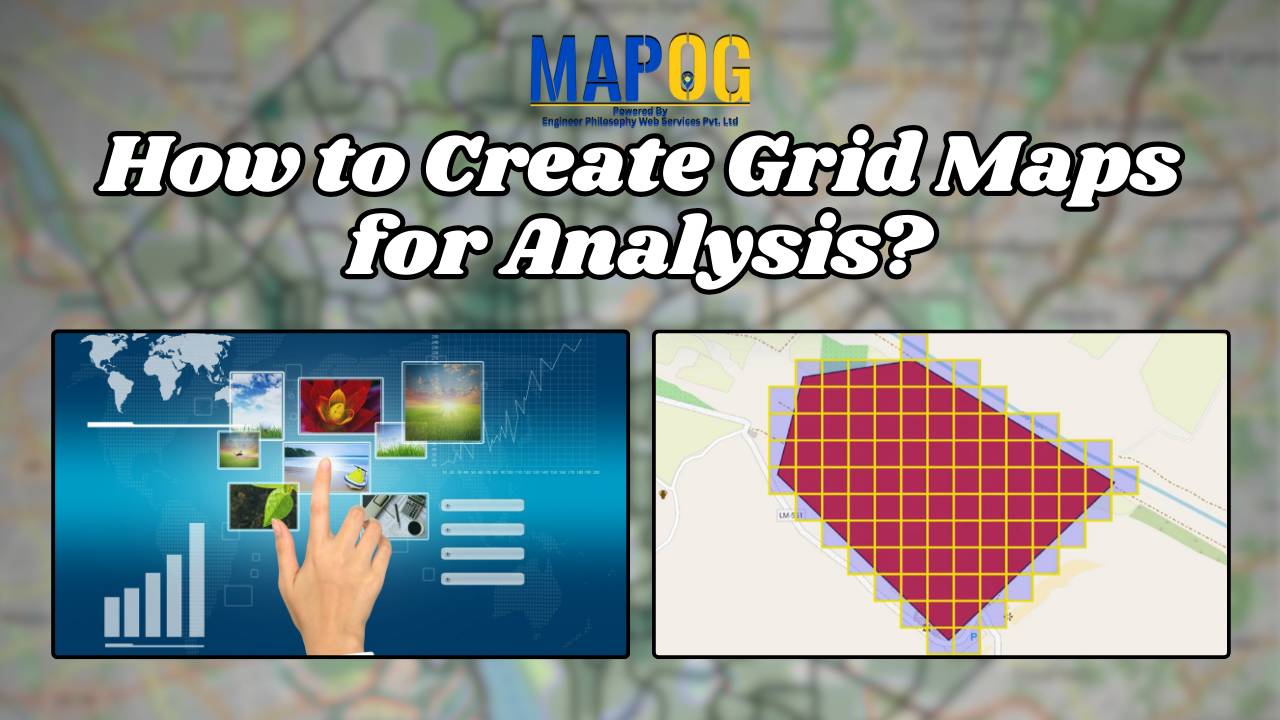
Grid maps are essential for analysing spatial data, helping to break down complex information into smaller, manageable sections. Whether you’re working in urban planning, environmental studies, or business analytics, a well-structured grid map enhances data visualisation and decision-making. In this guide, we’ll explore how to create grid maps effectively and introduce MAPOG’s Create Grid Tool, … Read more
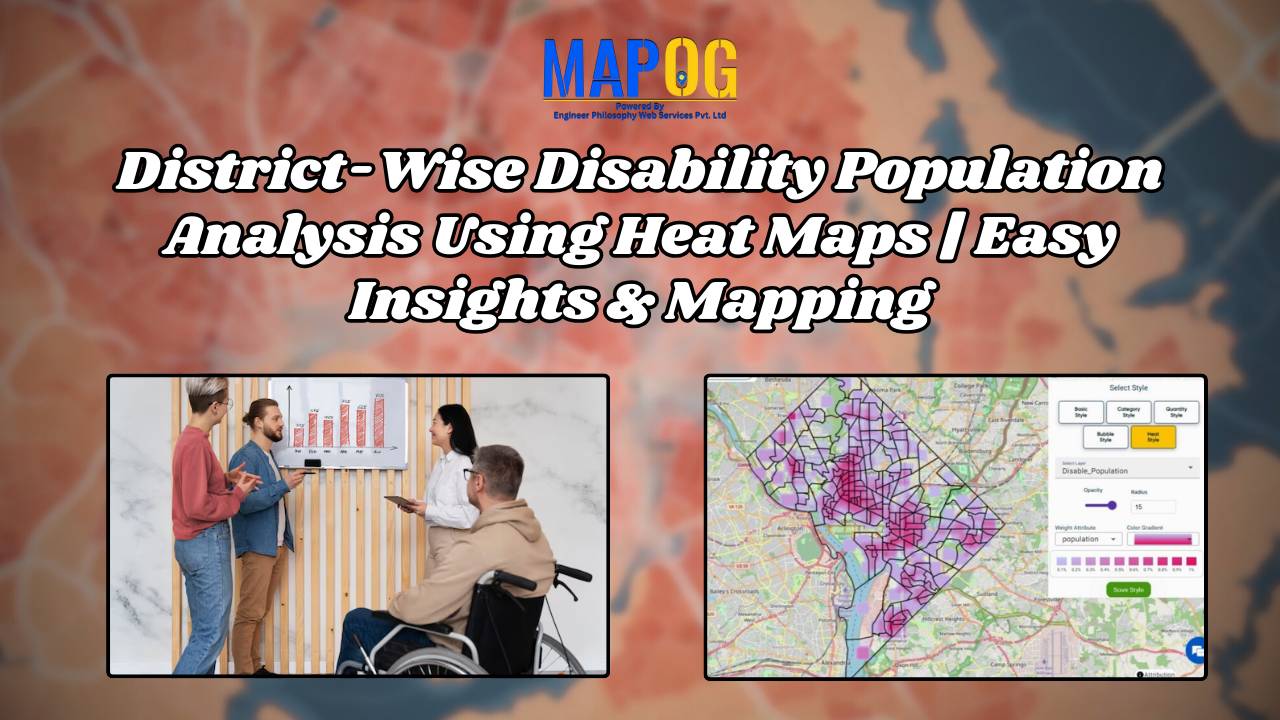
Dive into the world of Disability Population Heat Map Analysis, where advanced mapping techniques provide district-wise insights with ease. By leveraging heat maps, we simplify complex data interpretation, offering a clear visual representation of disability distribution. This approach empowers policymakers, urban planners, and organizations to make informed decisions for improved accessibility and resource allocation. Explore … Read more