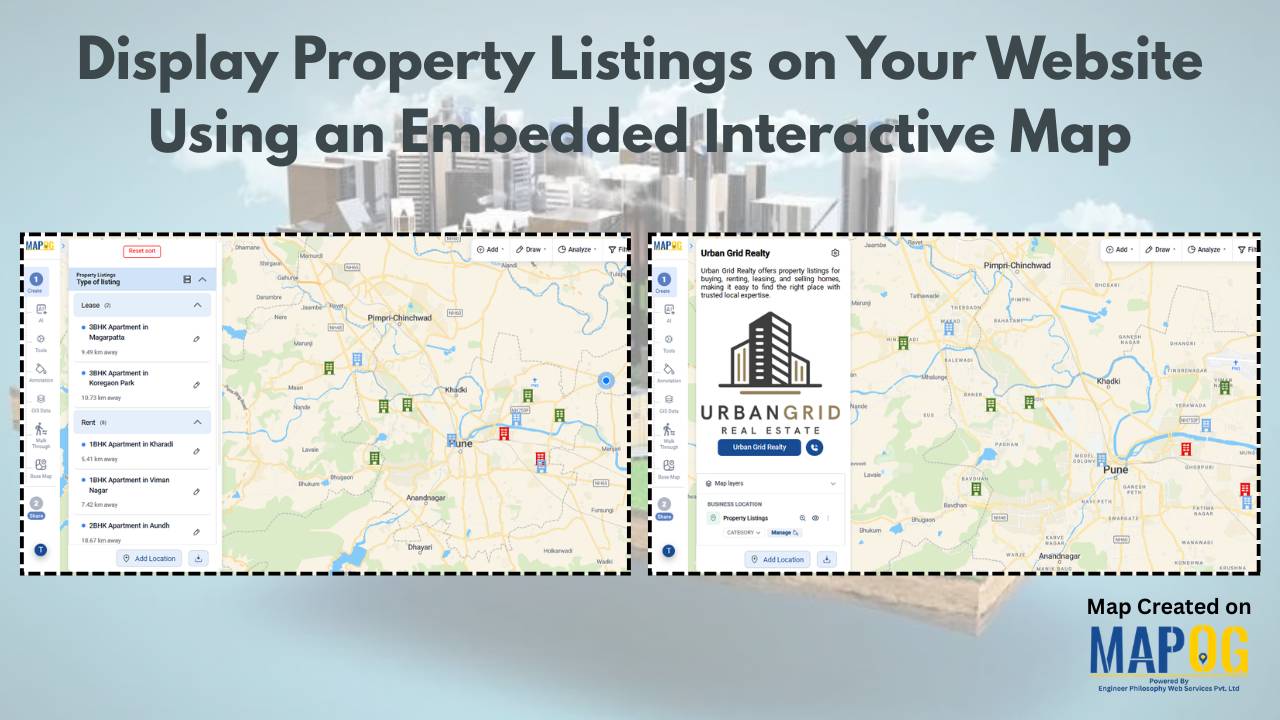
SpatialAnalysis

edit update points

Import Customer Feedback and Ratings into an Online Mapping Tool

Customer data often comes in spreadsheets filled with names, addresses, coordinates, and feedback—but viewing such information in raw tables can limit insight. By importing this data into MAPOG, additionally visualize customer locations, projects or buildings ratings, or import customer feedback into online mapping tool and reviews directly on an interactive map. This not only makes … Read more

Cover image

How to Combine All Customer Data from the Field Into One Clean Map

To combine all the customer data from the field is a common challenge for organizations. Teams collect location details, service feedback, and on-site observations through a mix of mobile apps, paper forms, and spreadsheets, but this mix of formats often leaves the data scattered and hard to interpret.  A unified map solves this problem by … Read more

cover image

Color-Code Your Customers by Purchase Behavior on a Map

In today’s data-driven retail world, every customer leaves behind a digital footprint — where they live, how often they buy, and how much they spend. Yet, even with this information it can be difficult to decipher the bigger picture or understand where your most valuable customers actually come from. That’s why visualizing customer data matters. … Read more

visualize customer segments

Visualize Different Customer Segments in Different Colors on a Map

Every retail company wants to know where their customers are and how much they spend. Yet, in a busy city, even with full address data, spotting spending patterns can be difficult. High, medium and low-value customers are often scattered, making it hard to plan effectively. As a result, strategic decisions such as store expansion, marketing … Read more

Smart Labelling

Smart Labelling in Maps: How to Create Clear, Interactive, and Professional Map Designs

In today’s world, where Interactive maps have become an essential tool for everything from navigation to data analysis, clarity and readability are key. A map becomes effective when it presents its data clearly and meaningfully. One of the most overlooked yet crucial elements of good map design is smart labelling; the art of making map … Read more

Identify High-Density Customer Areas

How to Identify High-Density Customer Areas Using Interactive Maps

In every business, understanding where your customers truly come from can completely transform your growth strategy. Moreover, when you Identify High-Density Customer Areas, it becomes easier to plan expansion, target marketing efforts, and optimize logistics efficiently. For instance, imagine having a store in one area where only 20% of your customers are local, yet 80% … Read more

analyze customer distribution

How to Analyze Customer Distribution Using Map Layers

In today’s competitive market, businesses thrive when they analyze customer distribution effectively. Therefore, understanding where your customers come from, how frequently they purchase, and how their spending patterns vary across regions becomes crucial. Moreover, this insight helps you make smarter sales and marketing decisions. Fortunately, interactive mapping with MAPOG simplifies this process even further, allowing … Read more

How to Create a Shareable Map Portfolio from Excel/CSV Data

Create a shareable map portfolio from Excel/CSV data to bring your projects to life in a visually compelling way. Although spreadsheets are excellent for storing detailed information, they often fall short in conveying the scale, diversity, and geographic reach of your work. While using MAPOG, you can transform that same data into an interactive map … Read more

Creating 3D Building Maps

Creating 3D Building Maps for Your Real Estate Project

In the real estate industry, clients often struggle to understand brochures or flat layouts because they don’t provide enough clarity about building height, structure, or availability. 3D Building Maps can enhance communication by providing realistic height visualizations, property details, floor plans, and furnishing status for buildings. MAPOG make this process more intuitive through features such … Read more

Showing map view of customer locations with popups, created after uploading excel data of customer list

How to Upload Your Customer List (CSV or Excel) and Plot It on a Map

When you upload your customer list in Excel or CSV format, you’re storing useful details like names, addresses, and service records, but the data stays flat. That’s because spreadsheets don’t show you where customers are clustered, which areas are under served, or how your field teams move across zones. As a result, it’s hard to … Read more