In today’s data-driven world, maps are no longer just tools for navigation, they are powerful instruments for analysing patterns, making informed decisions, and solving complex problems. Whether Tracking Population and Literacy Data Attribute , Thematic Mapping for Data Analysis or a researcher visualising data, MAPOG is your go-to platform for creating professional, insightful maps. In this article, we’ll walk you through the process of creating a map using GIS for Cybersecurity and Geospatial Intelligence with MAPOG and explore how it can revolutionise your geospatial projects.
Key Concept for Using GIS for Cybersecurity and Geospatial Intelligence
The key concept of this article revolves around leveraging MAPOG as a powerful geospatial intelligence tool to create, analyse, and share professional maps for various applications, with a particular emphasis on data visualisation, customisation, collaboration, and cybersecurity. By offering intuitive tools for uploading GIS data, customising visualisations through heat maps and geospatial analysis, and facilitating real-time collaboration, MAPOG turns complex datasets into actionable insights, whether tracking cyberattack hotspots, optimising infrastructure security, or detecting fraud patterns. In this article, we’ll walk you through the process of creating a map using MAPOG and explore how it can revolutionise your geospatial projects.
Here are the Steps to Follow :
Step 1 : Upload GIS Data
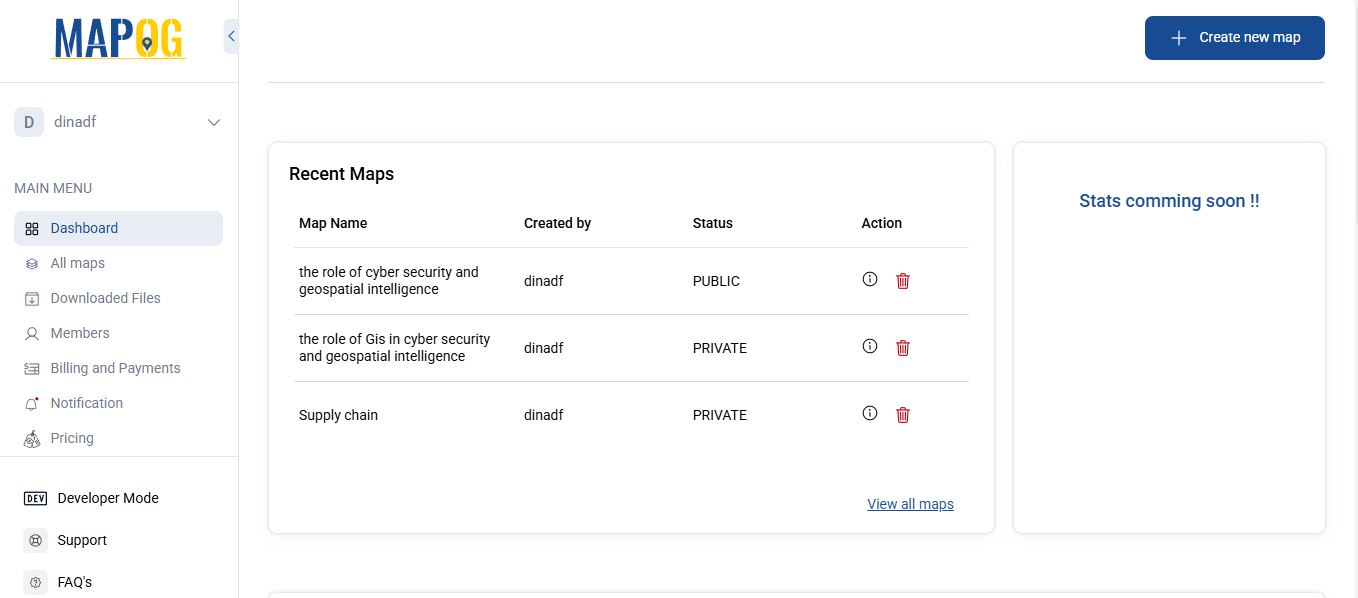
To begin your mapping journey, click on the “Create New Map” button. This will open a blank canvas where your map will come to life. It offers a variety of Base Maps to choose from, including satellite, terrain, and street views. It provides a clear and detailed layout for most projects.

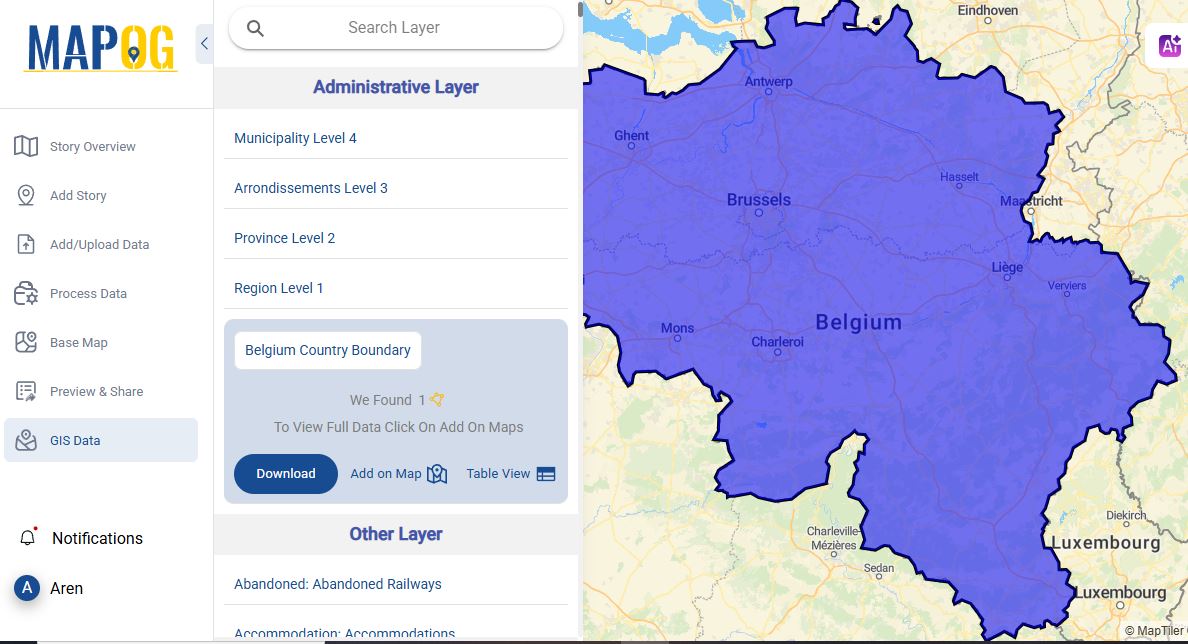
Once the canvas is ready, it’s time to add data in the map. MAPOG simplifies this process by providing access to a wealth of GIS data.
1. Select the country or region you’re interested in.
2. Search for specific data points, eg. Police stations, ATMs, or other landmarks
3. Click “Add to Map” to upload the data to your canvas.
Step 2: Styling and Analyzing Geospatial Data
MAPOG does more than just plot points, it transforms raw data into actionable insights for cybersecurity. Here’s how you can take your map to the next level:
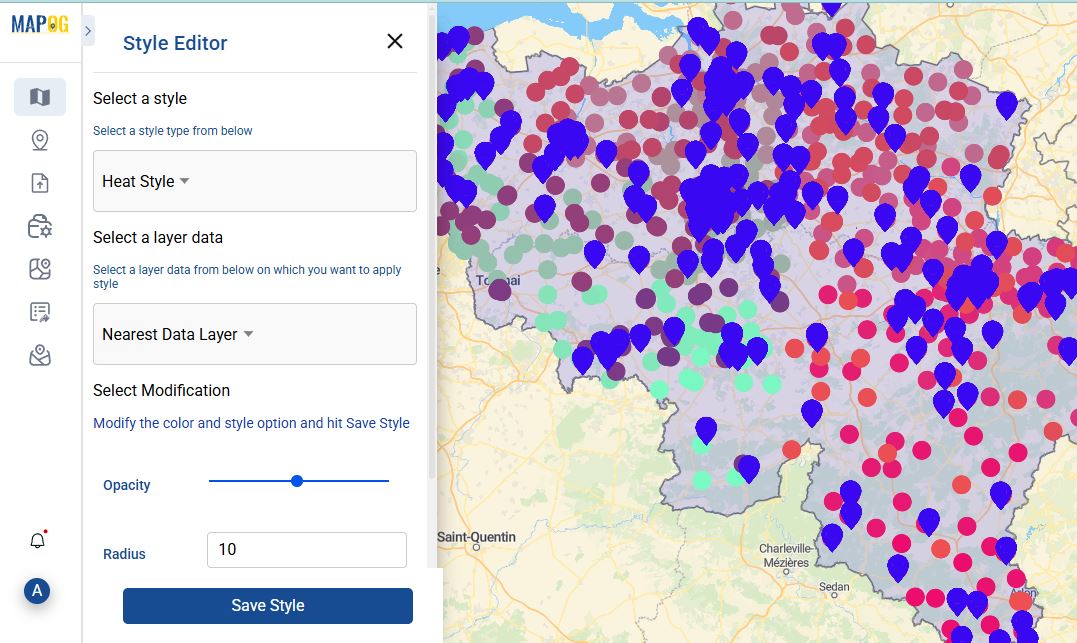
- Click on the “Action” button and select “Style Layer”.
- Choose “Heat Style” to visualize areas with high and low connectivity frequency. It is particularly useful for identifying patterns, like cybersecurity attack hotspots or areas with high user activity.
After uploading, customize how the data appears on your map. Change colors, adjust labels, or modify icons to make your map visually appealing and easy to interpret. Customization of the map not only conveys information effectively but also looks professional.
Step 3: Process Data
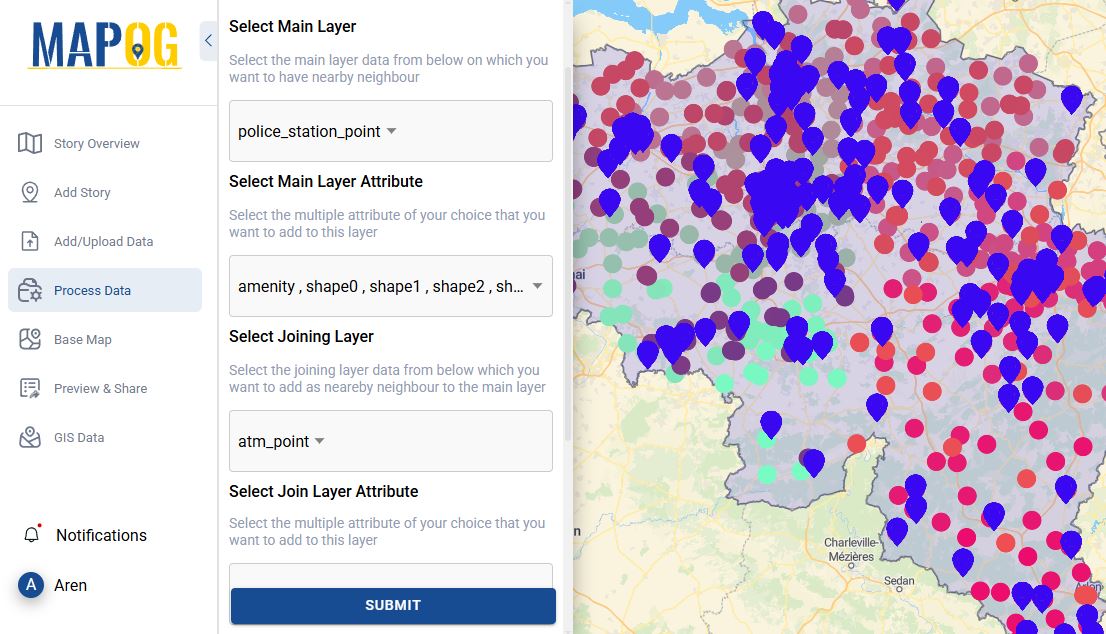
Use MAPOG’s powerful analysis tools to measure distances and identify trends in your data.
- Go to Process Tool and click “Near By Neighbour” and select the main layer, main attributes, select joining layer and set the radius to 3000 and limit to 10 and submit.
- Edit the layer from the “Action” button to “style layer” for better visualization of the data.
For example, if you are working on a cybersecurity project, use the “heat style” to effectively highlight geospatial regions with frequent cyberattacks. This approach helps to visually emphasize areas of high risk and prioritize attention accordingly.
Once your map is ready, MAPOG makes it easy to share your work with others:
- Share your map publicly or privately from Preview & Share via a link.
- Embed the map on a website or blog for wider access.
- Invite collaborators to edit or view your map, making it perfect for team projects or stakeholder input.

This collaborative feature ensures that everyone involved can contribute to the project, streamlining workflows and fostering innovation.
Industries and Domains Leveraging MAPOG for Cybersecurity
Cybersecurity is critical across the various industries and domains because of the increasing reliance on the digital systems, cloud computing, and data-driven operations. Below are key industries and domains where cybersecurity plays a vital role:
- Crime Mapping: GIS is used to analyze and predict cybercrime hotspots, like areas with high rates of online fraud or hacking. Eg. How to Create a Map for Crime Tracking: Mapping CCTV Cameras
- Emergency Response: Geospatial intelligence supports real-time situational awareness during cyber-physical incidents or attacks on critical infrastructure. Eg. Fast Emergency Response: Using GIS and Isochrone Maps for 10-Minute Ambulance Arrival
- Fraud Detection: GIS helps map and analyze the geographic patterns of cyber fraud, like phishing attacks or ATM skimming.
GIS Data Used in Cybersecurity
Conclusion
In today’s fast-paced, data-driven landscape, MAPOG proves to be an invaluable tool for professionals across various industries. If you’re working in cybersecurity, crime mapping, emergency response, fraud detection or data analyst, MAPOG’s versatile features allow you to create insightful, professional maps that transform raw data into actionable. Its powerful data analysis, customization options, and collaborative capabilities ensure that users can not only visualize complex data additionally make informed decisions and take proactive measures. With MAPOG, the possibilities for improving operational efficiency, enhancing security measures, and streamlining workflows are endless. By utilizing MAPOG’s intuitive platform, you can revolutionize the way you handle geospatial data projects, driving innovation and empowering teams to work smarter, not harder.
Explore more Blogs
Mapping Pedestrian Cross-points Near Educational Institutions: Enhancing Accessibility and Safety
Create a Map for Smart Farming: Agriculture Zones and Nearby Rivers for Sustainable Crop Planning
Creating GIS Maps for Optimizing Bank Branch and ATM Locations with ‘Near by Neighbour’ Analysis