Unveiling Noise Pollution: Worldwide Analysis In MAPOG, let us converge our means available and join in the task of using both technology and natural awareness, so that we may initiate a move towards the future of sustainability, using the language of noise, so let´s decipher it with accuracy and clarity. Through MAPOG, we can discover patterns pertaining to the location of noise sources, hotspots and diving deeper into solutions for a more peaceful and serene ecosystem.
Key Concepts for Worldwide Noise Pollution Analysis In MAPOG
Our goal is to simply illustrate the locations that are severely affected by noise pollution. This map’s thematic quality makes it evident that it offers meaningful information on the noise pollution in that area. The links for GIS DATA which we’re using here are mentioned at the end of the article.
In “Protecting Wetlands: Guide to Create GIS Map for Nature” where GIS emerges as a strong defender of endangered wetland ecosystems, start your adventure by learning its secrets.
Steps for Creating a Worldwide Noise Pollution Analysis In MAPOG
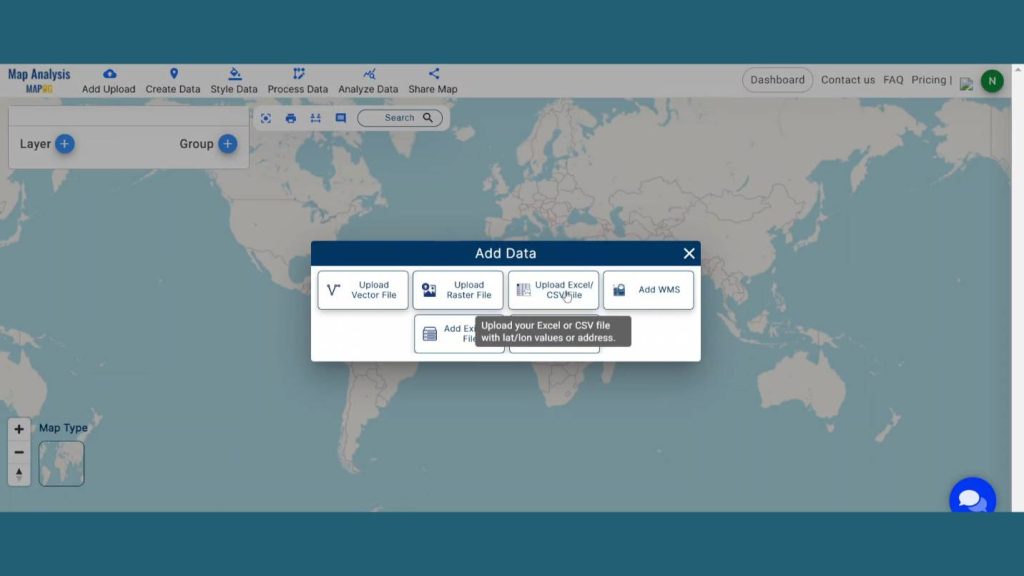
Step 1: Add Data
Now, open map analysis interface. Then click on the Add Upload button from the header. A dialogue box will open. Click on Upload Excel/CSV file to upload the data.
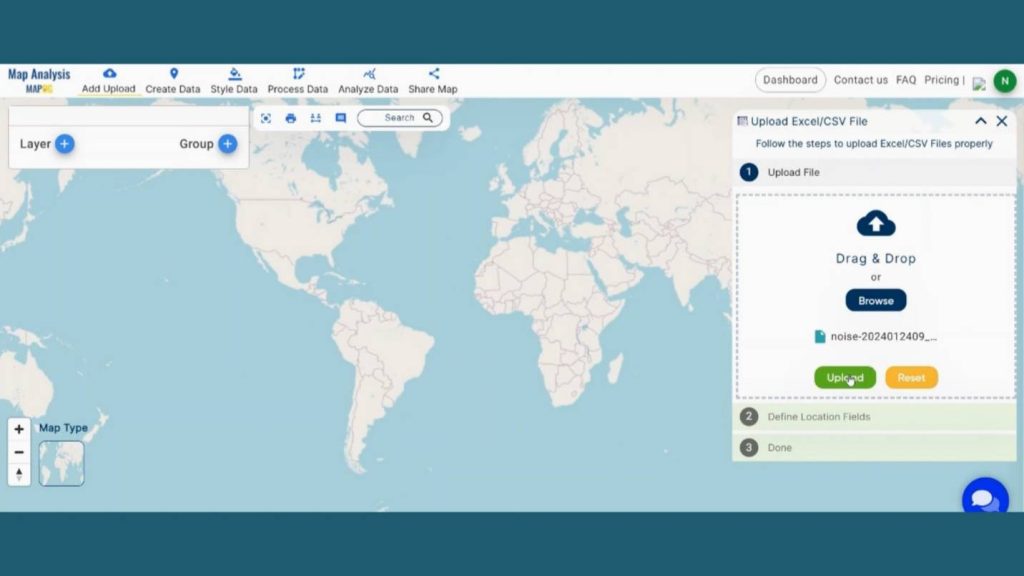
A box will open on the right side of the screen, select the browse option to browse the data & click Upload to upload the data.
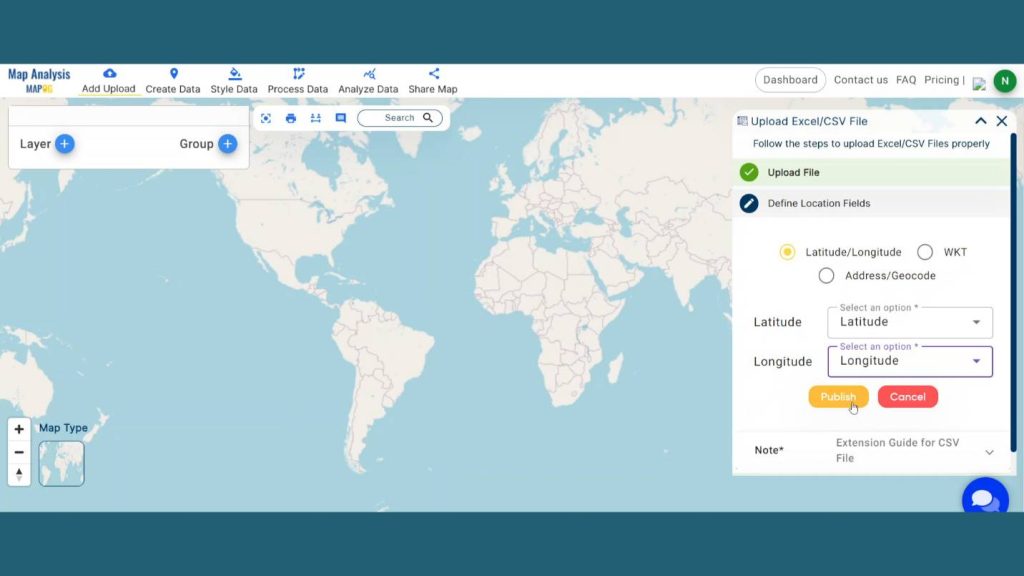
Then in Locational field Select the Latitude /Longitude option and select Latitude & Longitude from the options from drop down menu and Publish it.
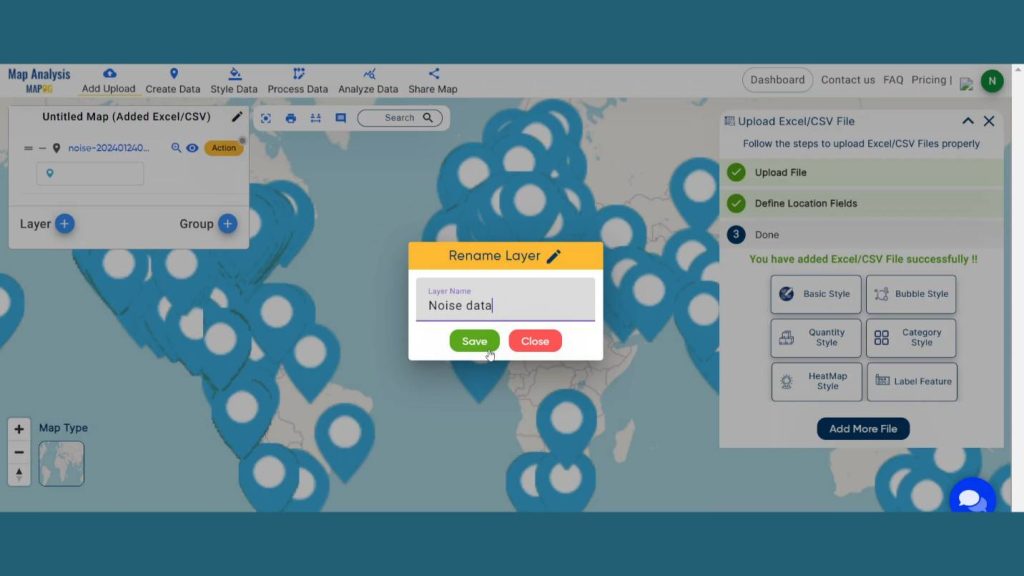
Step 2: Rename Layer
Rename the layer for better understanding. Press the Action button of the newly added layer and click on the pencil icon. Write name and description and save the map.
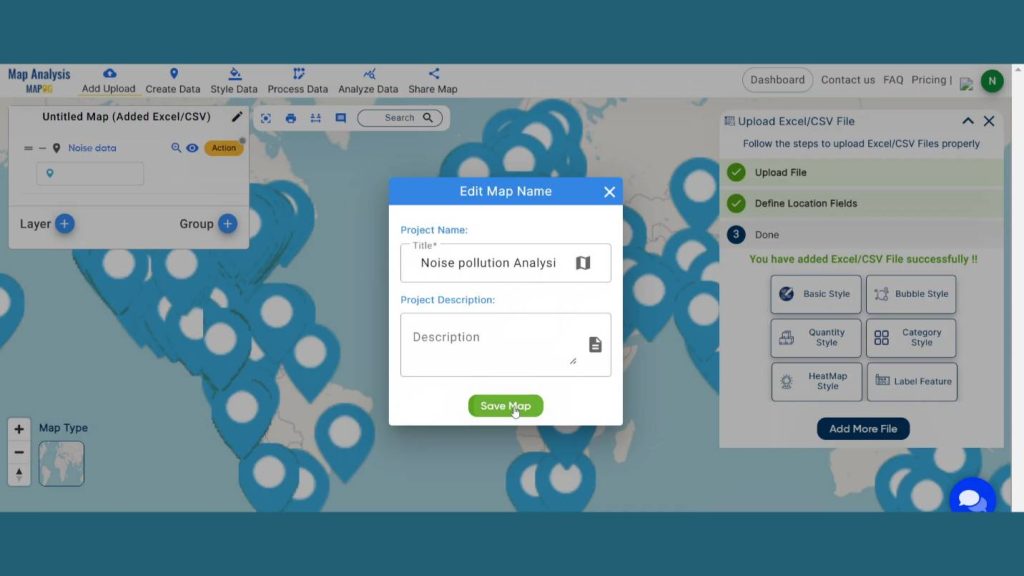
Step 3: Save Map
Now, click on the pencil icon situated right after the “Untitled Map” text to save the project. In the dialogue box write proper name and description that describe the project accurately. And click on Save map option. Your project will be saved.
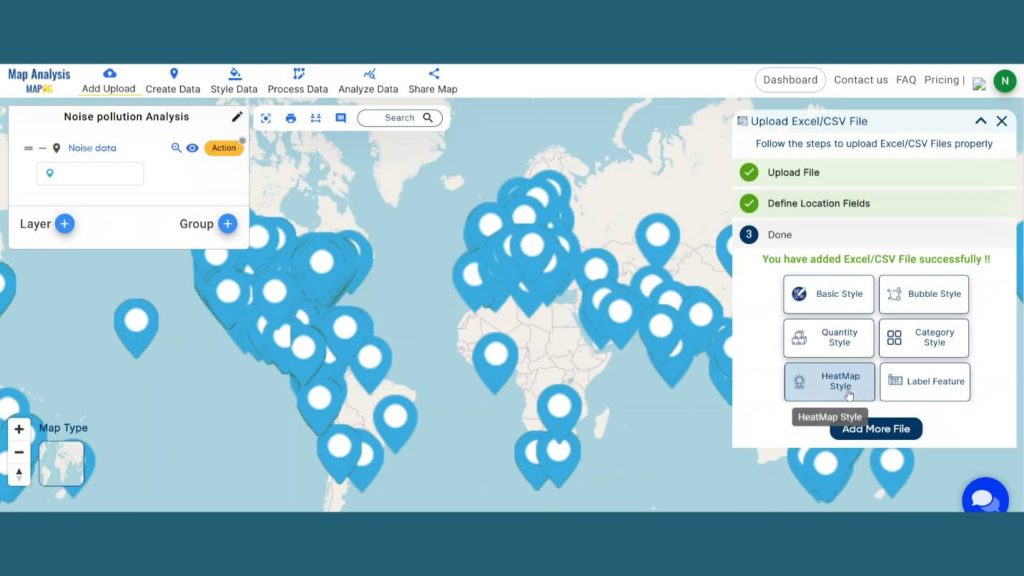
Step 4: Add Heat map style
After saving the map go to the box at the right side of the canvas. Then choose the Heat map style option.
Learn how to use the heat map style to visualize pollution hotspots so that communities and policymakers may more effectively manage air quality issues. This is covered in “Mapping Air Quality Index: Air Pollution Monitoring“. Heat maps facilitate targeted responses and increase public awareness by offering clear, color-coded information into pollution levels.
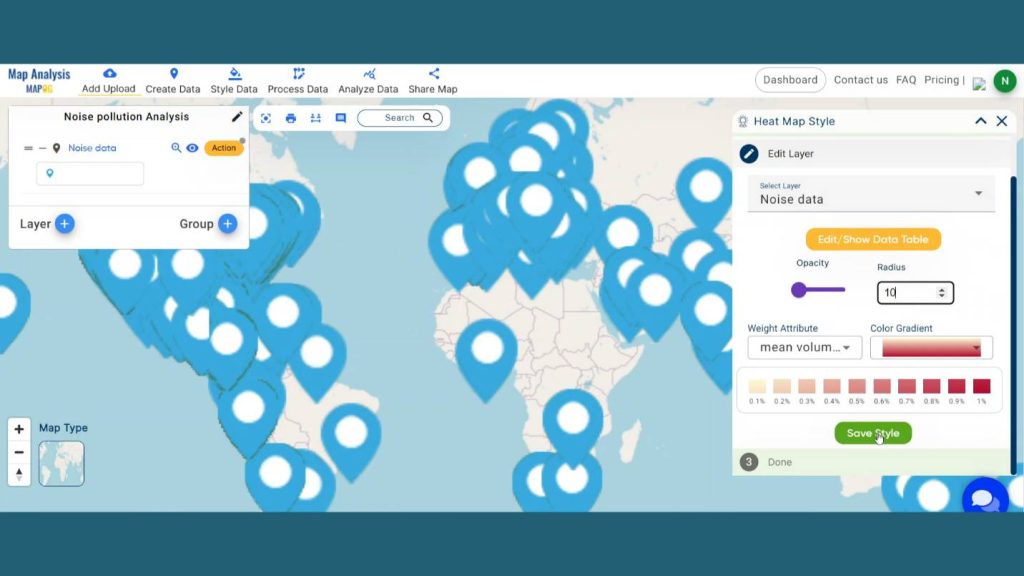
In the edit layer option select the layer to be published and select the mean volume (dba) as selected attribute. Select a suitable color and radius that give proper value to the project. Lastly Save the style to visualize the map.
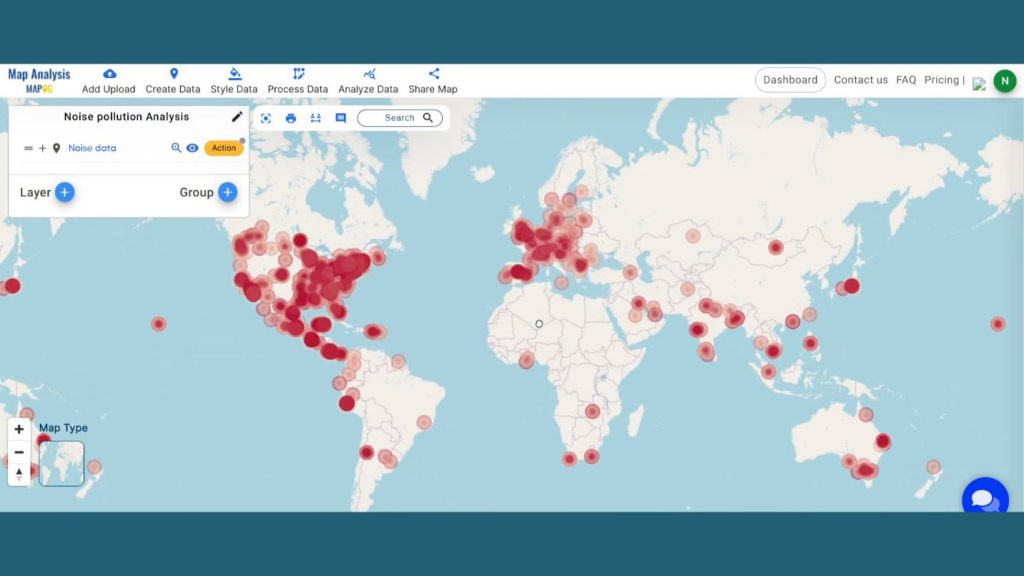
Step 7: Results & Analysis
With our map now enriched with details, let’s make those final adjustments. This map is a powerful tool for Precision Planning, Environmental Conservation, Infrastructure Optimization, Regulatory Compliance and beyond. Now the map vividly illustrates the places where most of the Noise Pollution occurs.
Major Findings
Global Trends Identification: MAPOG aids in analyzing global noise pollution trends by identifying common patterns, hotspots, and areas experiencing significant noise pollution, providing a comprehensive understanding of the global soundscape.
Cross-Border Impact Assessment: MAPOG allows for comprehensive noise pollution analysis across regions, enabling authorities to evaluate neighboring communities’ effects and promoting international collaboration for effective mitigation strategies.
Comparative Studies for Policy Development: MAPOG allows for global comparison of noise pollution levels, enabling policymakers to develop robust policies and regulations that align with global best practices for noise control and environmental sustainability.
Domain and Industry
Gain invaluable insights into the geographical distribution, intensity, and temporal variations of worldwide noise pollution. This map is a powerful tool for Regulatory Compliance, Educational Enhancement, Health Impact Assessment, and Community Engagement.
Get an in-depth understanding of the changing realm of urban planning by reading “GIS Analysis in Urban Planning: Reshaping Transportation Future Insights of state/city” and see how GIS can play a revolutionary role in maximizing transportation for a sustainable and connected future.
Conclusion
I’ve found that utilizing MAPOG’s Heat Map Style has been pivotal in Unveiling Noise Pollution: Worldwide Analysis In MAPOG with flourishing details. In summary, this visual insight will help you make informed decision. This will help the Urban Planning Departments to identify noise hotspots and Understanding noise patterns helps public health officials evaluate the potential health risks associated with prolonged exposure, allowing for the development of effective public health interventions.
Here are some other blogs you might be interested in
- Protecting Wetlands: Guide to Create GIS Map for Nature
- GIS Analysis in Urban Planning: Reshaping Transportation Future Insights of state/city
- Fast Emergency Response: Using GIS and Isochrone Maps for 10-Minute Ambulance Arrival
- Mapping Tiger Attack Hotspots – Create an Online Map and Share
- Make Routes for Military Aerial Planning- Through Bearing angle and Distance calculation – Online Route Compass
- Mapping Healthcare Efficiency: GIS Buffer Analysis of Hospital Locations
- Add WMS- Two step online view of WMS layer on a map
- Plot ATM locations on a map and embed on your website
- Map habitat locations of endangered animals & keep track of their living