In data visualization, heat maps emerge as powerful tools for conveying information in an intuitive and visually engaging manner. Through the use of color gradients, heat maps offer valuable insights into population distribution, trends, and patterns. In this use case, we explore heat maps as a tool for mapping population data from a CSV file using MAPOG Map Analysis. Let’s embark on a journey to explore how to create a map to visualize population dynamics using heat maps. To know more about the uses of heat maps, read our latest blog on water quality analysis using heat maps.
Key Concept
Heat maps serve as powerful tools for visualizing population data, utilizing color gradients to represent data density. By providing a visually intuitive representation of population distribution, heat maps facilitate a deeper understanding of demographic dynamics. As educational tools, heat maps enable individuals to explore and interpret population data with clarity, contributing to informed decision-making and policy development.
Steps to Create a Map to Visualize Population Dynamics Using Heat Maps
Step 1: Add Data
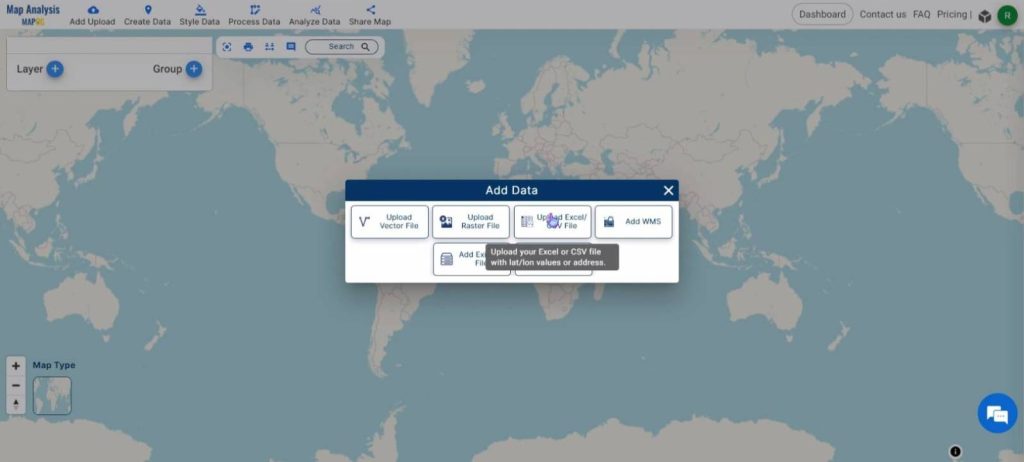
Open the MAPOG Map Analysis page and click on the Add Upload feature on the top ribbon. Select the Upload Excel/CSV option in the pop-up box.
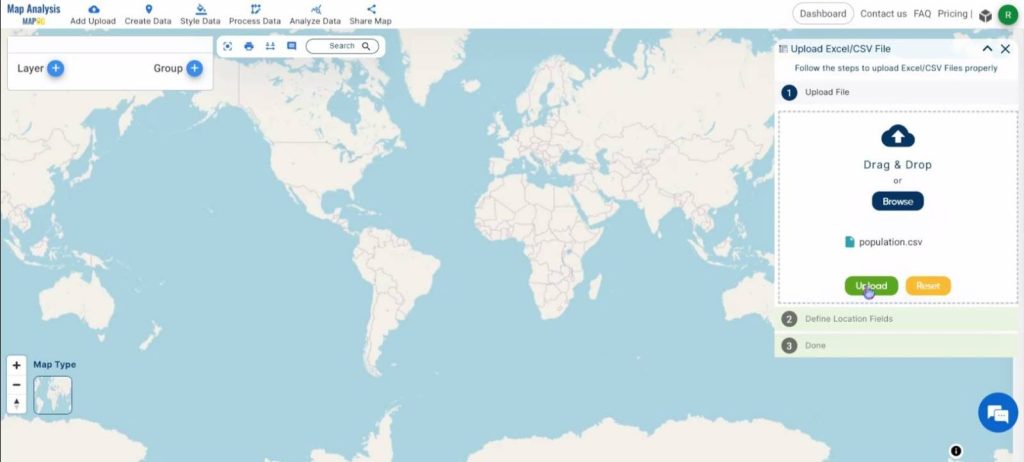
In the box that opens on the right, click on Browse and select the required CSV file. Then, click on Upload.
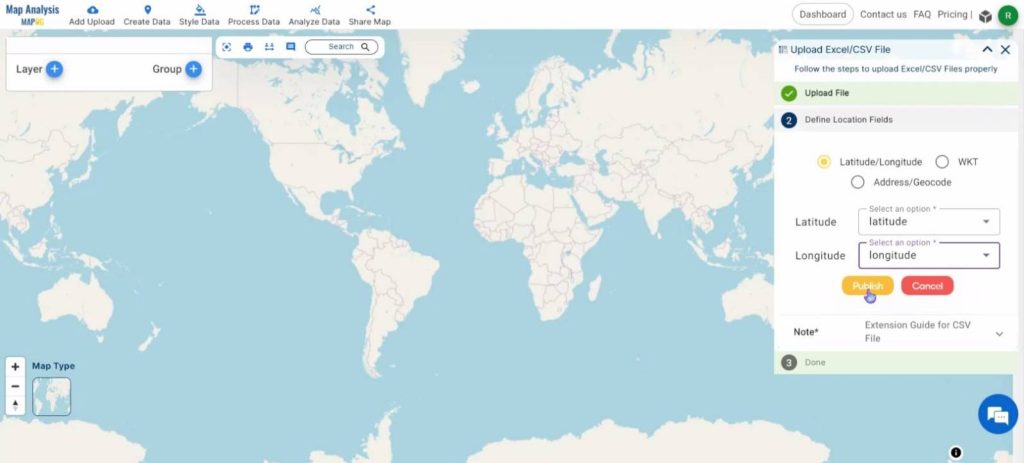
Assign the latitude and longitude values to their respective columns and then click on Publish.
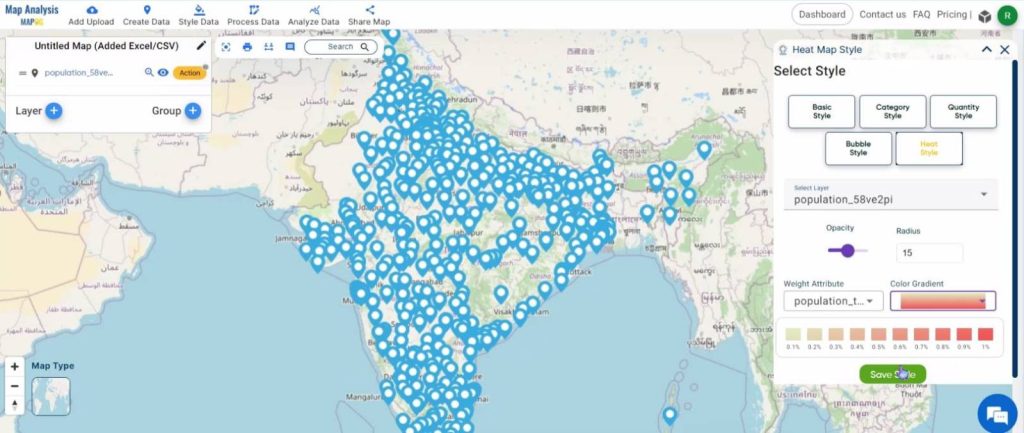
Next, click on Heat Map Style.
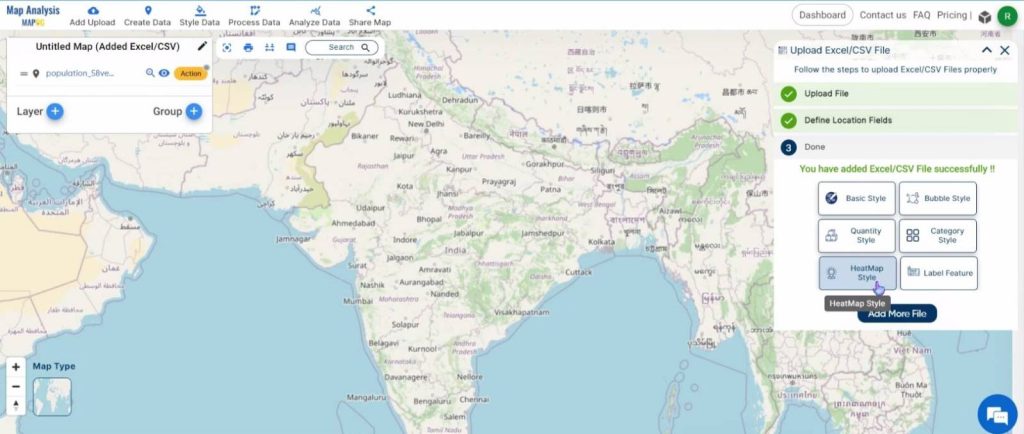
Then, select the uploaded layer from the drop-down box. Give an appropriate radius value and select the weight attribute. Finally, choose a color gradient and click on Save Map.
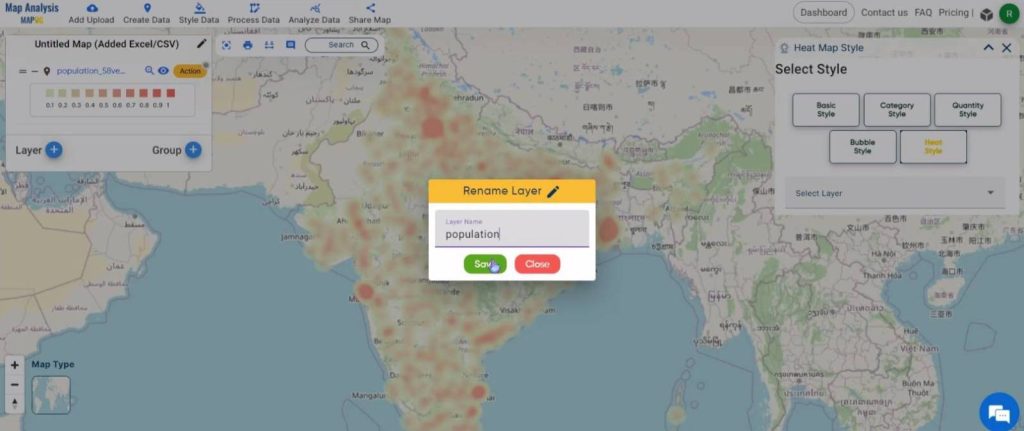
Step 2: Rename the layer and Map
Click on the Action button and then on the pencil icon near the name of the layer to change the name. Once given, click on Save.
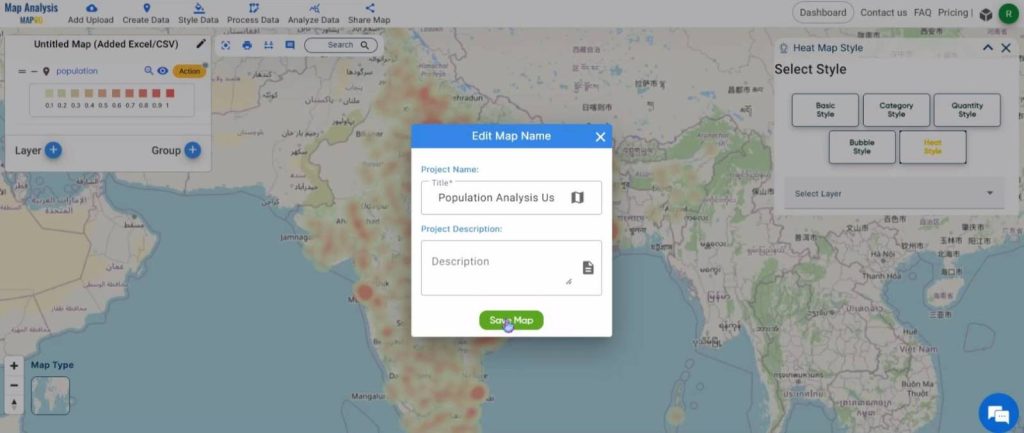
Click on the pencil icon near the name of the map to change its name. Once satisfied, click on Save Map.
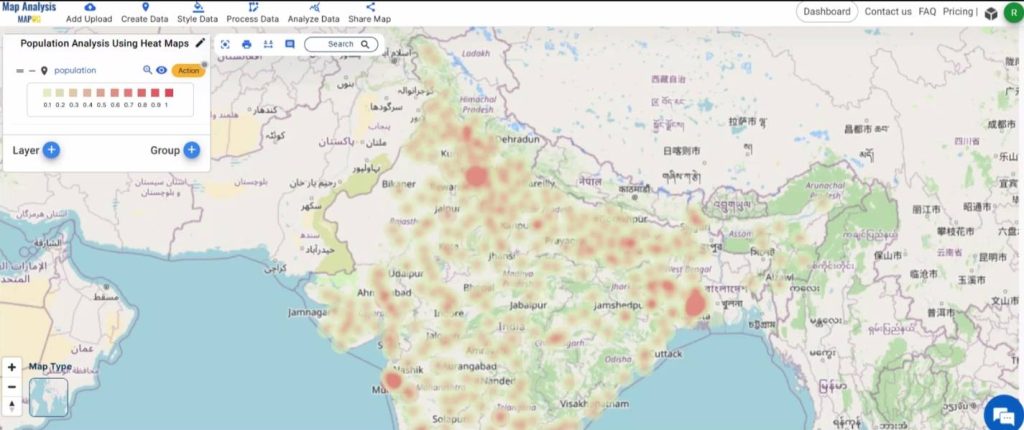
Shown below, is the final map.
Key Findings – Create a Map to Visualize Population Dynamics using Heat Maps
- Visual Clarity: Heat maps provide a visually clear representation of population density, allowing viewers to easily identify areas of high and low population concentrations.
- Trend Identification: Through heat maps, viewers can discern population distribution trends and patterns, such as urbanization, suburban sprawl, and rural depopulation.
- Data Interpretation: Heat maps enable individuals to interpret population data with ease, fostering a deeper understanding of demographic dynamics and societal trends.
- Decision Support: Heat maps serve as valuable decision-support tools for policymakers, urban planners, and researchers, aiding in the formulation of informed strategies and interventions to address population-related challenges.
Domain and Industry
- Policymakers and Urban Planners: Heat maps provide valuable insights for policymakers and urban planners, aiding in evidence-based decision-making related to population distribution, urban development, and resource allocation.
- Businesses and Entrepreneurs: Businesses and entrepreneurs utilize heat maps to identify market opportunities, target consumer segments, and make informed decisions about business expansion and location strategies based on population demographics.
Conclusion
In conclusion, heat maps serve as invaluable tools for visualizing population data and fostering a deeper understanding of demographic dynamics. Through their visually intuitive representation of population density, trends, and patterns, heat maps provide valuable insights for policymakers, researchers, government agencies, nonprofit organizations, businesses, educators, and the general public alike. By facilitating informed decision-making, targeted interventions, and public awareness about population-related issues, heat maps play a crucial role in addressing societal challenges and promoting sustainable development. As we continue to harness the power of heat maps in mapping population data, let us embrace their educational utility and communicative effectiveness to create positive impacts on communities and societies worldwide.
Other articles
- Protecting Wetlands: Guide to Create GIS Map for Nature
- GIS Analysis in Urban Planning: Reshaping Transportation Future Insights of state/city
- Fast Emergency Response: Using GIS and Isochrone Maps for 10-Minute Ambulance Arrival
- Mapping Tiger Attack Hotspots – Create an Online Map and Share
- Make Routes for Military Aerial Planning- Through Bearing angle and Distance calculation – Online Route Compass
- Mapping Healthcare Efficiency: GIS Buffer Analysis of Hospital Locations
- Add WMS- Two step online view of WMS layer on a map
- Plot ATM locations on a map and embed on your website
- Map habitat locations of endangered animals & keep track of their living
- Create a Map to find suitable sites for constructing a new house