By identifying crucial junctions with human infrastructure, “Wildlife Corridor Planning using Cross Intersection in MAPOG” guarantees safe animal migration and habitat connectivity. This strategy protects biodiversity while reducing conflict.
Key Concepts
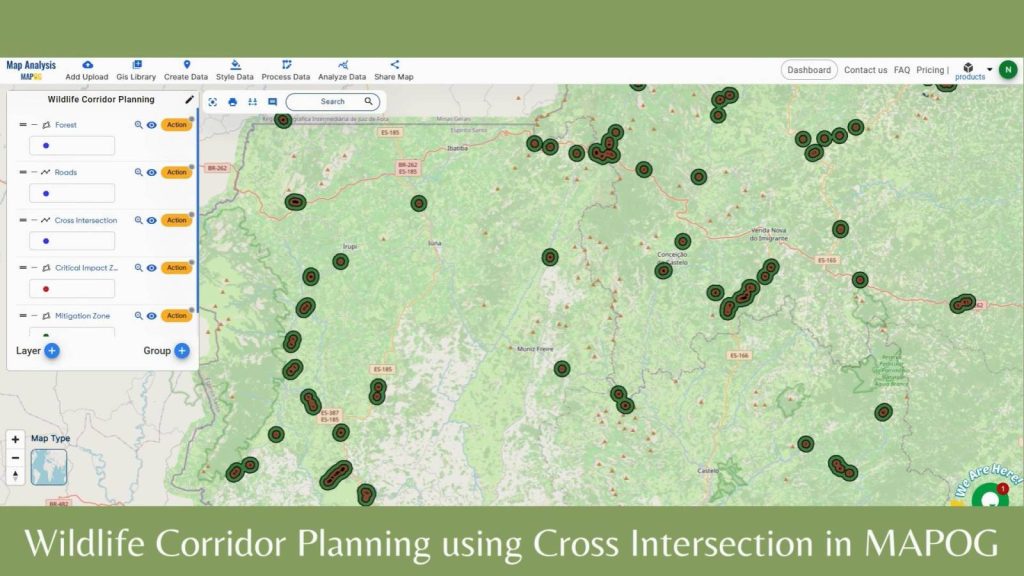
MAPOG’s Cross Intersection tool enables conservationists and planners to pinpoint critical intersections where wildlife corridors intersect infrastructure, enabling targeted mitigation strategies.
Download MAPOG App From Playstore
Steps to create Wildlife Corridor Planning using Cross Intersection
Step 1: Add Forest & Roads Data
First, navigate to the Map Analysis interface. Then click on the GIS Library button in the upper left corner. A dialogue box will open. There search for your desired country and add the Forest polygon & Highways data.
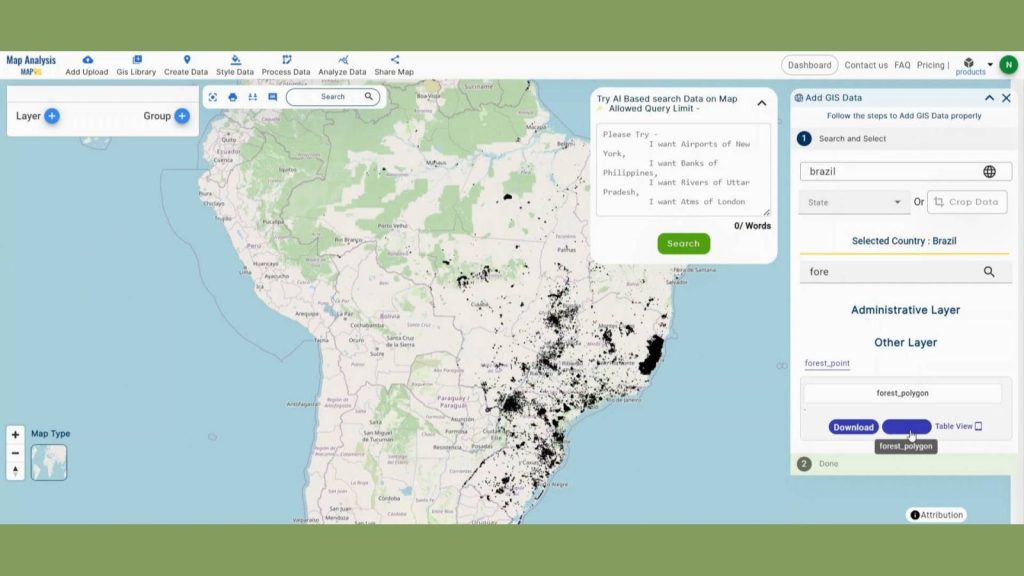
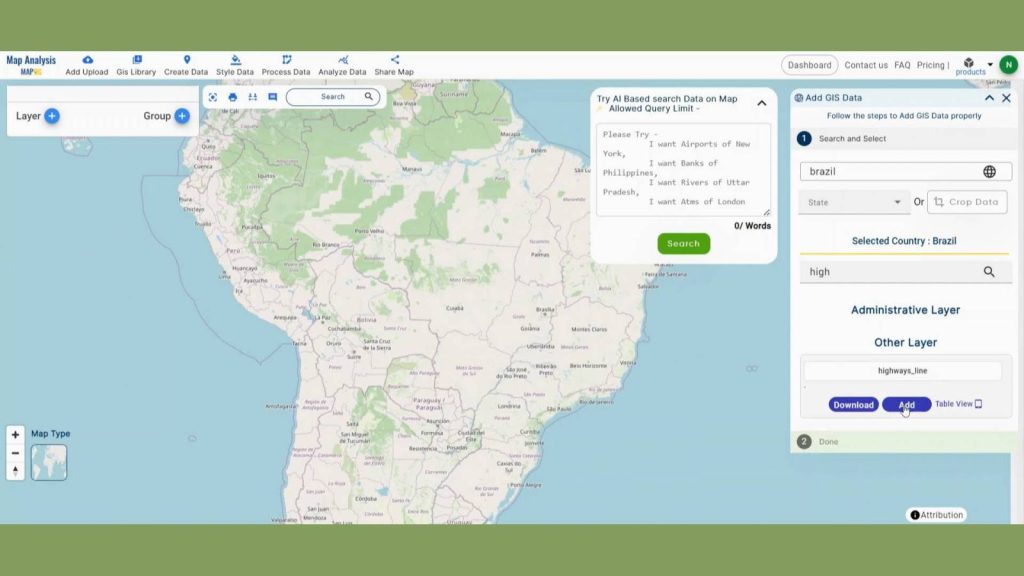
After adding those layers, rename them.
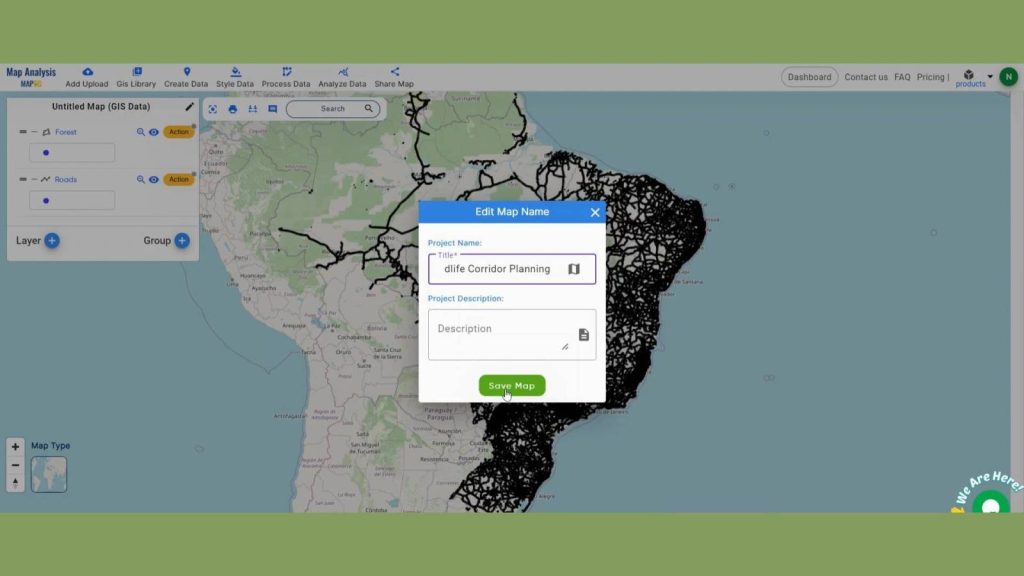
Step 2: Save Project
Now, click on the pencil icon situated right after the “Untitled Map” text to save the project. In the dialogue box write proper name and description that describe the project accurately. And click on save map option. Your project will be saved.
‘Road and Infrastructure Design and Alignment utilizing Bearing Angle and Distance Planning‘ allows you to achieve greater precision in your projects. Discover how MAPOG’s Route Compass improves accuracy and efficiency while changing infrastructure planning.
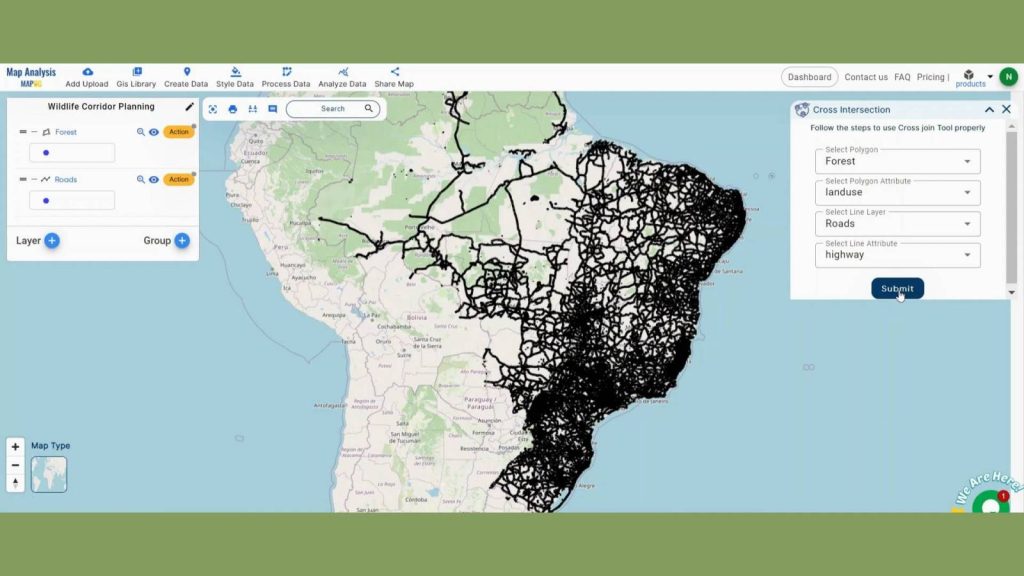
Step 3: Identify Cross Intersection
We will now Identify intersections to ensure safe animal movement. Click on the Cross Intersection option using the Process data option in the header.
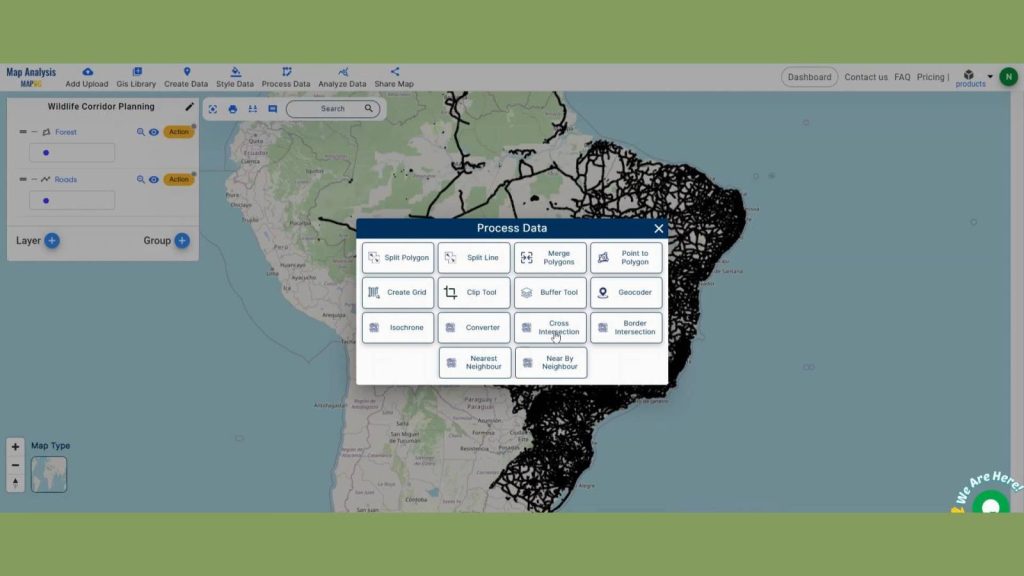
In the select polygon section provide the forest polygon layer and Select Polygon Attribute section provide the land use attribute of forest polygon. Next in the select line layer section provide the roads polyline layer and Select line Attribute section provide the highway attribute of Roads polyline. Lastly, Click submit.
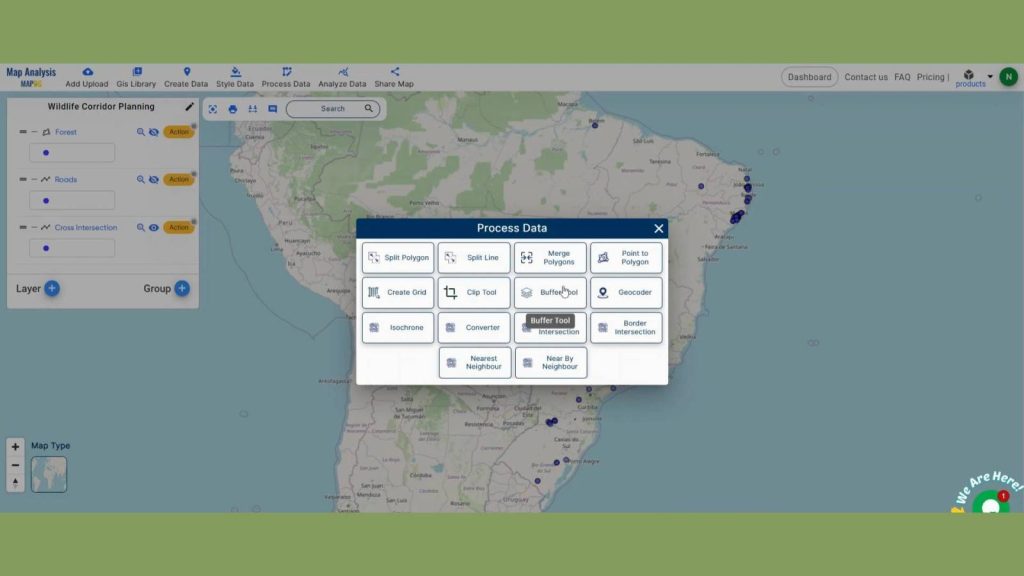
Step 3: Set Buffer Range
To set the buffer range go to process data, and click buffer tool.
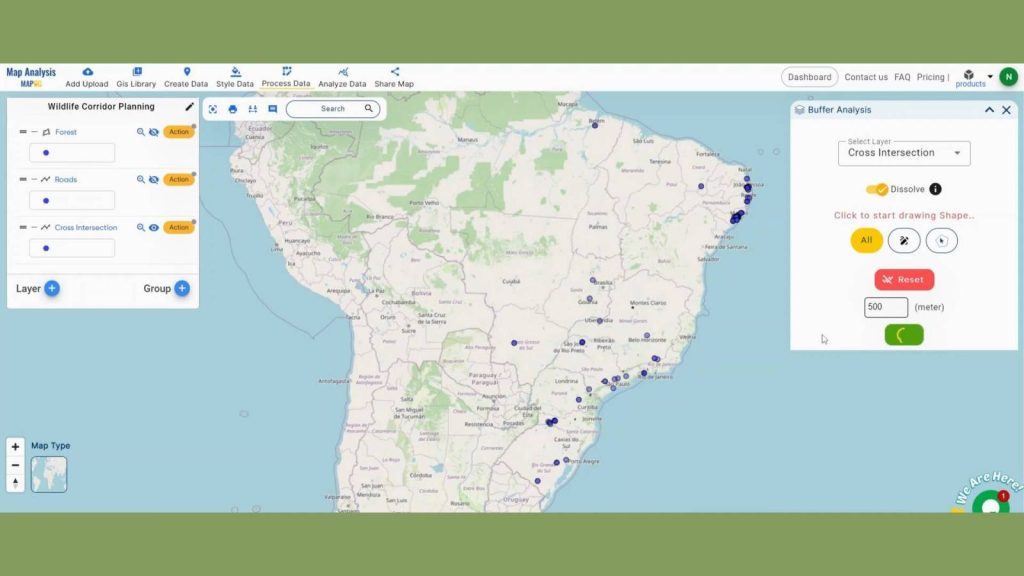
Select the Cross Intersection layer and set the buffer range as 500 meters by turning on the dissolve button.
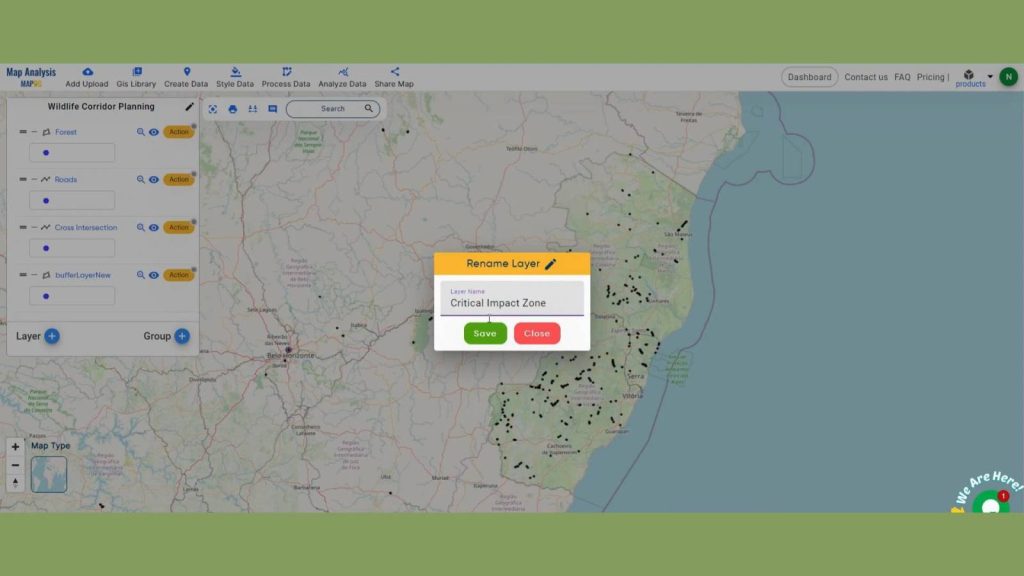
Rename the buffer layer as “Critical Impact Zone”.
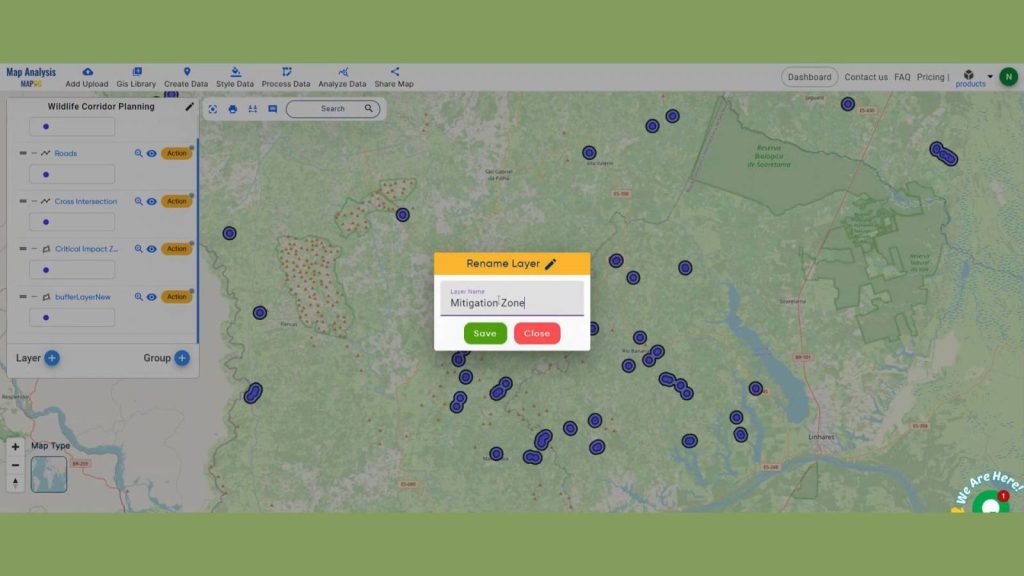
To make another buffer layer around cross section, do the same as before but set the range as 1000 meters.
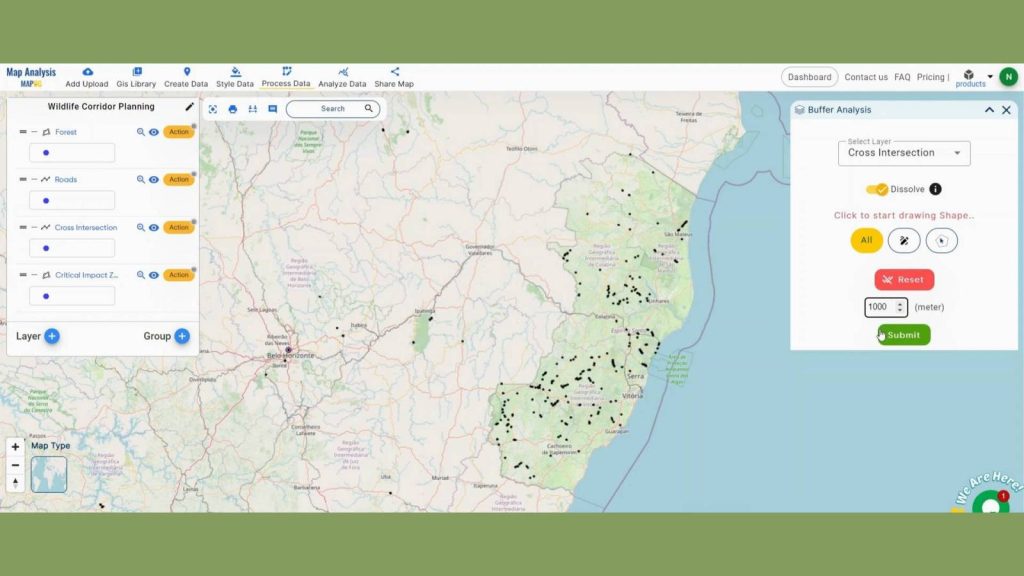
Rename the buffer layer as “Mitigation Zone”.
Learn how to improve urban planning with accurate proximity analysis and visually appealing thematic maps by reading ‘Creating an Online Interactive Map for Residential Land Use and Buffer Analysis with Thematic Visualization‘ in MAPOG. Make decisions more efficiently and effortlessly to maximize land use plans!
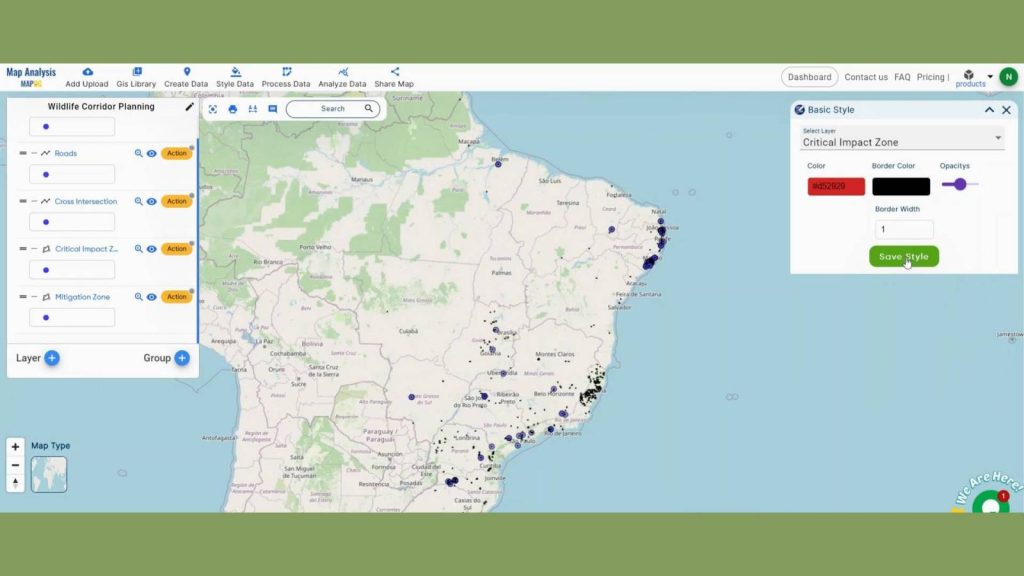
Step 4: Add Thematic Style
To take the whole thing to a new level by adding Basic style in the buffer layers. Go to the Style Data in the header and click on Basic style. Choose the Critical Impact Zone, Set the color as bright red to show the importance of this area.
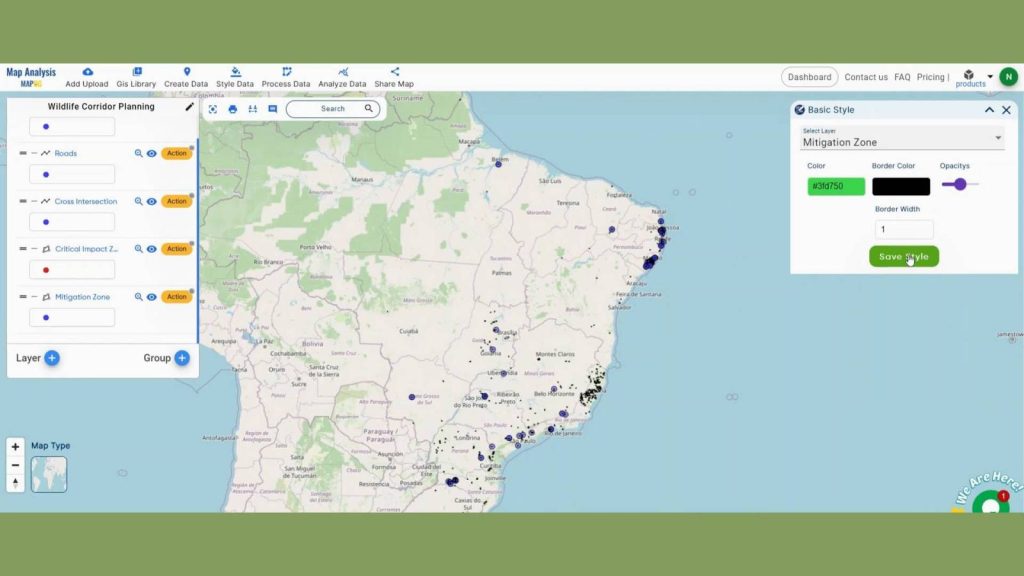
Here I’ve set green color for Mitigation Zone by using the basic styling.
Step 4: Results & Analysis
We prioritized the installation of wildlife crossings and underpasses at 15 crucial crossroads where wildlife corridors join major highways using MAPOG’s Cross Intersection tool. This focused strategy lowers wildlife mortality and improves habitat connectivity.
Major Findings
1. Identification of Critical Intersections: By using the Cross Intersection tool in MAPOG, we identified numerous critical intersections where wildlife corridors cross major highways and railways, highlighting areas with high potential for wildlife-vehicle collisions.
2. Impact Assessment Zones: The analysis revealed several high-risk zones where infrastructure significantly disrupts wildlife movement. These zones are prioritized for mitigation efforts based on the frequency of intersections and the severity of their impact on wildlife populations.
3. Mitigation Strategy Recommendations: The study provided specific recommendations for each identified intersection, including the construction of wildlife overpasses and underpasses, installation of fencing along highways, and creation of buffer zones, aimed at improving wildlife connectivity and reducing mortality rates.
Domain and Industry
This map is a powerful tool for Enhanced Connectivity, Reduced Mortality, Informed Planning and beyond.
Explore the effects of quarries on the environment by using the ‘Create Map for Pollution Impact Analysis around Quarries‘ Examine how the use of buffer and clip tools can help reveal the level of contamination and enable well-informed judgements regarding public health and conservation.
Questions
- How can the Cross Intersection tool in MAPOG be used to identify critical intersections between wildlife corridors and major infrastructure such as roads and railways?
- What data layers and attributes are essential for conducting a Cross Intersection analysis to support wildlife corridor planning in MAPOG?
- How can the impact of identified intersections on wildlife movement be assessed and prioritized for mitigation strategies using MAPOG
Conclusion
The use of the Cross Intersection tool in MAPOG for wildlife corridor planning provides a systematic approach to identifying and mitigating the impacts of infrastructure on wildlife movement. This methodology supports the creation of safer, more connected habitats, promoting the long-term sustainability of wildlife populations and reducing human-wildlife conflicts.
LINKS FOR THE DATA 👍
Here are some other blogs you might be interested in
- Create a Map for Pipeline Impact Zones: A Step-by-Step Guide
- Revolutionizing EIAs: The Role of GIS Maps, Bearing Angle, Route Compass, and Distance in Civil Engineering
- Creating an Online Interactive Map for Residential Land Use and Buffer Analysis with Thematic Visualization
- Grid Mapping for Accurate Spatial Analysis: Divide and Conquer with GRID Map Tool